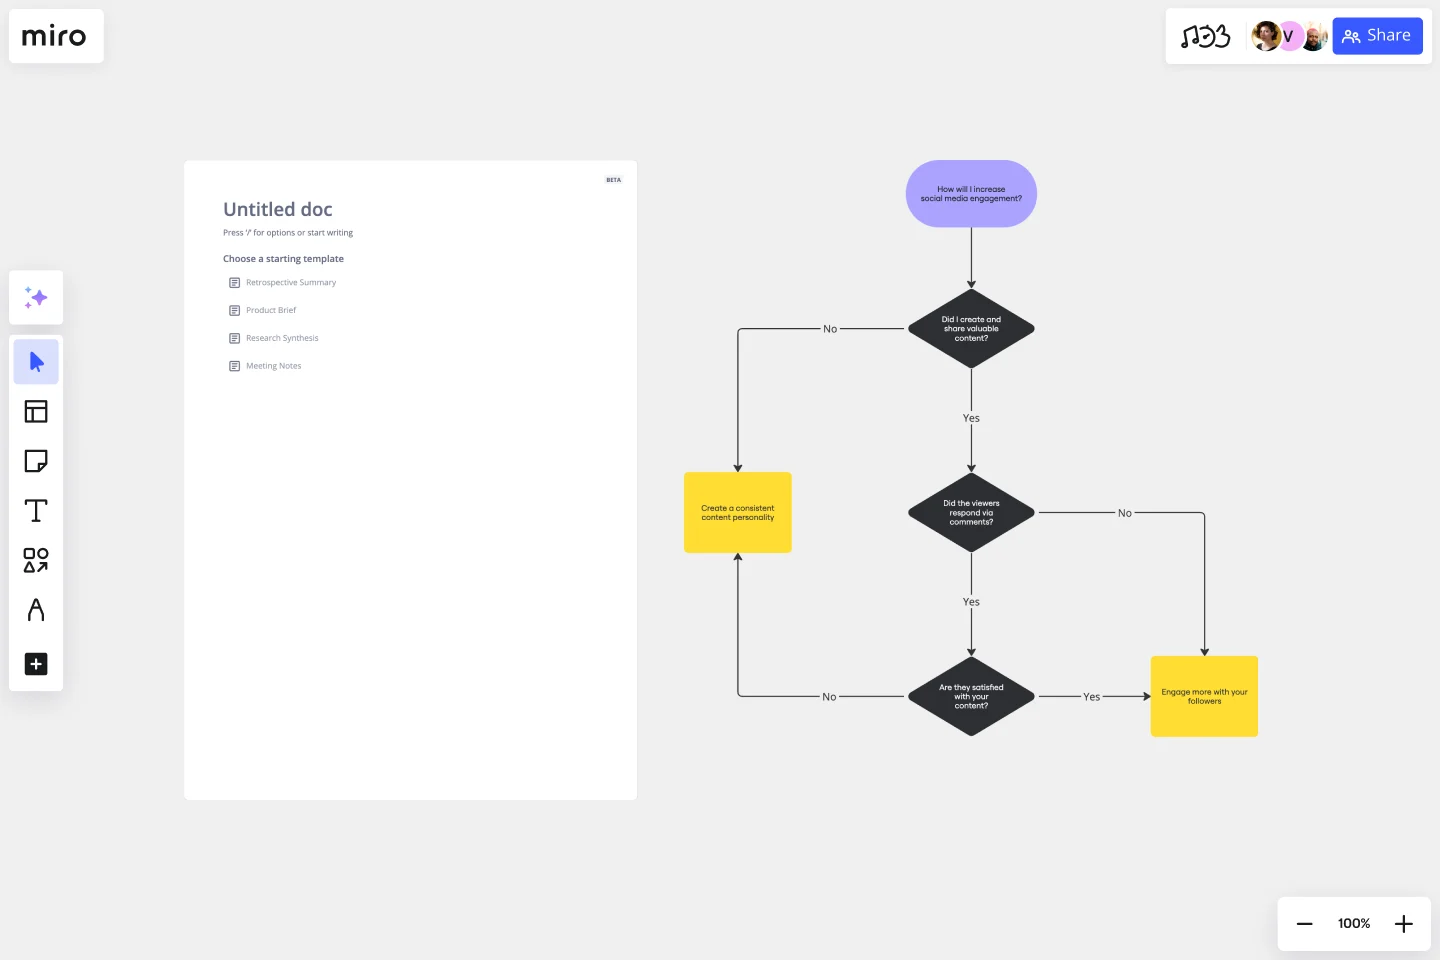
Yes No Flowchart Template
Improve decision-making with the yes no flowchart template.
About the Yes-No Flowchart Template
Taking a logical and systematic approach to decision-making can significantly improve the efficiency of project planning and execution. One helpful tool for this is the use of a yes-no flowchart template. These flowcharts offer an easy-to-understand way to visualize decision points and their subsequent outcomes. By using predefined graphical representations, people and teams can map out binary decisions and actions with ease.
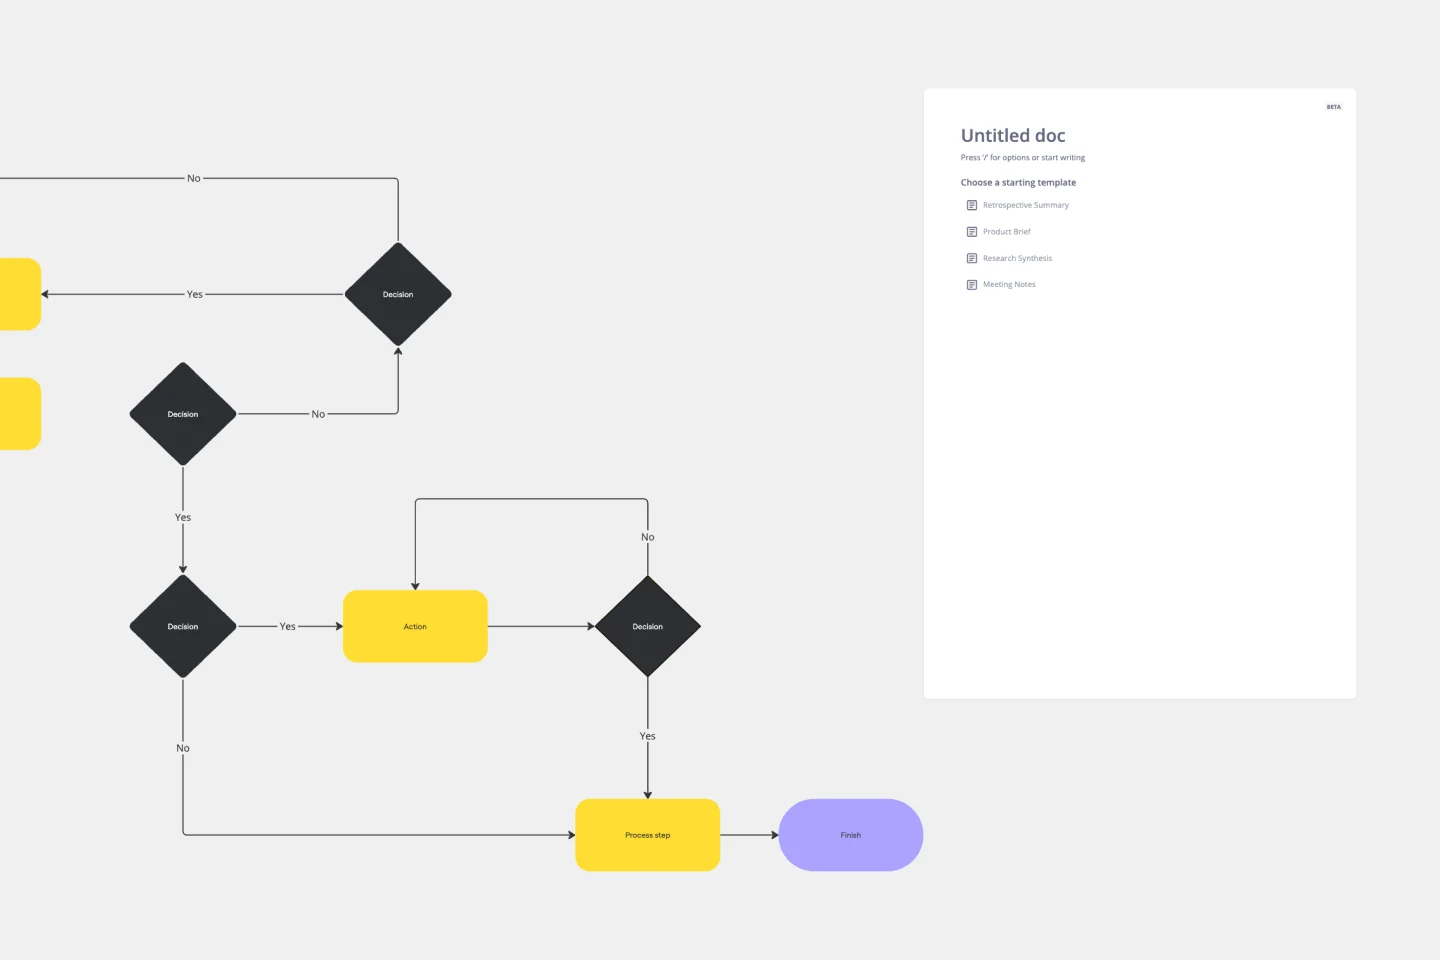
The flowcharts use standard shapes such as rectangles, diamonds, and ovals to represent processes, decisions, and endpoints. With arrows connecting each shape, viewers can effortlessly navigate from one step to the next based on their yes or no decisions.
Overall, using yes-no flowcharts is a simple yet powerful way to streamline project planning and execution.
How to use the yes-no flowchart template
Edit easily: Start by clicking on any shape or text. Change the content to suit your specific process or decision point.
Expand the flow: If your decision-making process is more complex, add more shapes by clicking on the shape's blue dots. The automated diagramming feature ensures that connector lines adjust themselves automatically.
Add context: Enrich your flowchart by dragging any artifact onto your workspace. This can be images, documents, or links that give additional information or clarity about a particular step or decision.
Why should you use a yes-no flowchart template?
Clarity: Flowcharts break down complex processes into simple, visual steps everyone can understand. This promotes clear communication and ensures that everyone knows exactly what needs to be done.
Efficiency: Visual representations are faster and more effective in conveying processes than lengthy explanations or written documents. This helps teams to save time and effort while ensuring that nothing is overlooked.
Flexibility: Flowchart templates can be tailored to fit any process or decision-making sequence, regardless of the industry or domain. This means they can be used in various contexts and adapted to suit specific needs.
Collaboration: Flowcharts promote collaboration by allowing team members to work on, comment on, and review the same document simultaneously. This makes it easier to incorporate feedback and ensures that everyone is on the same page.
Error reduction: By mapping out all possible outcomes in advance, teams can identify potential problems and address them proactively. This helps to reduce the risk of errors, bottlenecks, and other issues that can derail a process.
If you'd prefer to diagram from scratch, Miro's easy-to-use flowchart creator will help you build an online flowchart in no time. With Miro's collaboration features, you can workshop it with your team and easily share it with others for feedback.
What shapes are commonly used in the yes-no flowchart template?
The commonly used shapes are rectangles (for processes or actions), diamonds (for decision points), and ovals (for start or endpoints). Each shape serves a distinct purpose in the flowchart.
Can I integrate external data or links into the flowchart?
Absolutely! You can drag and drop any external artifact onto the workspace. This can include, but is not limited to, images, documents, or web links.
Is the template adjustable in size and layout?
Yes, the template is fully customizable. You can adjust the size of shapes, reposition them, or change the flow direction as per your needs.
How do I share or present the completed flowchart to my team?
Once you've tailored the flowchart to your satisfaction, you can present it within the platform or export it in various formats for sharing or printing.
Get started with this template right now.
Production Flowchart Template
Works best for:
Flowcharts
The Production Flowchart Template is a well-crafted tool that clearly represents a production process from start to finish. It breaks down complex procedures into easy-to-understand segments, making it easier for stakeholders to grasp the entire process. One of the key benefits of using this template is that it helps to clarify complex production pathways. By mapping out operations visually, teams can identify potential bottlenecks or inefficiencies, facilitating timely and well-informed decision-making.
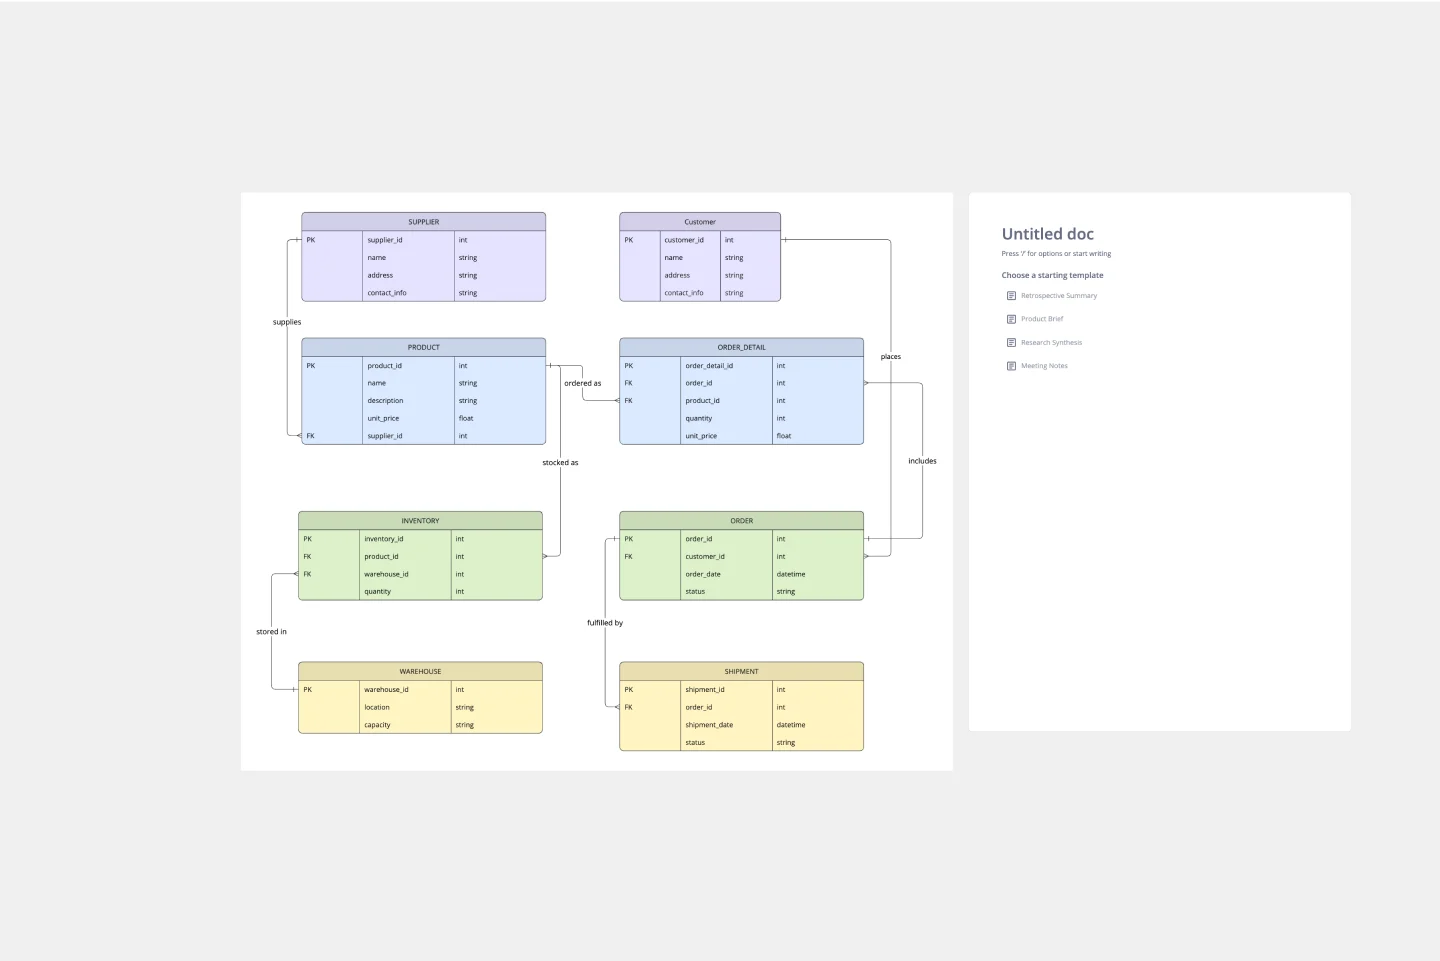
ERD Supply Chain Management System Template
Works best for:
ERD
The ERD Supply Chain Management System Template streamlines and optimizes supply chain operations. It serves as a visual support that helps businesses understand and manage the complex relationships between different entities within their supply chain, such as suppliers, products, inventory, orders, and shipments. By providing a clear visualization of these relationships, the template enables users to identify inefficiencies and areas for improvement, facilitating strategic decision-making.
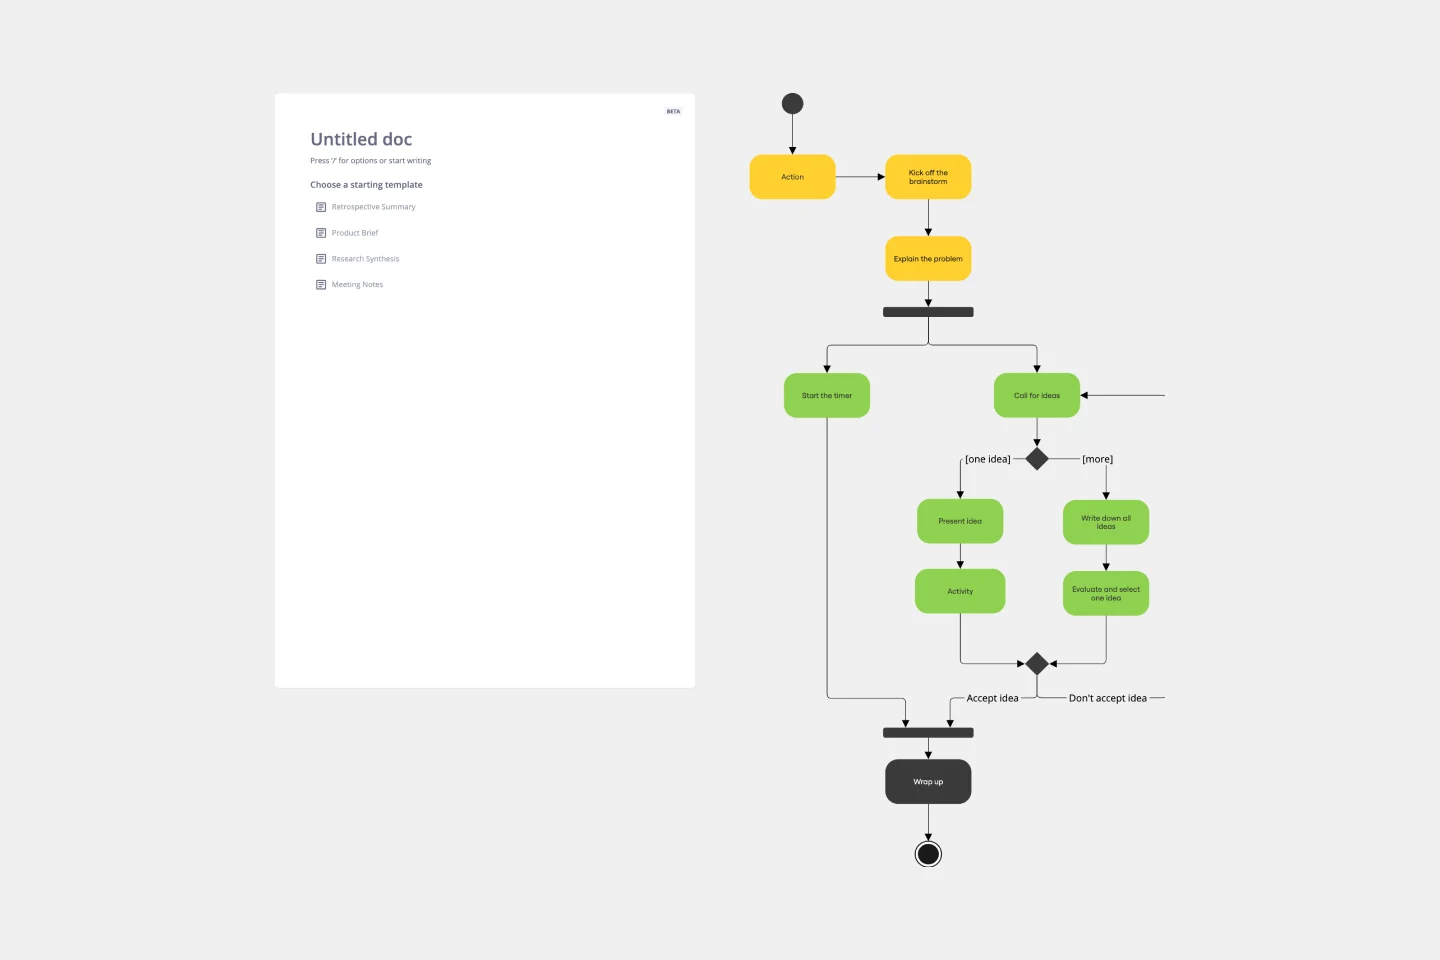
UML Activity Diagram Template
Works best for:
Diagrams
Use our Activity Diagram template to break down activities into smaller decisions and subprocesses. Improve and optimize systems and processes in I.T., business management, and more.
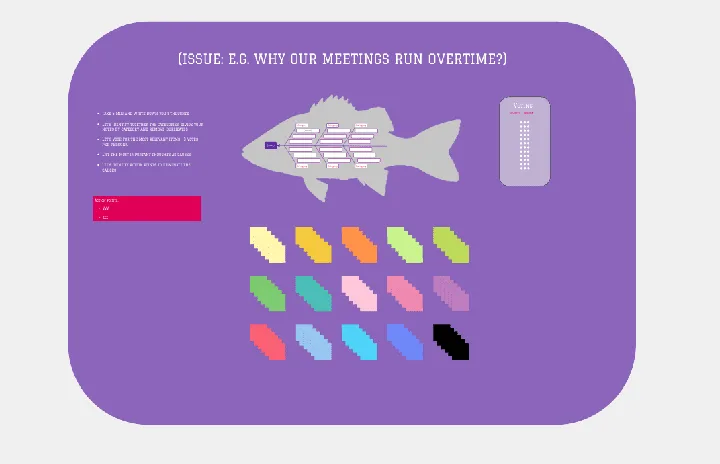
Fishbone Diagram by Hanna Havulinna
Works best for:
Diagramming
The Fishbone Diagram template, also known as the Ishikawa or Cause-and-Effect diagram, offers a visual tool for identifying and analyzing root causes of problems or issues. It provides a structured framework for categorizing potential causes into major categories such as people, process, environment, and equipment. This template enables teams to conduct root cause analysis systematically, facilitating problem-solving and decision-making. By promoting a structured approach to problem analysis, the Fishbone Diagram empowers teams to address issues effectively and implement corrective actions efficiently.
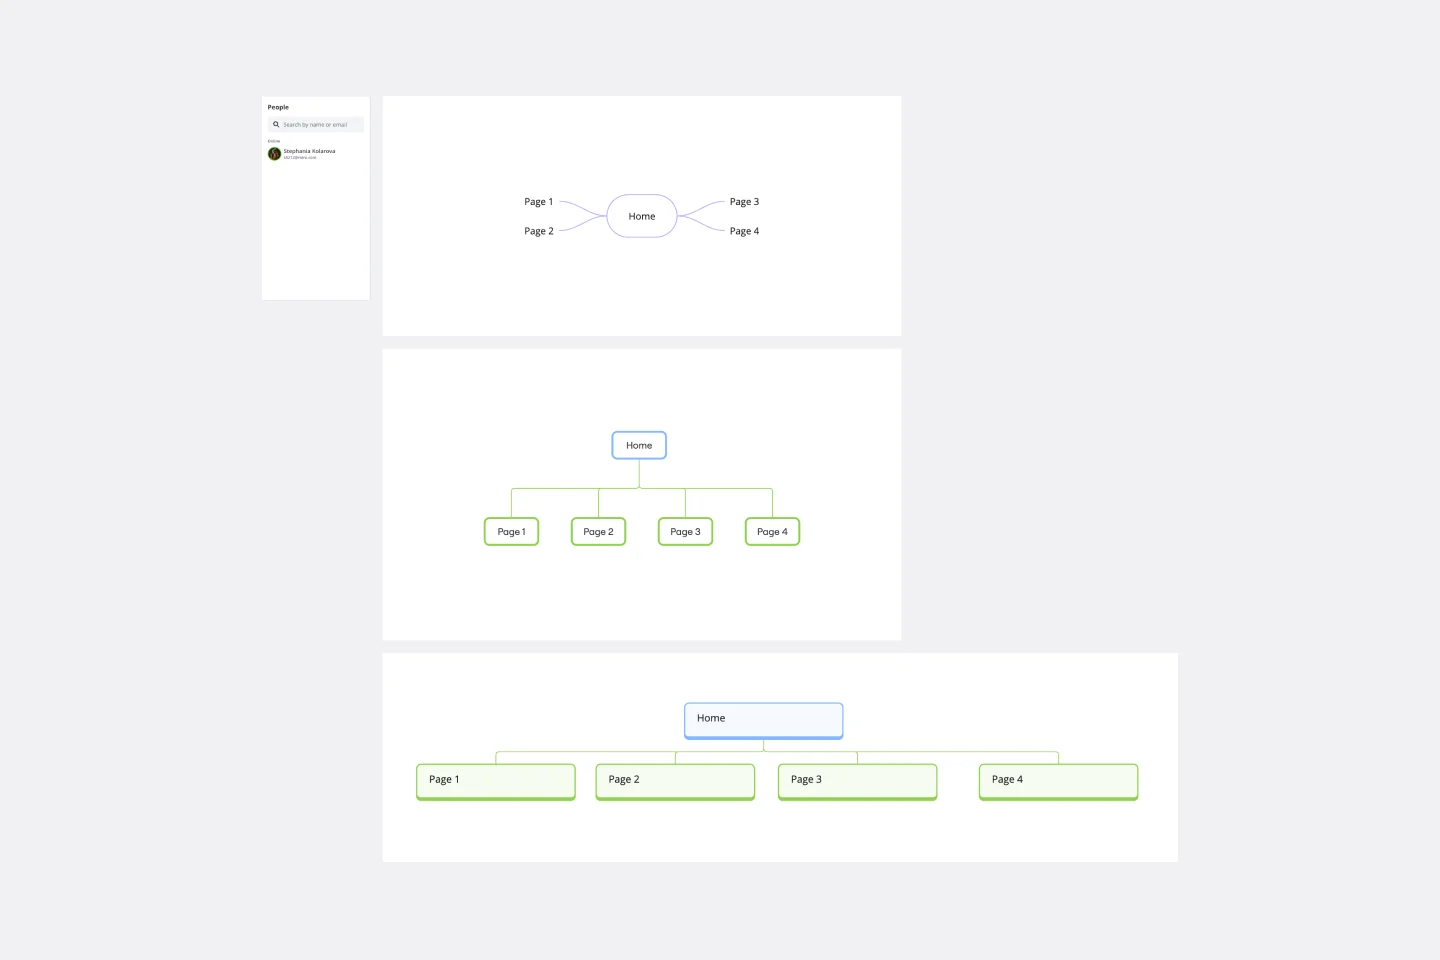
Sitemap Template
Works best for:
Mapping, Software Development, Diagrams
Building a website is a complex task. Numerous stakeholders come together to create pages, write content, design elements, and build a website architecture that serves a target audience. A sitemap is an effective tool for simplifying the website design process. It allows you to take stock of the content and design elements you plan to include on your site. By visualizing your site, you can structure and build each component in a way that makes sense for your audience.
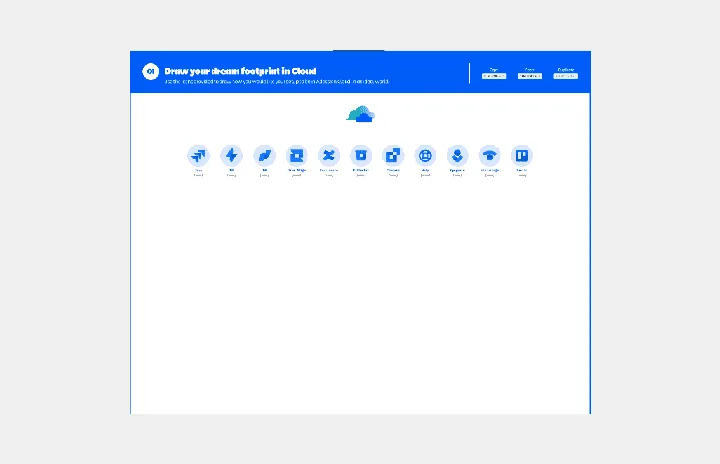
Cloud Blueprint
Works best for:
Diagramming
The Cloud Blueprint template offers a visual framework for designing and planning cloud-based architectures. It provides elements for mapping out cloud services, components, and dependencies. This template enables teams to visualize and communicate complex cloud infrastructure designs, facilitating collaboration and decision-making. By promoting clarity and alignment, the Cloud Blueprint empowers organizations to design scalable, resilient, and secure cloud solutions that meet business requirements and objectives.