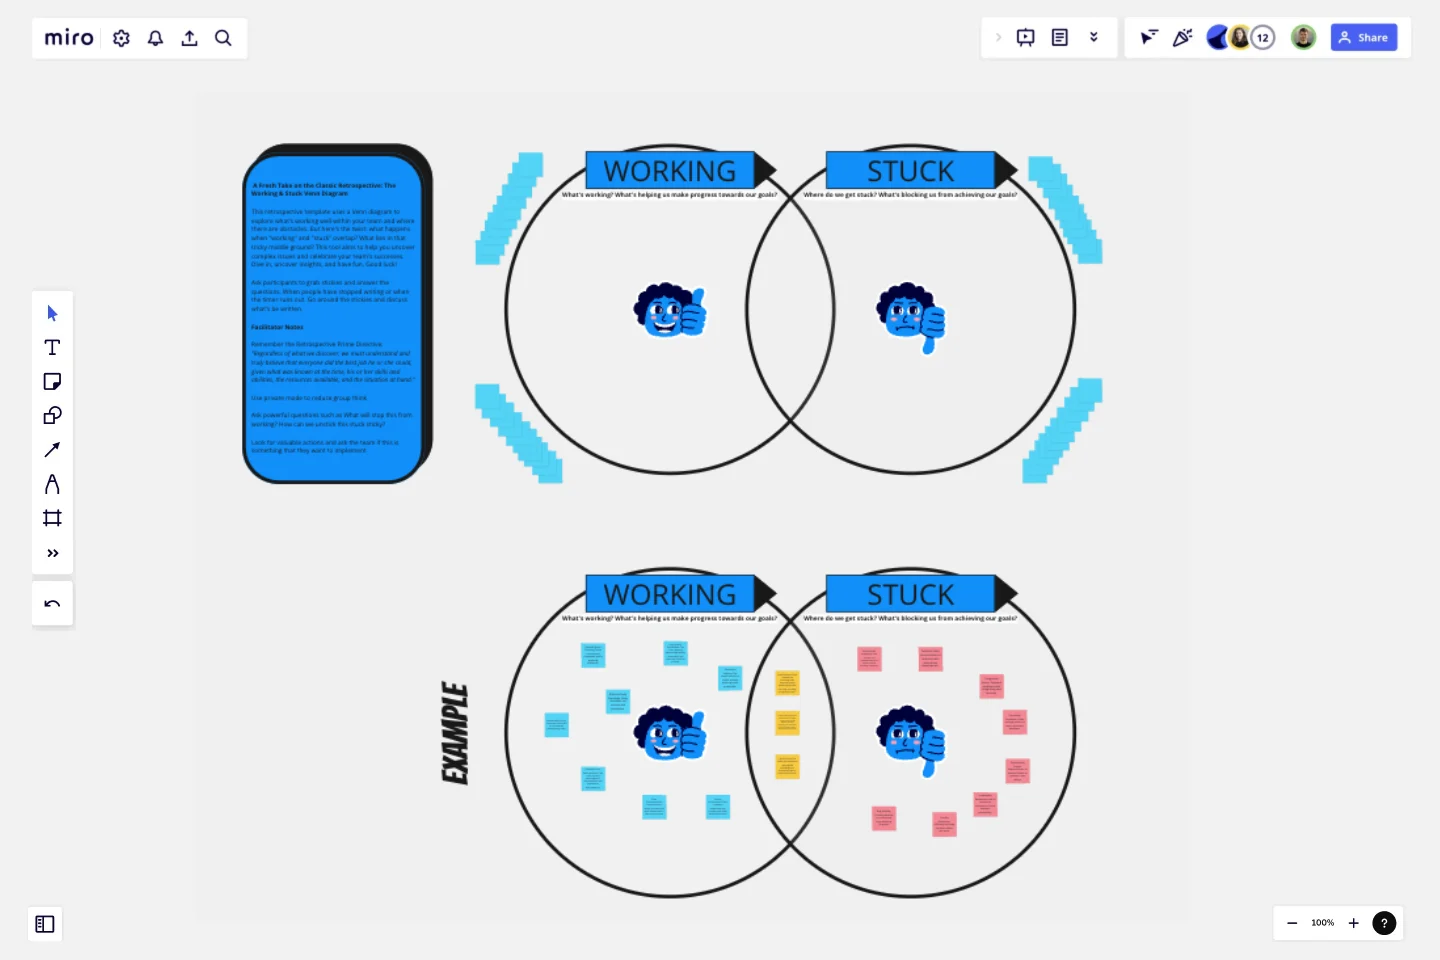
The Working & Stuck Venn Diagram
This retrospective template uses a Venn diagram to explore what's working well within your team and where there are obstacles.
But here's the twist: what happens when "working" and "stuck" overlap? What lies in that tricky middle ground? This tool aims to help you uncover complex issues and celebrate your team's successes. Dive in, uncover insights, and have fun. Good luck!
This template was created by Joe Fitzpatrick.
Get started with this template right now.
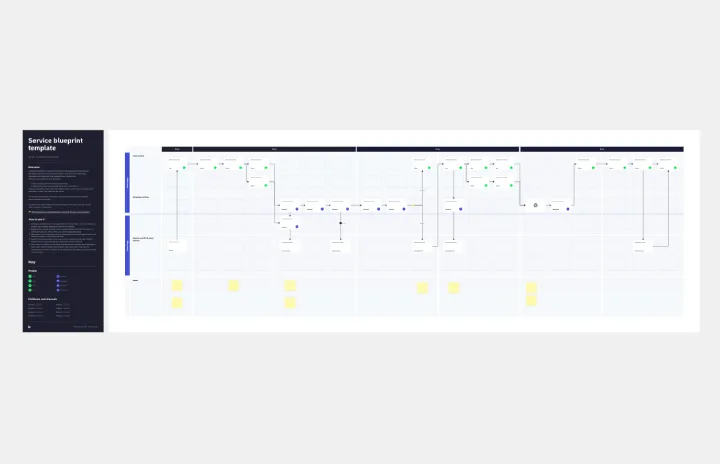
Service Blueprint by Hyperact
Works best for:
Research & Design
The Service Blueprint template is perfect for visualizing the orchestration of service components. It maps out frontstage and backstage elements, helping you analyze and enhance customer experiences. Use this template to align teams, identify pain points, and streamline processes, ensuring a seamless service delivery. It's ideal for creating a shared understanding of service dynamics among stakeholders and collaborators.

BPM
Works best for:
Diagramming
The BPM (Business Process Management) template is a visual tool for modeling, analyzing, and optimizing business processes. It provides a structured framework for documenting process flows, identifying bottlenecks, and improving efficiency. This template enables organizations to streamline operations, enhance productivity, and drive business performance. By promoting process transparency and agility, the BPM template empowers teams to achieve operational excellence and deliver value to stakeholders.
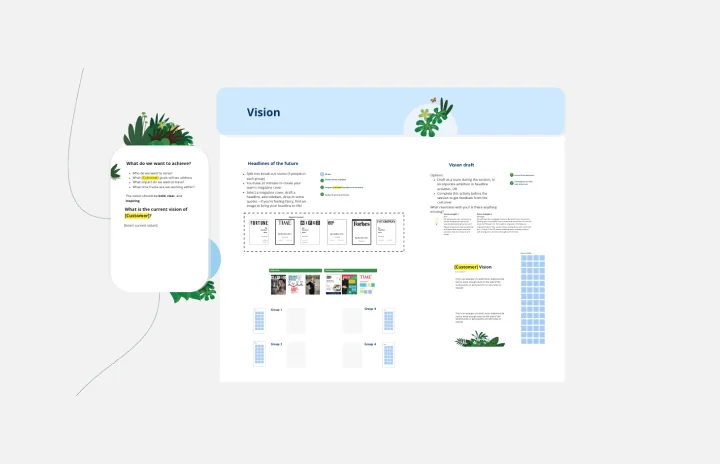
V2MOM Salesforce Template
Works best for:
Meetings, Strategic Planning
Align goals and strategies across your organization with the Salesforce V2MOM Template. Bring everyone together towards the same goals.
Venn Diagram for Research
Works best for:
Venn Diagram
The Venn Diagram for Research template is a powerful tool for analyzing relationships and intersections in research data. Use it to compare different variables, identify overlaps, and draw insights from complex datasets. This template is ideal for researchers, analysts, and academics looking to visualize their findings and communicate results effectively. It's perfect for scientific studies, market research, and any field that requires detailed data comparison.
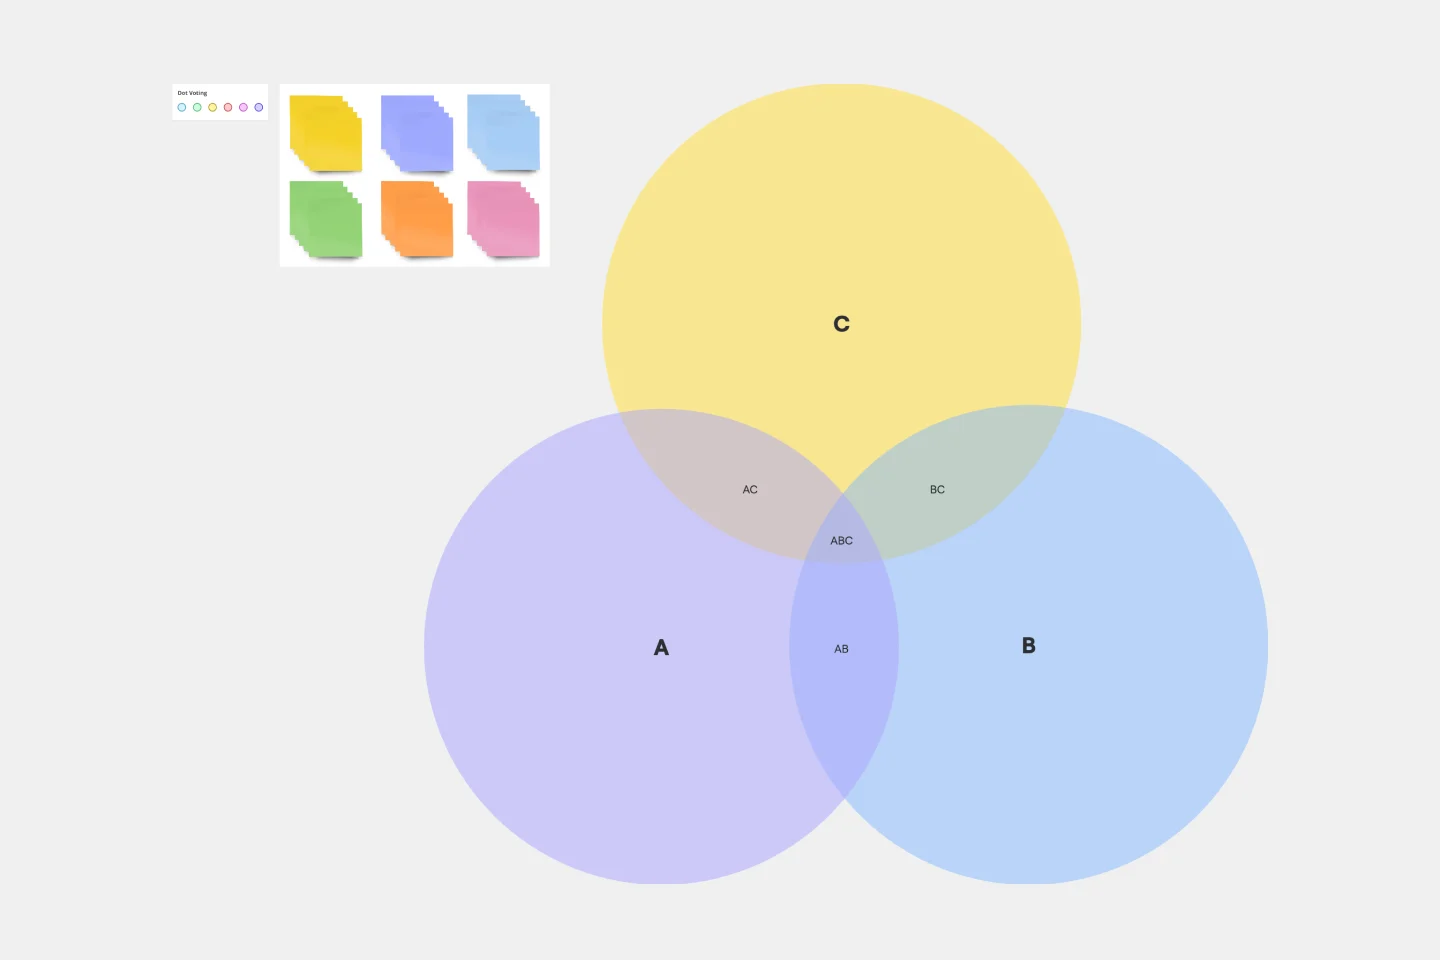
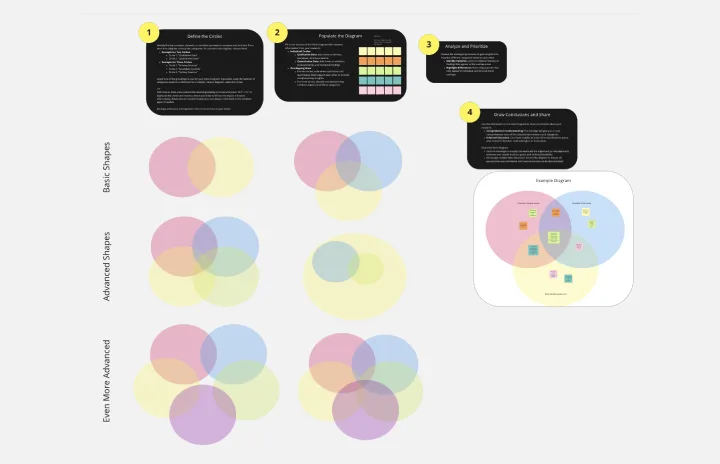
3-Circle Venn Diagram
Works best for:
Education, Diagrams, Brainstorming
Venn diagrams have been a staple of business meetings and presentations since the 1800s, and there’s a good reason why. Venn diagrams provide a clear, effective way to visually showcase relationships between datasets. They serve as a helpful visual aid in brainstorming sessions, meetings, and presentations. You start by drawing a circle containing one concept, and then draw an overlapping circle containing another concept. In the space where the circles overlap, you can make note of the concepts’ similarities. In the space where they do not, you can make note of their differences.
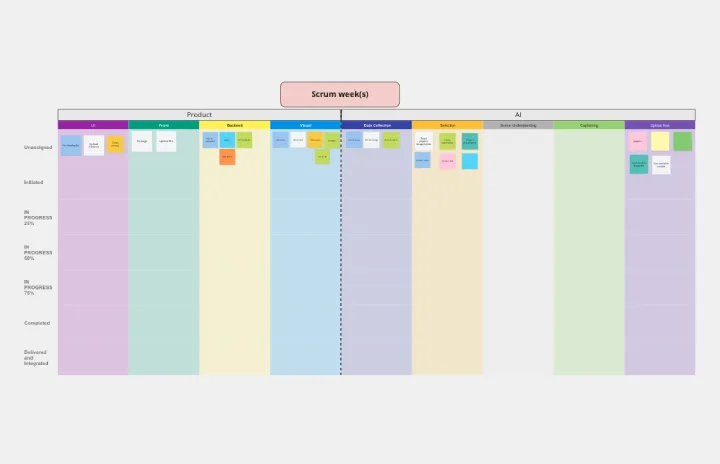
Timeline Workflow by Reza Zolf
Works best for:
Planning, Strategy
The Timeline Workflow template helps streamline your project workflows. It’s perfect for visualizing processes, identifying bottlenecks, and optimizing tasks. This template enhances team collaboration and ensures smooth project execution.