VRIO Analysis Template
Use the VRIO analysis template to evaluate your business's resources for a competitive edge.
About the VRIO Analysis Template
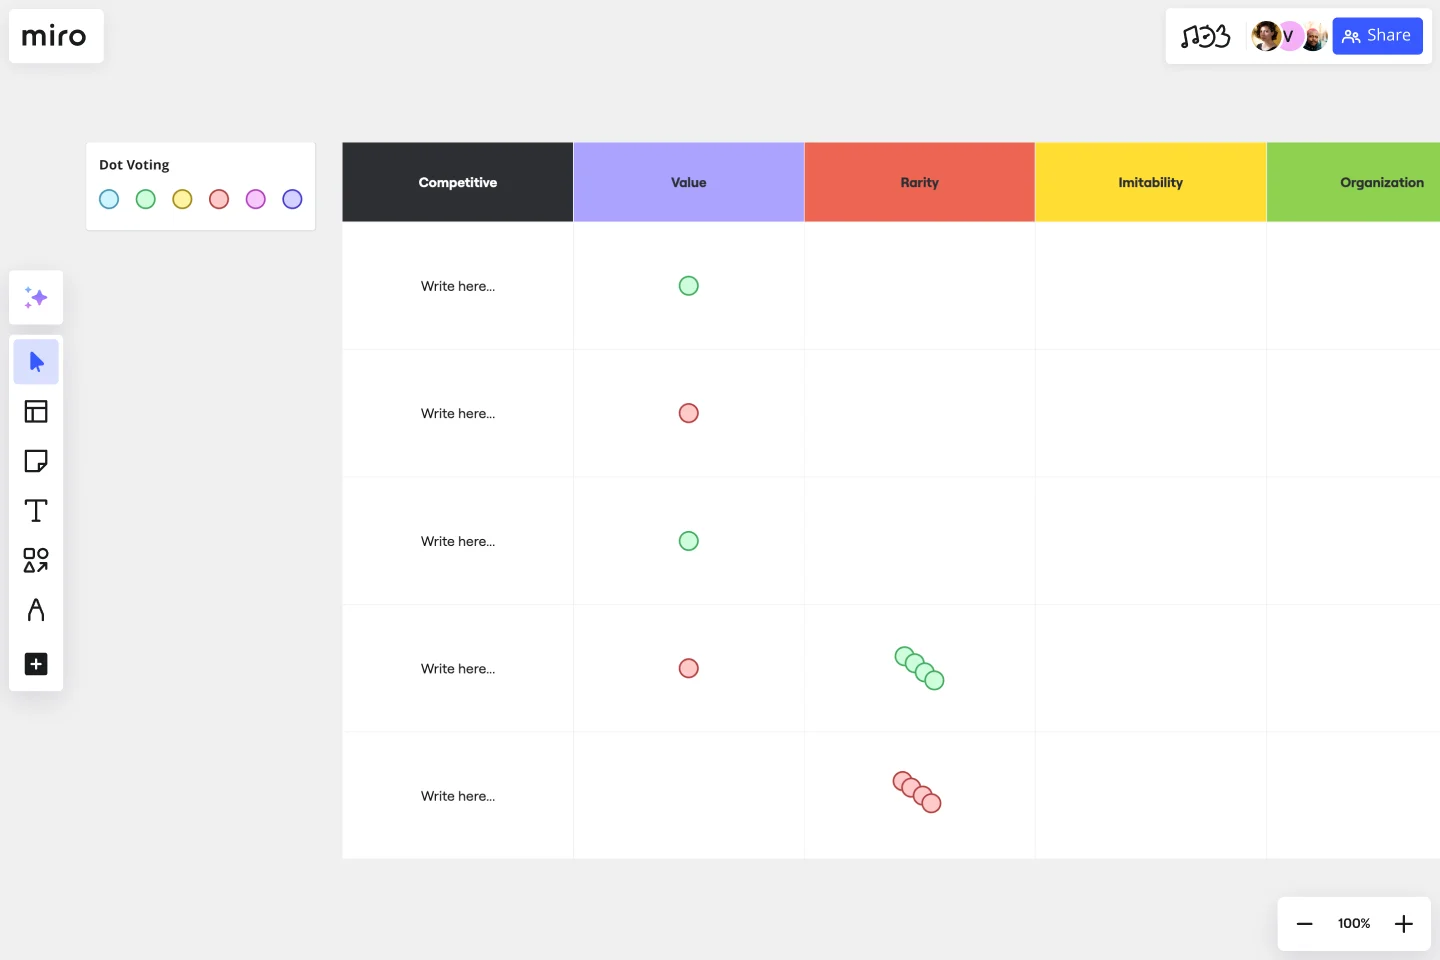
The VRIO analysis template is an intuitive tool that helps businesses and people determine their competitive potential. This analytical framework evaluates the capacity of organizational resources to provide a competitive advantage by focusing on four main components:
Value:
Meaning: Assesses if a resource or capability allows a firm to exploit an opportunity or neutralize a threat.
How to Use: List down all the firm's resources and capabilities and then determine which ones add real value regarding opportunities or threats.
Rarity:
Meaning: Measures the uniqueness or scarcity of a resource.
How to Use: Evaluate if the identified valuable resources are rare or common in the industry. If it's common, it might not provide a competitive edge.
Imitability:
Meaning: Determines how easily competitors can replicate or imitate the resource.
How to Use: Examine the resources that are both valuable and rare. For each, determine if competitors can easily imitate them. If they can't, it's a competitive advantage.
Organization:
Meaning: Evaluates if the firm is structured to capture value from its resources.
How to Use: Review the company's structure, culture, and processes to ensure that the resources that are valuable, rare, and inimitable are being utilized optimally.
By understanding and applying these areas in the template, businesses can ensure that their resources and capabilities are aligned to yield the maximum competitive advantage.
How to use the VRIO analysis template?
Edit with ease: With just a few clicks, one can easily change text, adjust components, or customize areas according to specific needs.
Expand and connect: Benefit from automated diagramming features. Add more sections, adjust sizes, or create connector lines effortlessly to expand the template's structure.
Add more context: Introduce any artifact to the board to provide additional context, be it images, documents, links, or any other relevant item.
Why should you use a VRIO analysis template?
Comprehensive analysis: It provides a structured way to evaluate resources and capabilities systematically.
Enhanced decision-making: By understanding strengths and weaknesses, businesses can make more informed strategic choices.
Quick visualization: Instead of a lengthy analysis, the chart provides a visual representation, making it easier to grasp and share.
Customization: The template can be tailored to fit the specific needs and nuances of any organization.
Consistent evaluation: Using the template ensures a uniform method of evaluating resources across various departments or periods.
Discover more competitive analysis examples that you can use now.
What's the primary purpose of the VRIO analysis template?
The primary purpose is to help businesses and people determine their potential for a competitive advantage by analyzing their resources and capabilities.
Do I need any prior knowledge of VRIO to use the template?
No, the template is intuitive and designed to guide users through the analysis process, regardless of their familiarity with VRIO.
Can I customize the VRIO Analysis Template to suit my organization's branding?
Absolutely! The template is fully customizable, allowing you to adjust colors, fonts, and layouts to match your organization's branding.
Can other analytical tools be integrated with the VRIO analysis template?
Yes, the flexible nature of the template allows integration with other tools and analytical frameworks, enhancing its depth and applicability.
Get started with this template right now.
Cause and Effect Diagram Template
Works best for:
Diagramming
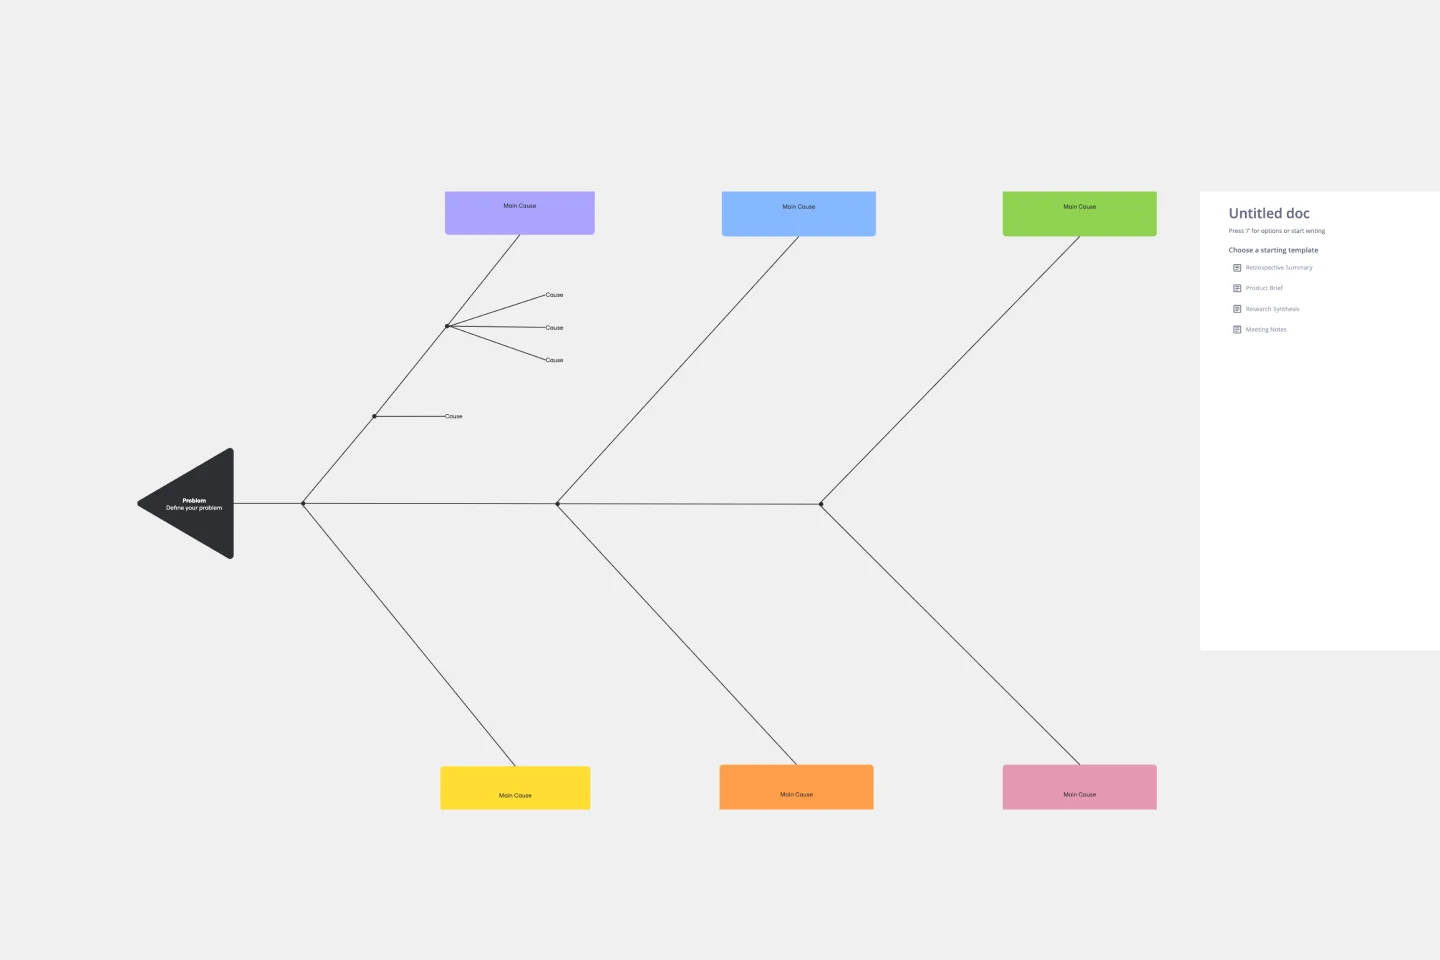
The Cause and Effect Diagram Template is a useful tool for analyzing complex relationships, identifying root causes of problems, and improving organizational processes. It can be customized to fit user's unique needs and provides a structured framework for analysis. Teams can use real-time collaborative analysis on the Miro platform to drive continuous improvement initiatives.
Pie Chart Template
Works best for:
Education, Operations
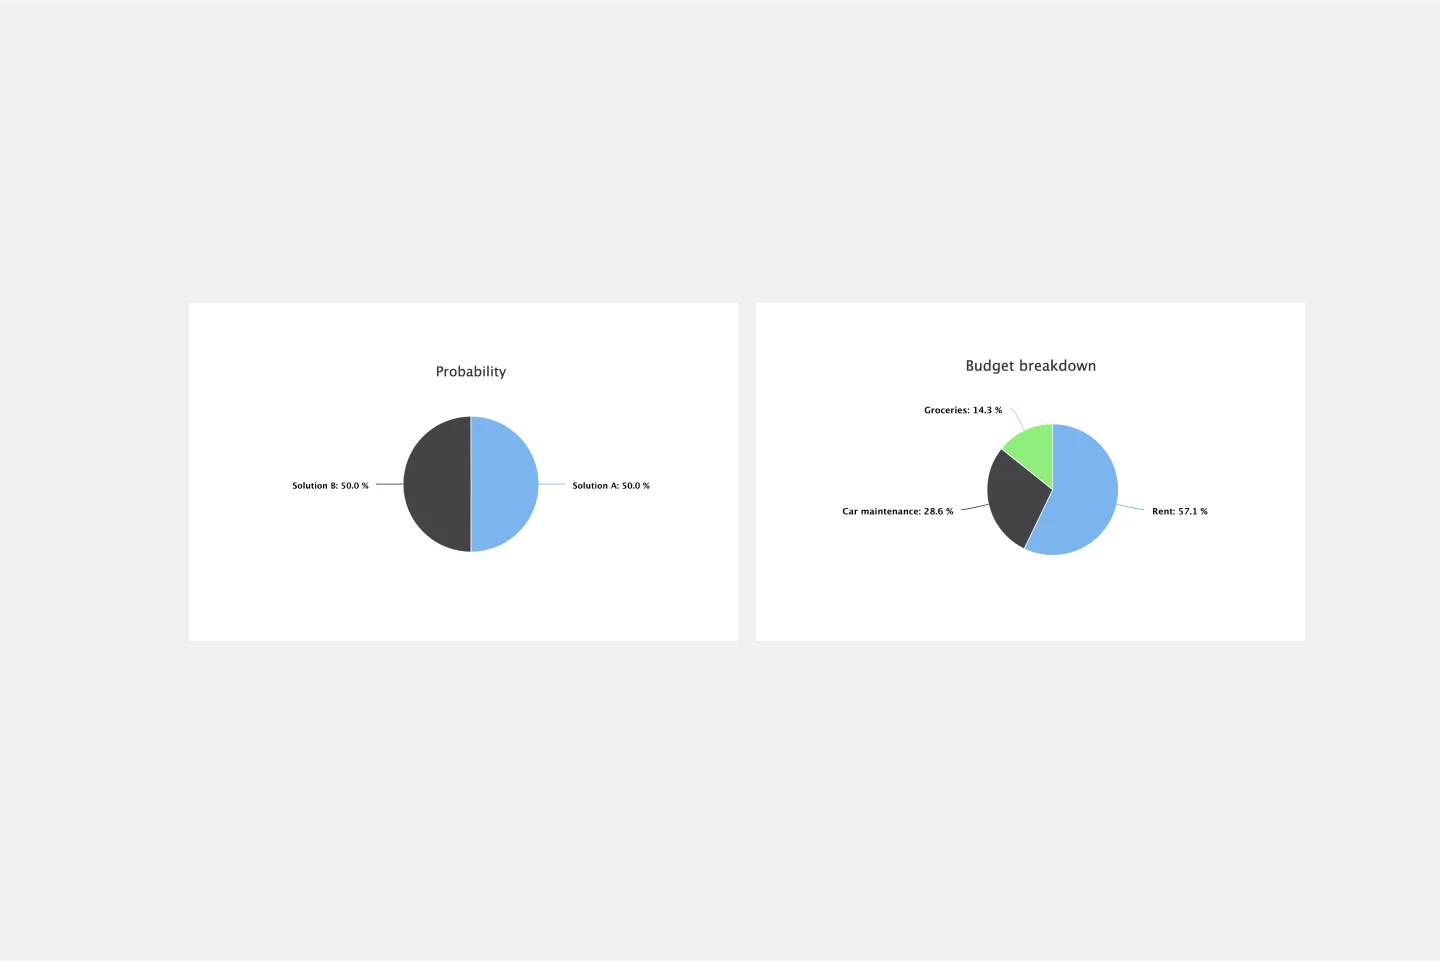
Pie charts are an excellent way to present relationships between datasets graphically, where you can quickly compare information and see contrast right away. Professionals from many fields use pie charts to support their presentations and enrich their storytelling as it’s one of the most commonly used data charts.
Google Cloud Architecture Diagram Template
Works best for:
Software Development, Diagrams
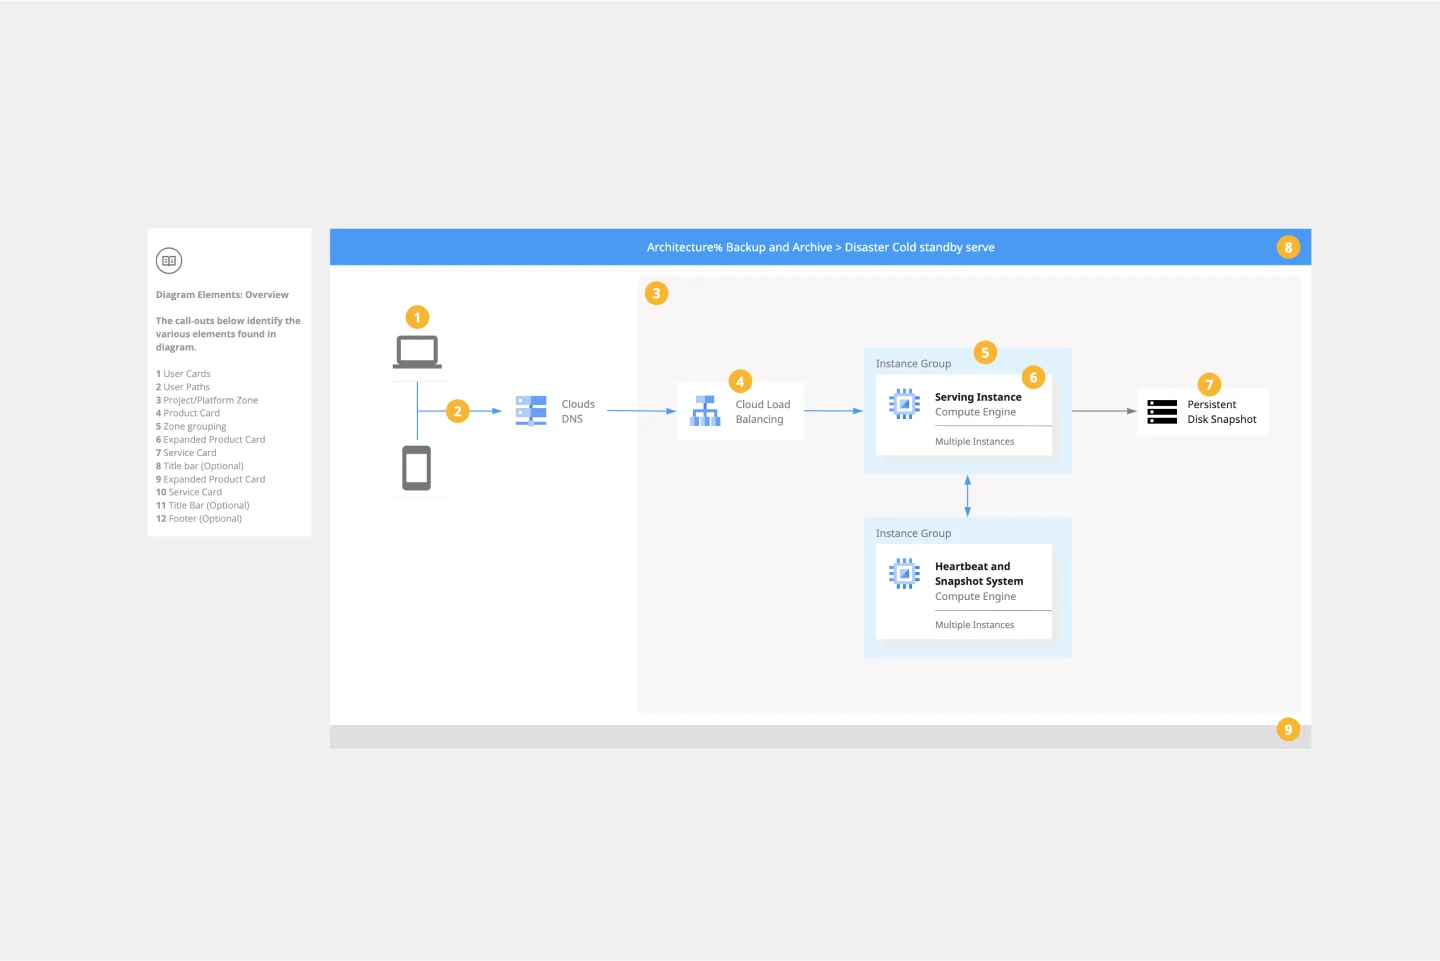
Use the Google Cloud Architecture Diagram template to clearly visualize the deployment of your application and allow you and your team to optimize processes. The GCP template gives you a great overview of your application architecture, and it helps you to iterate quickly and better manage your application development, deployment, and documentation. Try it out and see if it works for you.
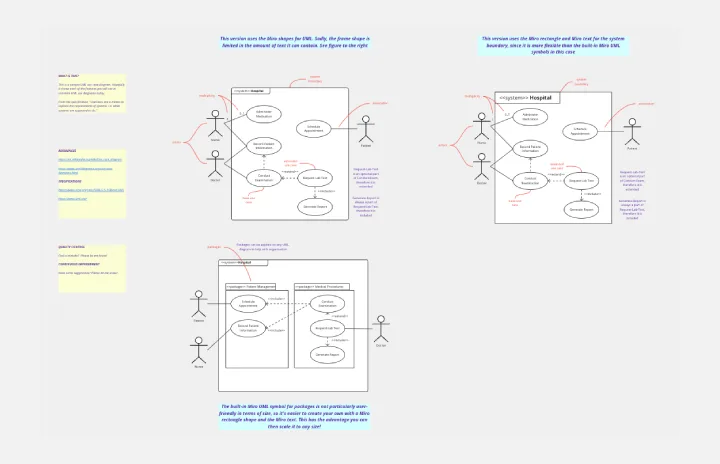
UML Use Case Diagram
Works best for:
UML Diagrams, Diagramming
Visualize system interactions with the UML Use Case Diagram. This template helps you map out user interactions and system processes, providing a clear overview of functional requirements. Ideal for software developers, business analysts, and project managers, it supports planning and communicating system functionalities. Use it to ensure all user scenarios are considered and to facilitate better design and implementation of software systems.
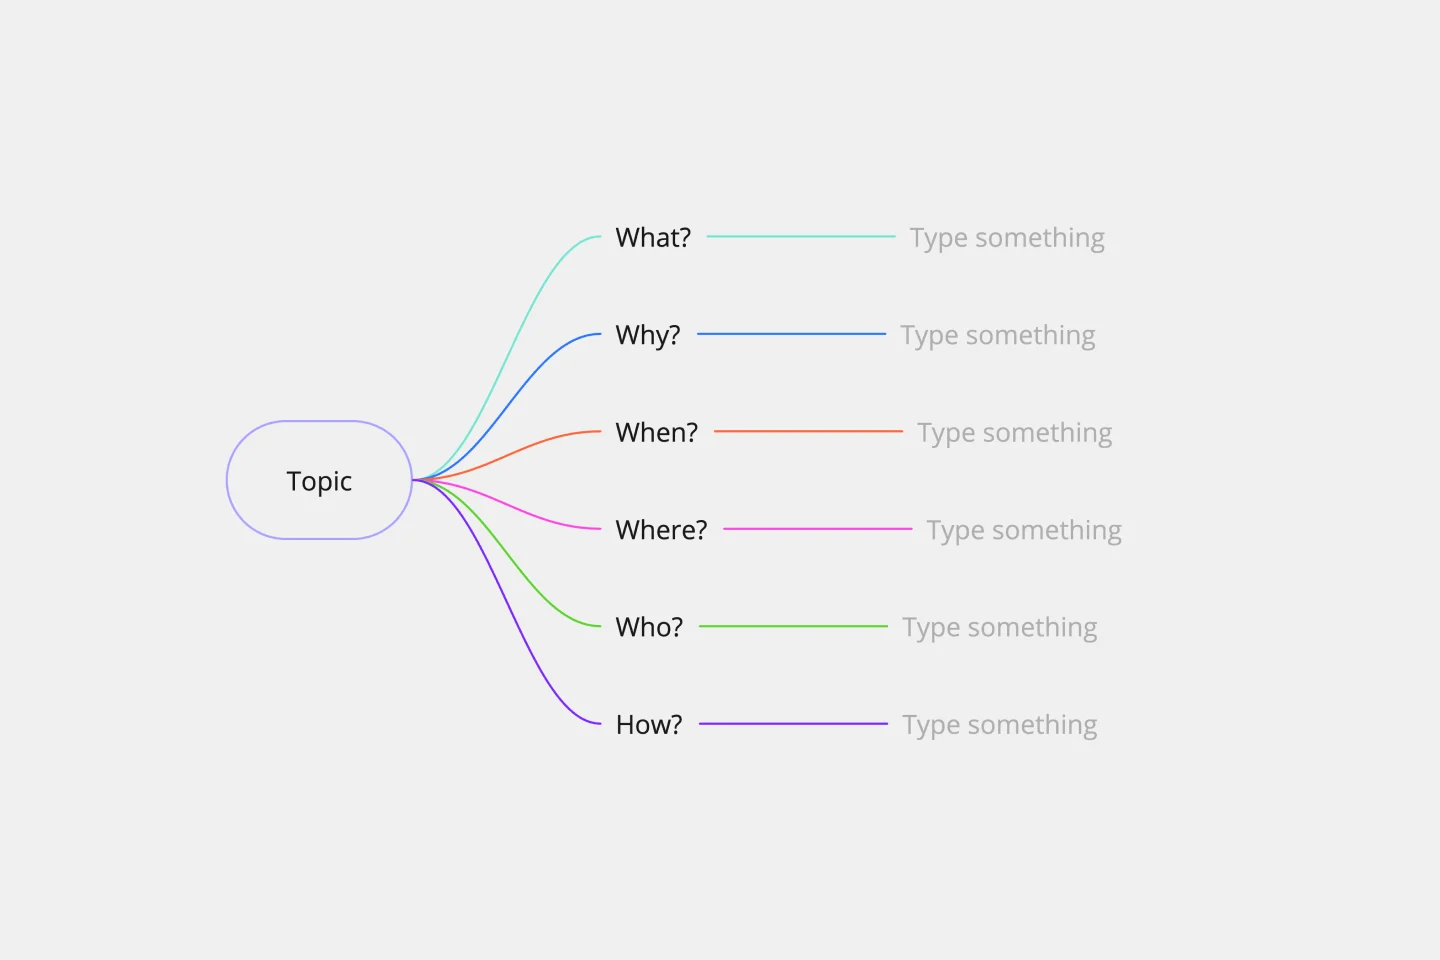
5W1H Template
Works best for:
Strategy & Planning
The 5W1H Template is a strategic framework that clarifies complex situations or projects into six foundational questions: What, Who, Where, When, How, and Why. This methodological approach ensures a comprehensive understanding, encouraging teams to dissect and explore every aspect of a given challenge or project.
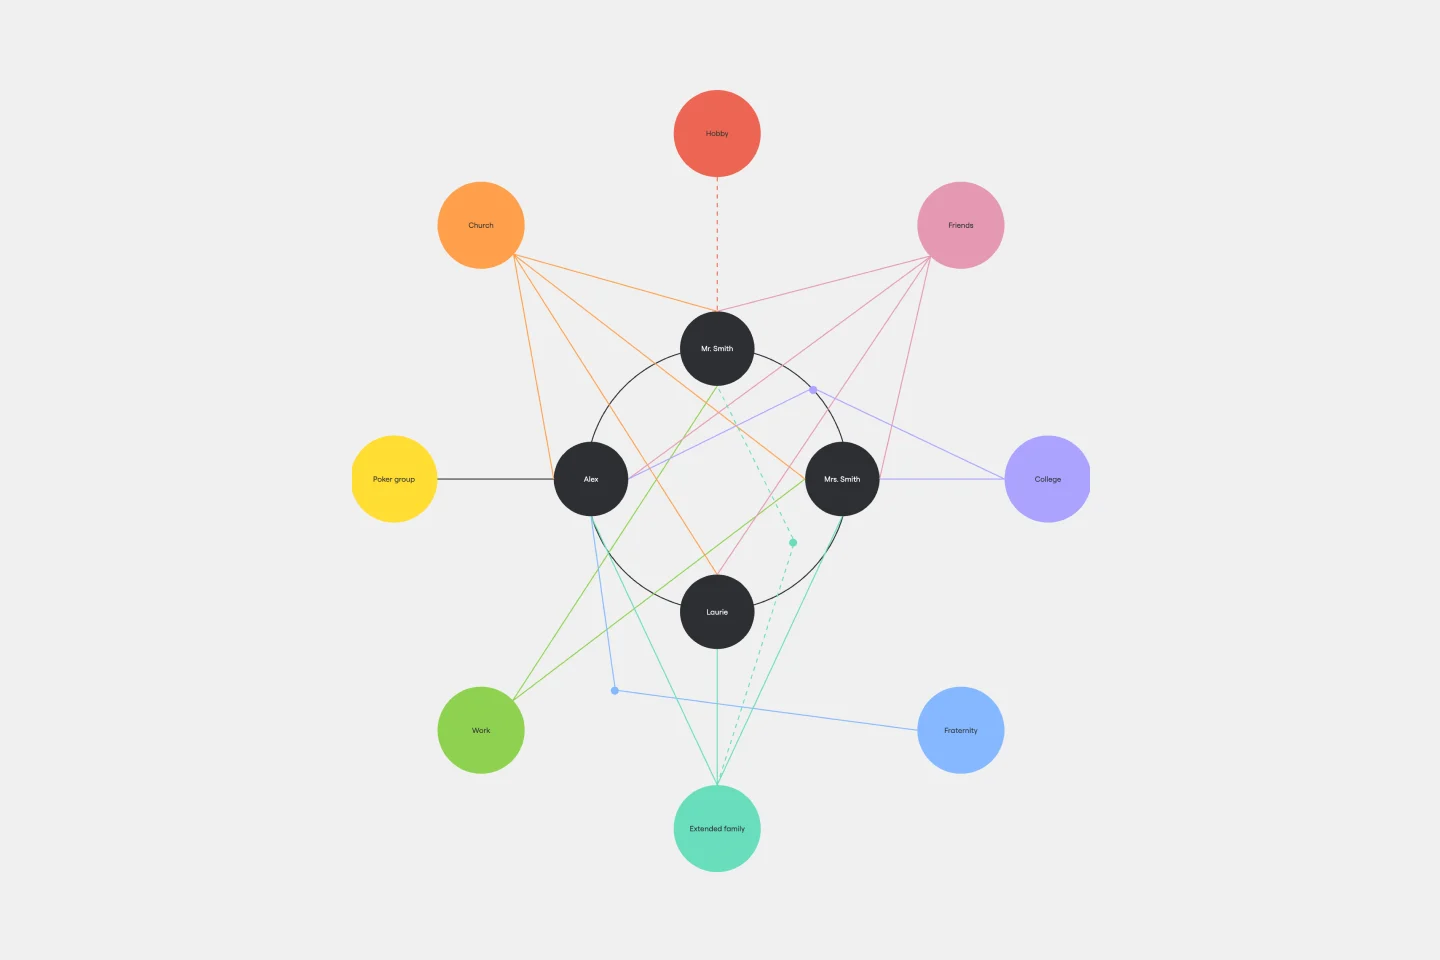
Ecomap Template
Works best for:
Strategy & Planning, Diagramming
The Ecomap Template illustrates the multifaceted relationships and environmental interactions encircling an individual or entity. Determine crucial patterns and dynamics by providing a clear and comprehensive visualization of how different systems intertwine and influence each other.