Venn Diagram for Marketing Analysis
A Venn diagram is a graphical representation that shows similarities and differences between items, concepts or data.
They utilize shapes, often circles, to illustrate relationships and compare data. Venn diagrams are certainly one of the most well-known types of diagrams. This design, featuring a series of simple circles or ellipses or rectangles that overlap is ubiquitous. The overlapping region of a Venn diagram indicates similarities while others showcase differences. Although the Venn diagram was created to describe mathematically logical relationships, it’s now used to show all types of relationships.
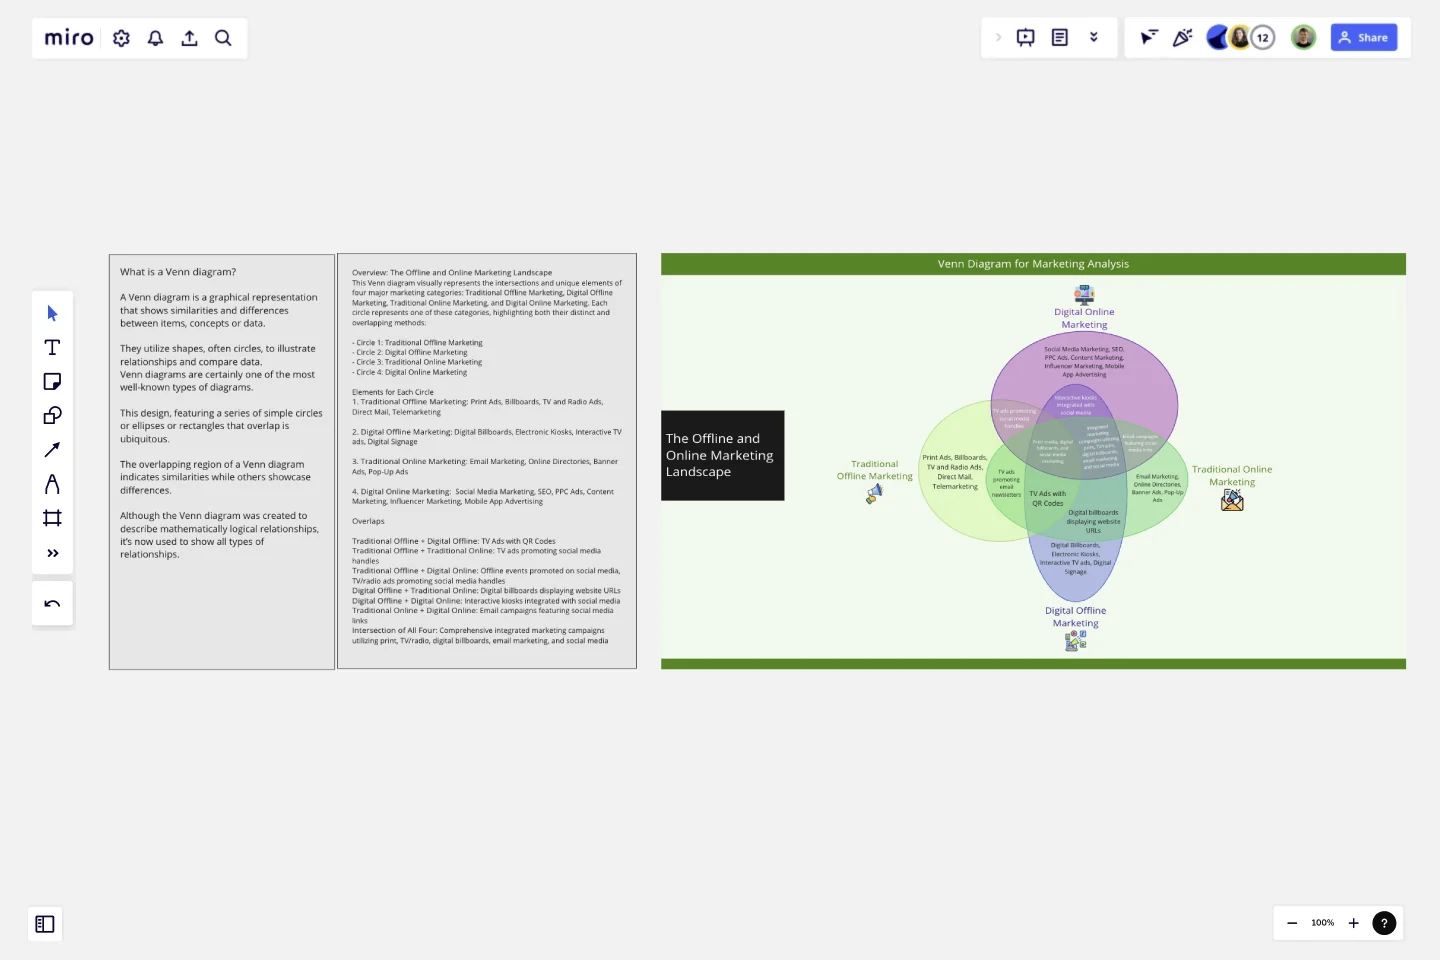
Overview: The Offline and Online Marketing Landscape
This Venn diagram visually represents the intersections and unique elements of four major marketing categories: Traditional Offline Marketing, Digital Offline Marketing, Traditional Online Marketing, and Digital Online Marketing. Each circle represents one of these categories, highlighting both their distinct and overlapping methods:
- Circle 1: Traditional Offline Marketing
- Circle 2: Digital Offline Marketing
- Circle 3: Traditional Online Marketing
- Circle 4: Digital Online MarketingElements for Each Circle
1. Traditional Offline Marketing: Print Ads, Billboards, TV and Radio Ads, Direct Mail, Telemarketing
2. Digital Offline Marketing: Digital Billboards, Electronic Kiosks, Interactive TV ads, Digital Signage
3. Traditional Online Marketing: Email Marketing, Online Directories, Banner Ads, Pop-Up Ads
4. Digital Online Marketing: Social Media Marketing, SEO, PPC Ads, Content Marketing, Influencer Marketing, Mobile App Advertising
Overlaps
Traditional Offline + Digital Offline: TV Ads with QR Codes
Traditional Offline + Traditional Online: TV ads promoting social media handles
Traditional Offline + Digital Online: Offline events promoted on social media, TV/radio ads promoting social media handles
Digital Offline + Traditional Online: Digital billboards displaying website URLs
Digital Offline + Digital Online: Interactive kiosks integrated with social media
Traditional Online + Digital Online: Email campaigns featuring social media links
Intersection of All Four: Comprehensive integrated marketing campaigns utilizing print, TV/radio, digital billboards, email marketing, and social media.
Above elaborated marketing analysis venn-diagram will help you understand its application to your problem statement.
This template was created by Khawaja Rizwan.
Get started with this template right now.
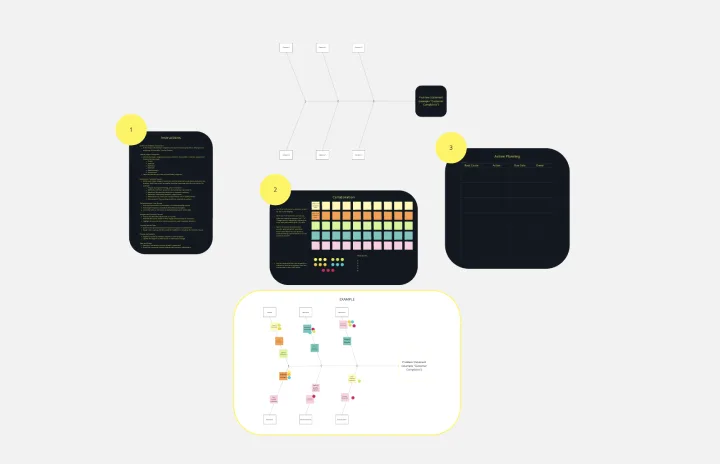
Fishbone Diagram for Manufacturing
Works best for:
Fishbone diagram
In manufacturing, pinpointing the root causes of defects and inefficiencies is crucial. The Fishbone Diagram for Manufacturing template helps you systematically investigate issues related to production. Categorize potential causes into areas such as machinery, methods, materials, and manpower. This structured approach enables your team to collaboratively identify and address underlying problems, improving processes and enhancing manufacturing quality.
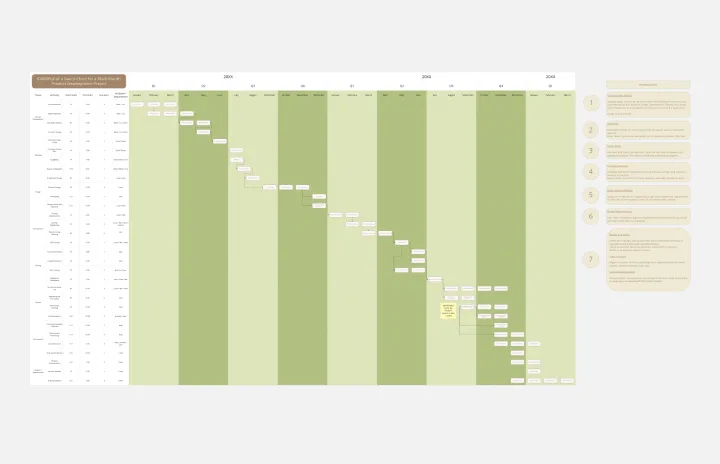
Product Development Gantt Chart
Works best for:
Gantt Chart, Planning
Developing a new product involves many steps and stakeholders. The Product Development Gantt Chart template helps you manage this complex process efficiently. Use it to outline each phase of development, set timelines, and assign responsibilities. Track progress and make adjustments as needed to stay on schedule. This template provides a clear visual representation, coordinating tasks for a successful product launch.
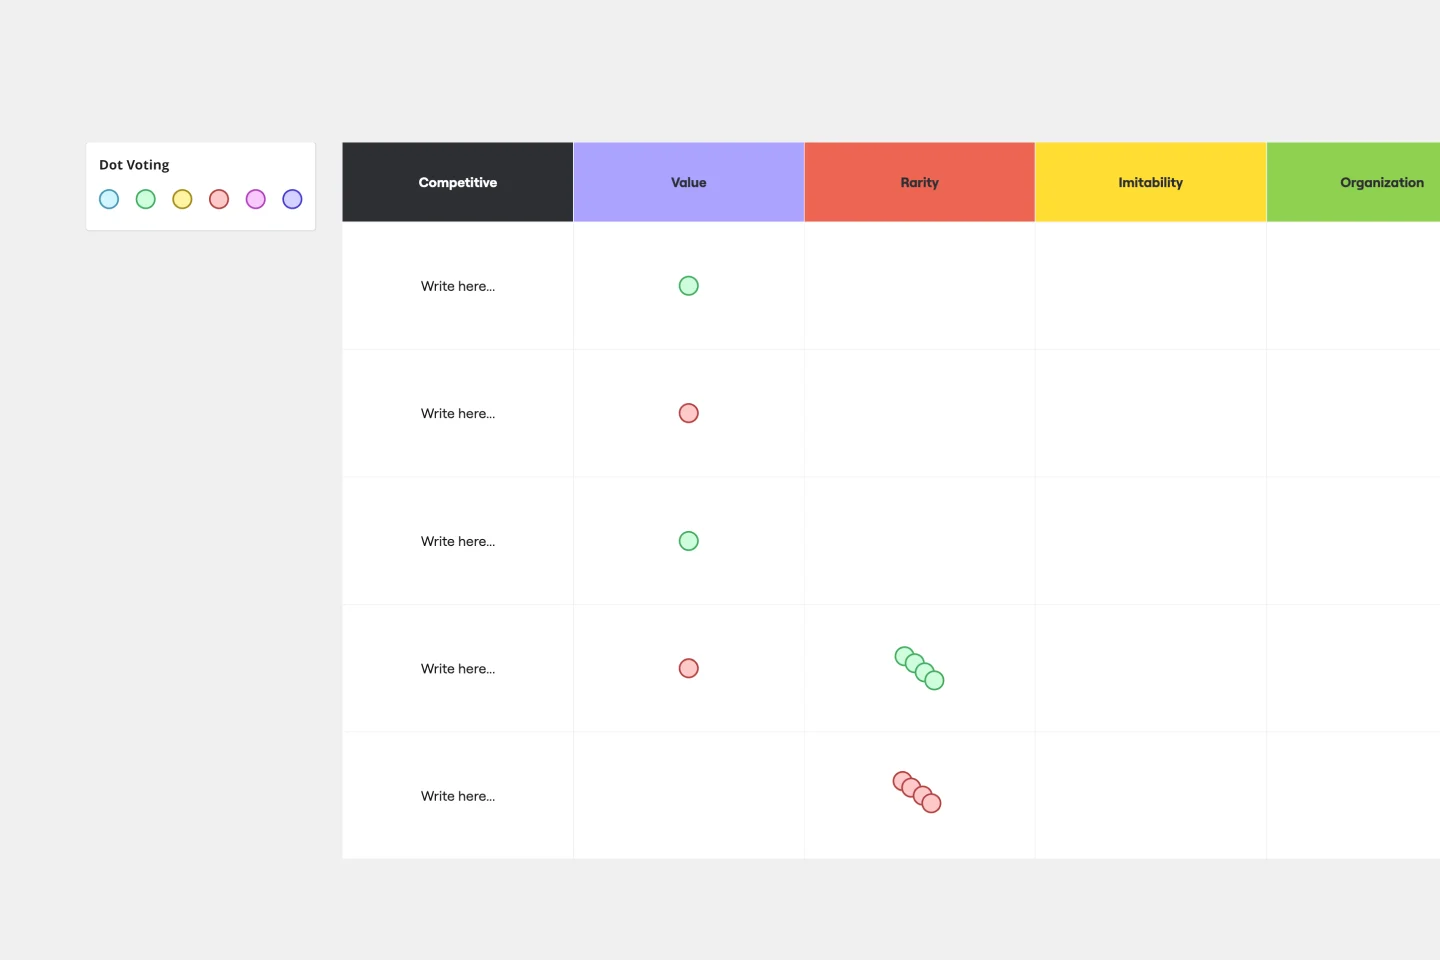
VRIO Analysis Template
Works best for:
Diagramming, Strategy
The VRIO Analysis Template is a framework that helps businesses evaluate their resources and capabilities for competitive advantage. It categorizes resources into four areas: Value, Rarity, Imitability, and Organization. This provides a comprehensive view of an organization's strengths and potential weaknesses. The template has the key benefit of offering quick visual insights. Decision-makers can immediately identify and focus on resources that are valuable, rare, hard to imitate, and well-organized. This ensures a sustainable competitive edge and saves time by avoiding lengthy textual analyses.
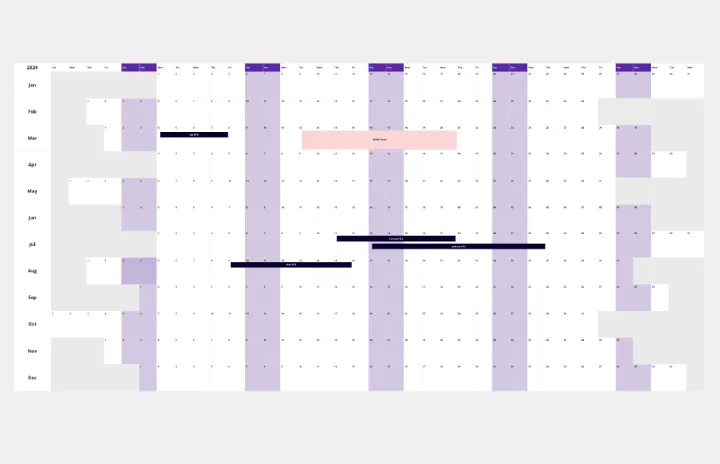
Calendar 2024 - a Year timeline
Works best for:
Strategy, Planning
The Calendar 2024 a year Timeline template is perfect for planning and organizing your year. It helps you schedule important dates, track annual goals, and stay on top of deadlines. This template ensures you have a clear overview of your year ahead.
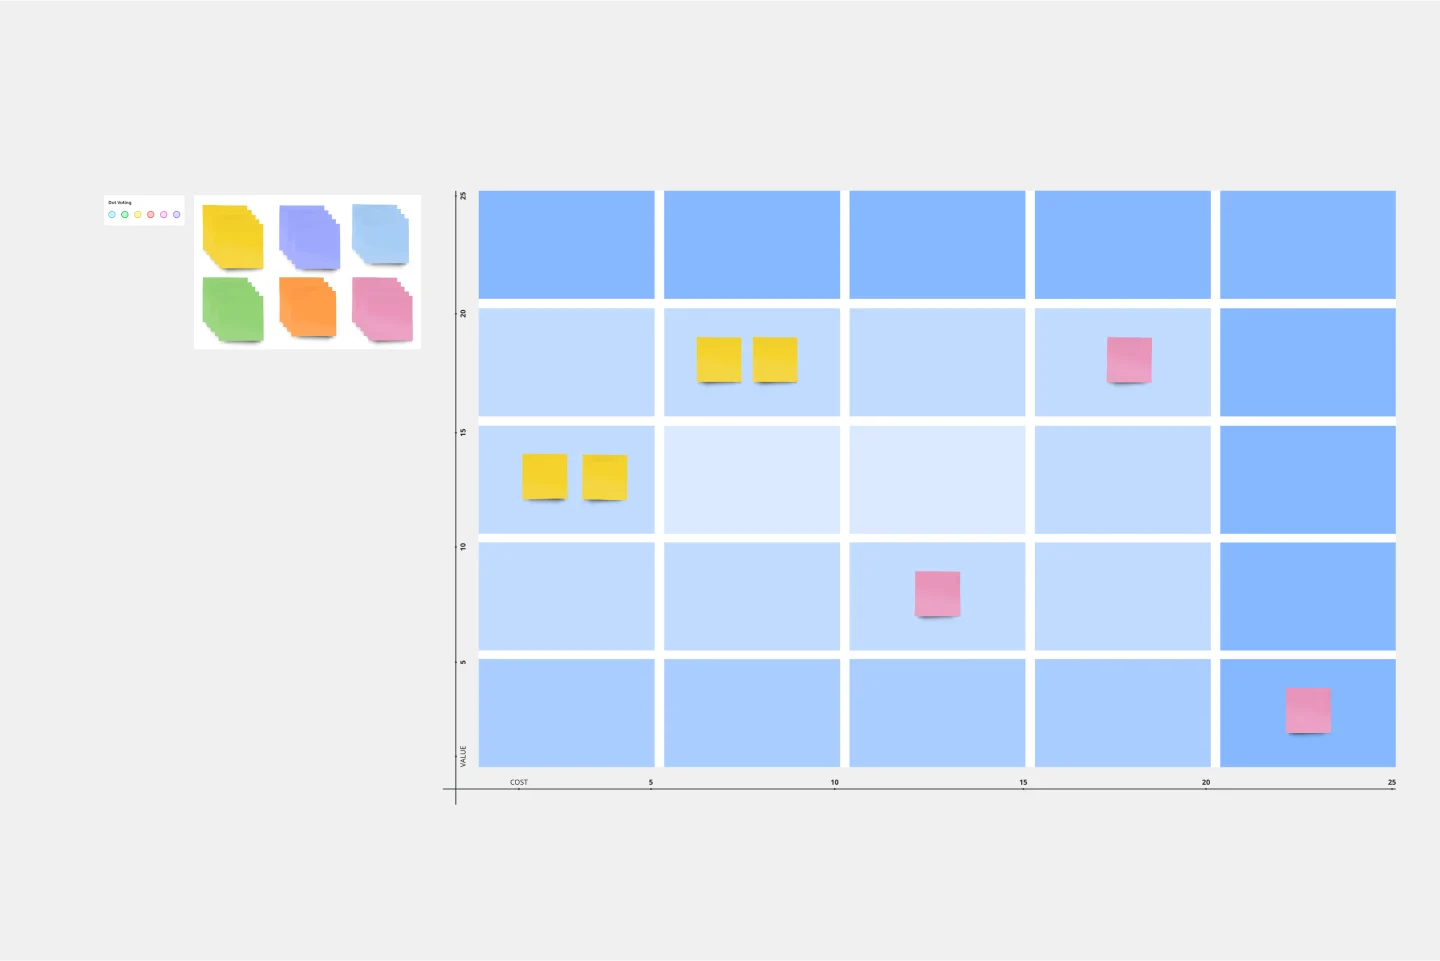
Bang for the Buck Template
Works best for:
Project Management, Strategic Planning, Prioritization
The name pretty much says it—this Agile framework is all about helping you maximize efficiency by powering collaboration between product managers and dev teams. Together you can go over each to-do on the project agenda and evaluate them in terms of costs and benefits. That way you can prioritize tasks based on how much bang for your buck they deliver. This template is great for teams and organizations that want to make a strategic plan to tackle an upcoming sprint.
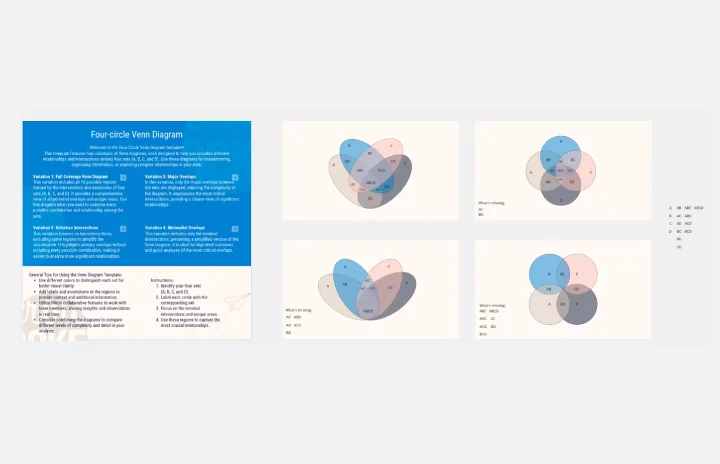
Four-Circle Venn Diagram by Irfan Rosli
Works best for:
Venn Diagrams
The Four Circle Venn Diagram template offers a robust tool for detailed data comparison involving four sets. Use it to identify common and unique attributes across multiple categories. This template is perfect for complex analysis in research, strategic planning, and education. It helps visualize relationships clearly, making it easier to draw insights and communicate findings. Ideal for professionals and educators needing advanced comparative tools.