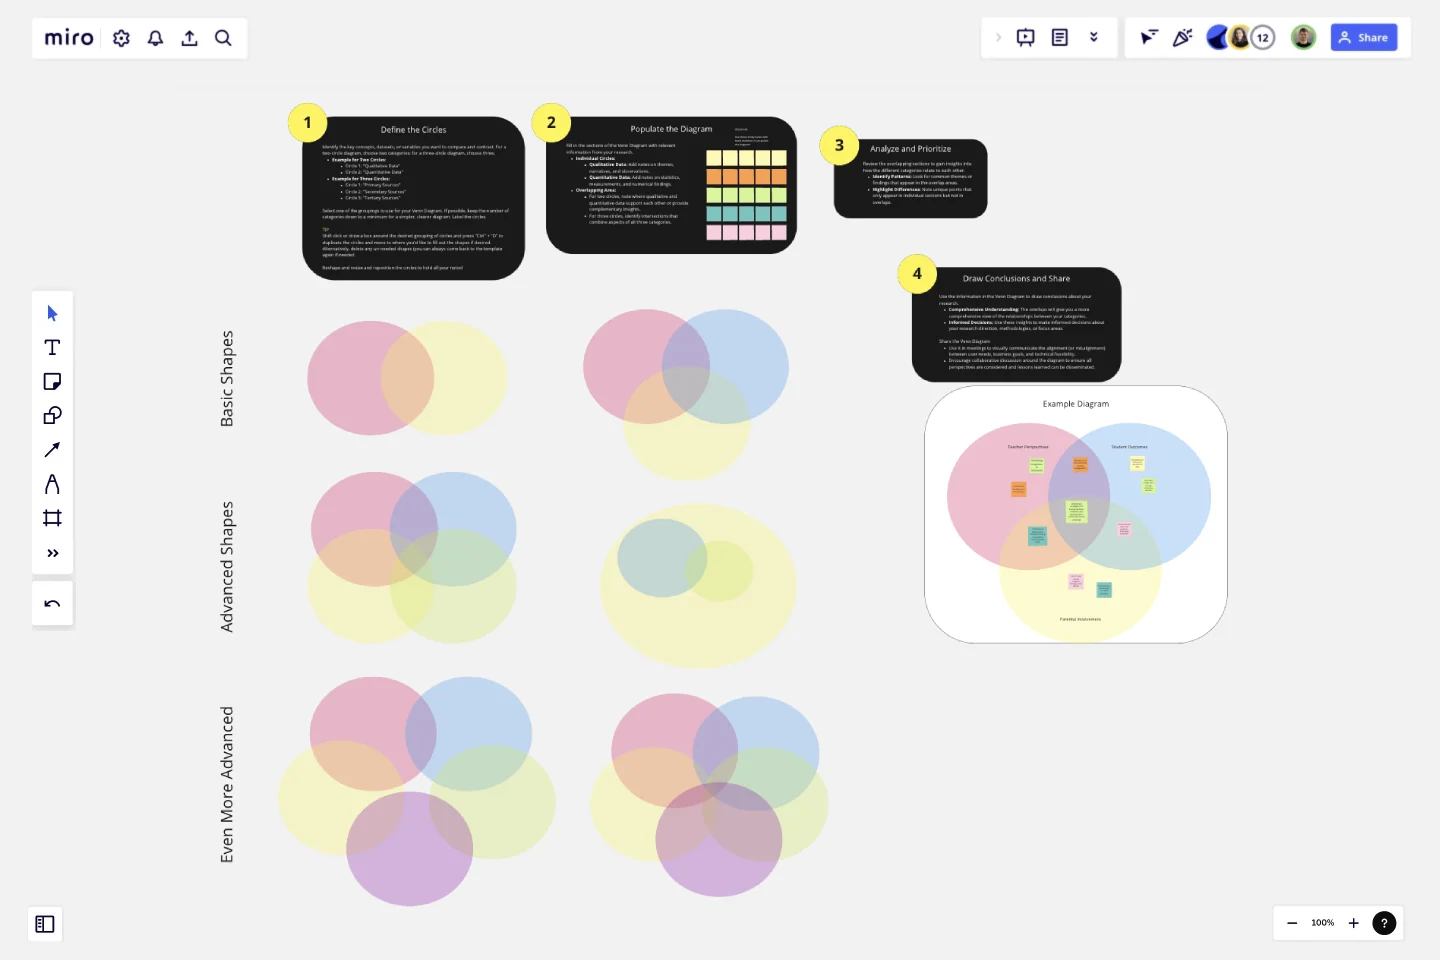
Venn Diagram for Research
The Venn Diagram for Research template is an essential tool designed to help researchers visually organize, compare, and contrast different datasets, concepts, or variables.
By clearly displaying the relationships and overlaps between categories, this template aids in uncovering insights and drawing meaningful conclusions.
Why Use This Template?
Organize Complex Data:
Visual Clarity: The template simplifies the organization of complex data, making it easier to understand and analyze.
Structured Comparison: Helps in systematically comparing and contrasting different research elements.
Enhance Analytical Insights:
Identify Patterns: Easily spot patterns, trends, and relationships between different datasets or variables.
Highlight Gaps: Quickly identify gaps or areas needing further investigation.
Facilitate Collaboration:
Team Alignment: Use the template in collaborative research settings to ensure all team members have a clear understanding of the relationships between different research elements.
Interactive Discussions: Ideal for group discussions, brainstorming sessions, and collaborative analysis.
Support Decision-Making:
Informed Conclusions: Helps in making informed decisions by clearly showing the intersection of different research categories.
Strategic Planning: Assists in planning research focus areas, methodologies, and further investigations.
Ease of Use:
Pre-Defined Sections: Comes with pre-defined sections for various categories and their overlaps, making it quick and easy to start using.
Editable Placeholders: Includes editable placeholders for notes, allowing for customization based on specific research needs.
Versatile Application:
Adaptable: Suitable for various types of research, including qualitative, quantitative, and mixed-methods studies.
Reusable: Can be reused across different research projects, making it a valuable tool for ongoing research activities.
Use Cases:
Comparative Studies: Compare different datasets, such as qualitative and quantitative data, or different sources of information.
Thematic Analysis: Identify common themes and unique insights across various research categories.
Data Integration: Integrate findings from different studies or sources to draw comprehensive conclusions.
Research Planning: Plan and prioritize research activities based on identified overlaps and gaps.
Template Features:
Instructions Section:
Step-by-Step Guide: Simple instructions on how to fill out and use the Venn Diagram effectively.
Example Notes:
Pre-Populated Examples: Examples of notes for each section to help users understand how to populate the diagram.
By choosing the Venn Diagram for Research template, researchers can effectively organize and analyze their data, leading to deeper insights and more robust conclusions. This template is ideal for anyone looking to streamline their research process and enhance collaborative efforts.
This template was created by Anthony.
Get started with this template right now.
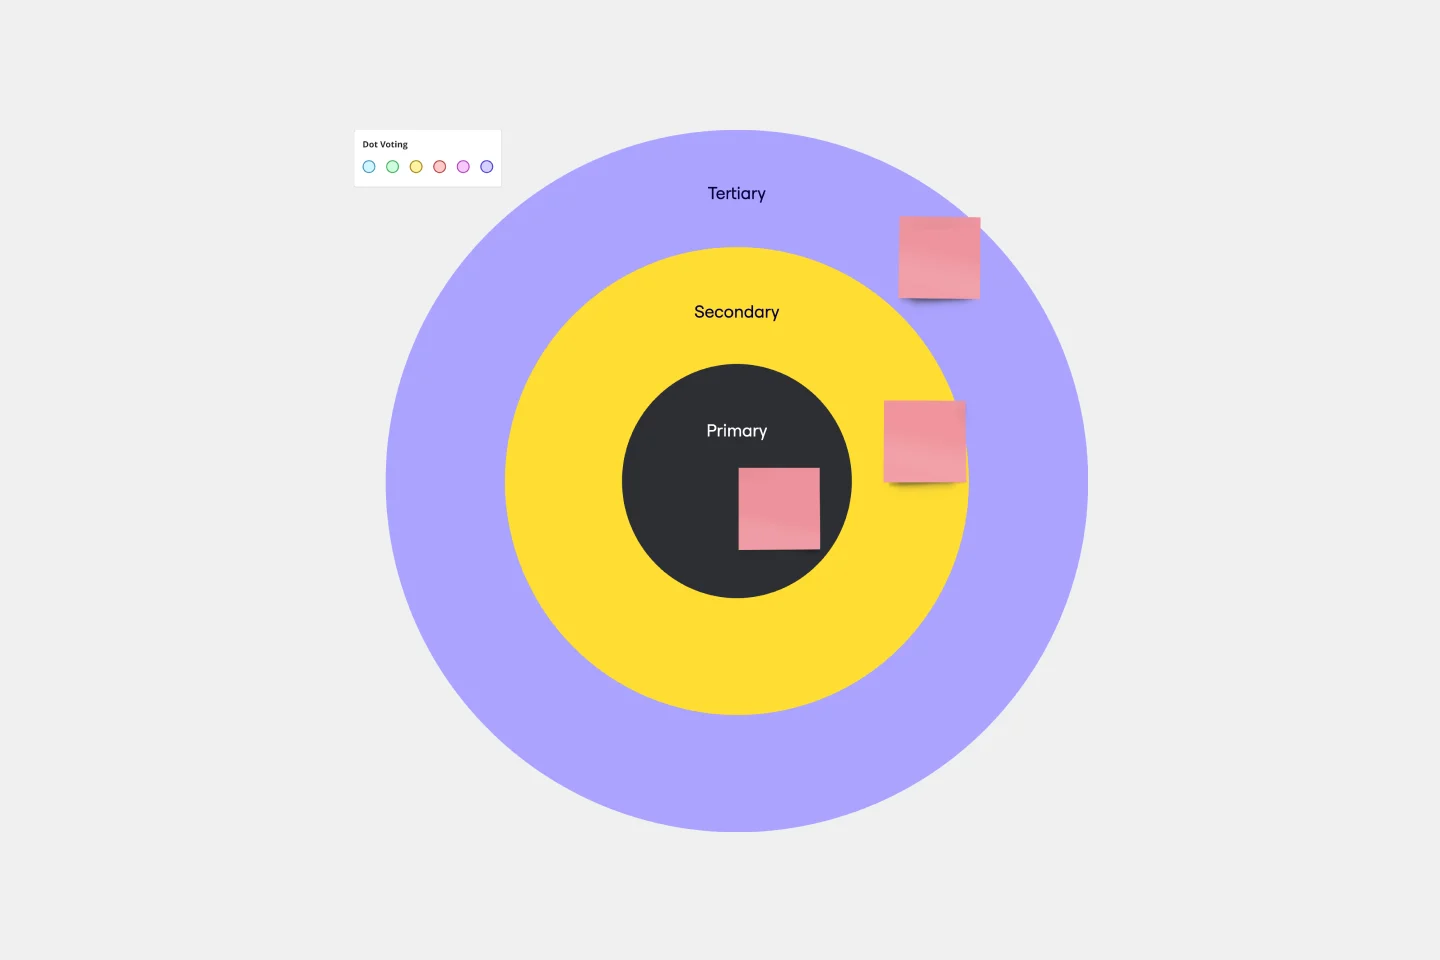
Bull's Eye Diagram Template
Works best for:
Diagrams, Project Management, Prioritization
When you’re a growing organization, every decision can feel like it has make-or-break consequences—which can lead to decision paralysis, an inability to prioritize, inefficient meetings, and even low morale. If that sounds like you, put a Bull’s Eye Diagram to work. True to its name, a Bull’s Eye Diagram uses a model of concentric circles to help companies establish priorities, make critical decisions, or discuss how to remove or overcome obstacles.
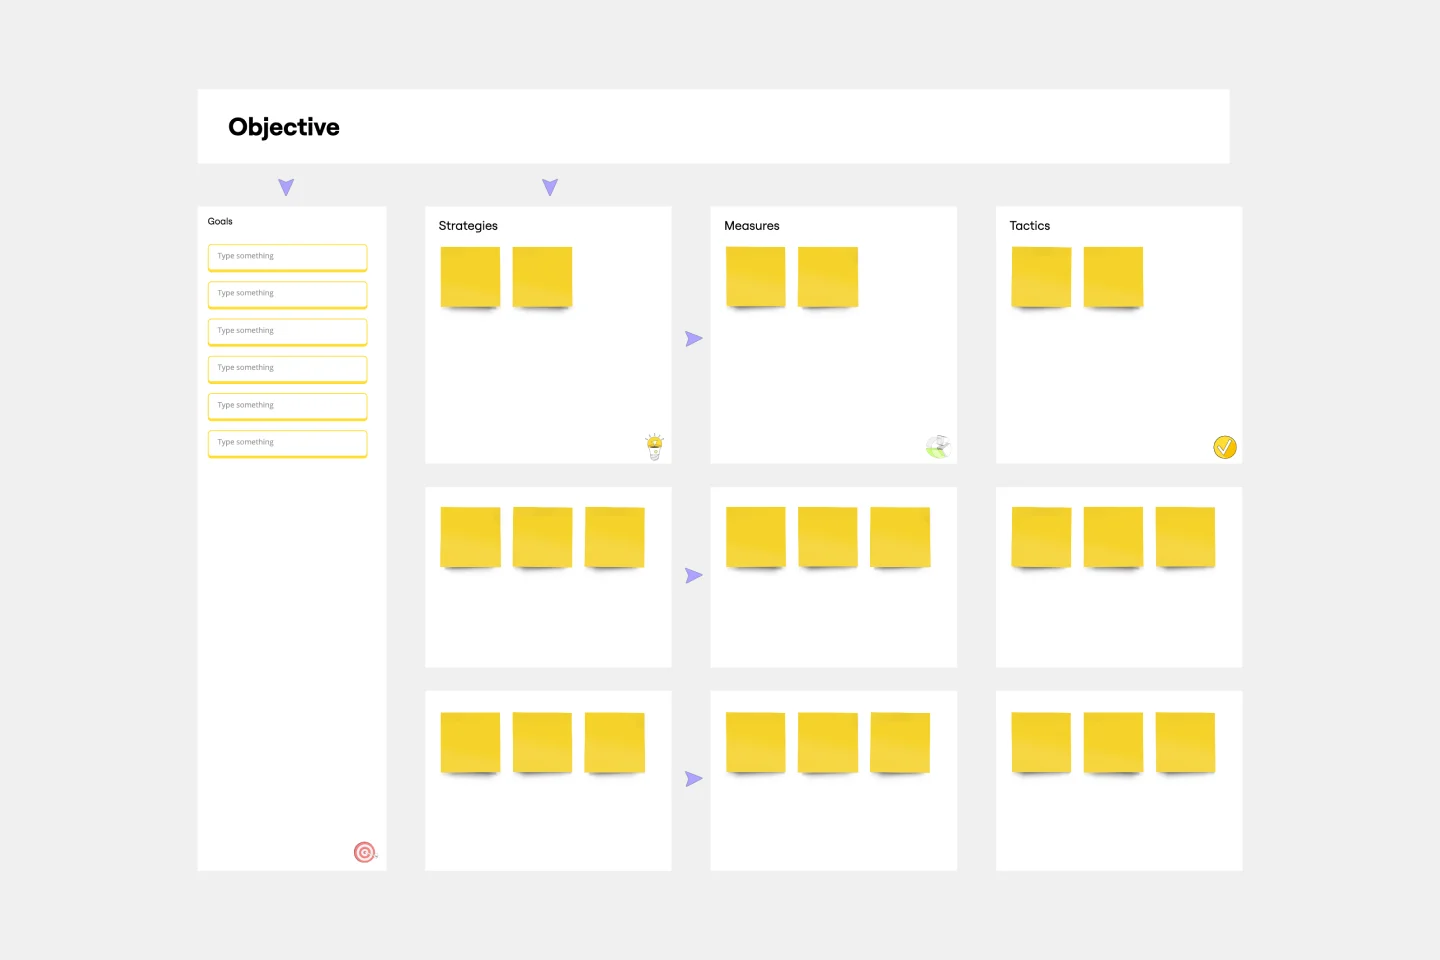
OGSM Template
Works best for:
Strategy, Planning
The OGSM template provides a readable framework, systematically breaking down business strategies into Objectives, Goals, Strategies, and Measures. This structured approach ensures that overarching visions are translated into actionable plans, fostering alignment across different teams and initiatives. One standout benefit of using this template is its ability to offer clarity. By clearly delineating between broad objectives and specific measures, stakeholders can easily comprehend and stay focused on the most critical elements of a strategy, ensuring that all efforts are directed toward the desired outcomes.
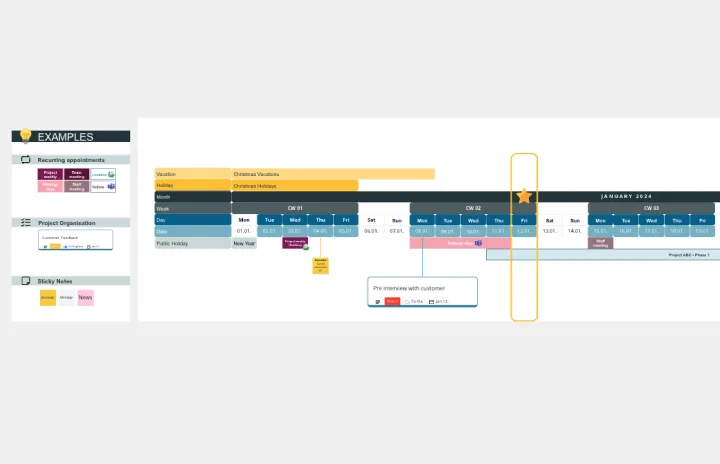
Workday Calendar - Timeline 2024
Works best for:
Planning, Timeline
The Workday Calendar Timeline 2024 template is ideal for planning your work year. It helps you organize work schedules, track important deadlines, and plan for holidays and events. This template ensures you stay productive and on top of your work commitments.
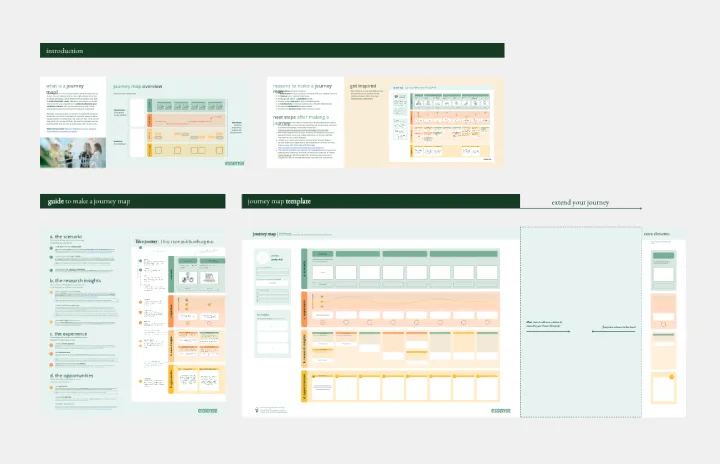
Journey Map To Plot the Customer Experience
Works best for:
Customer Journey Map
A journey is a tool to map out the customer experience of (a part of) your product/service in a visual way.
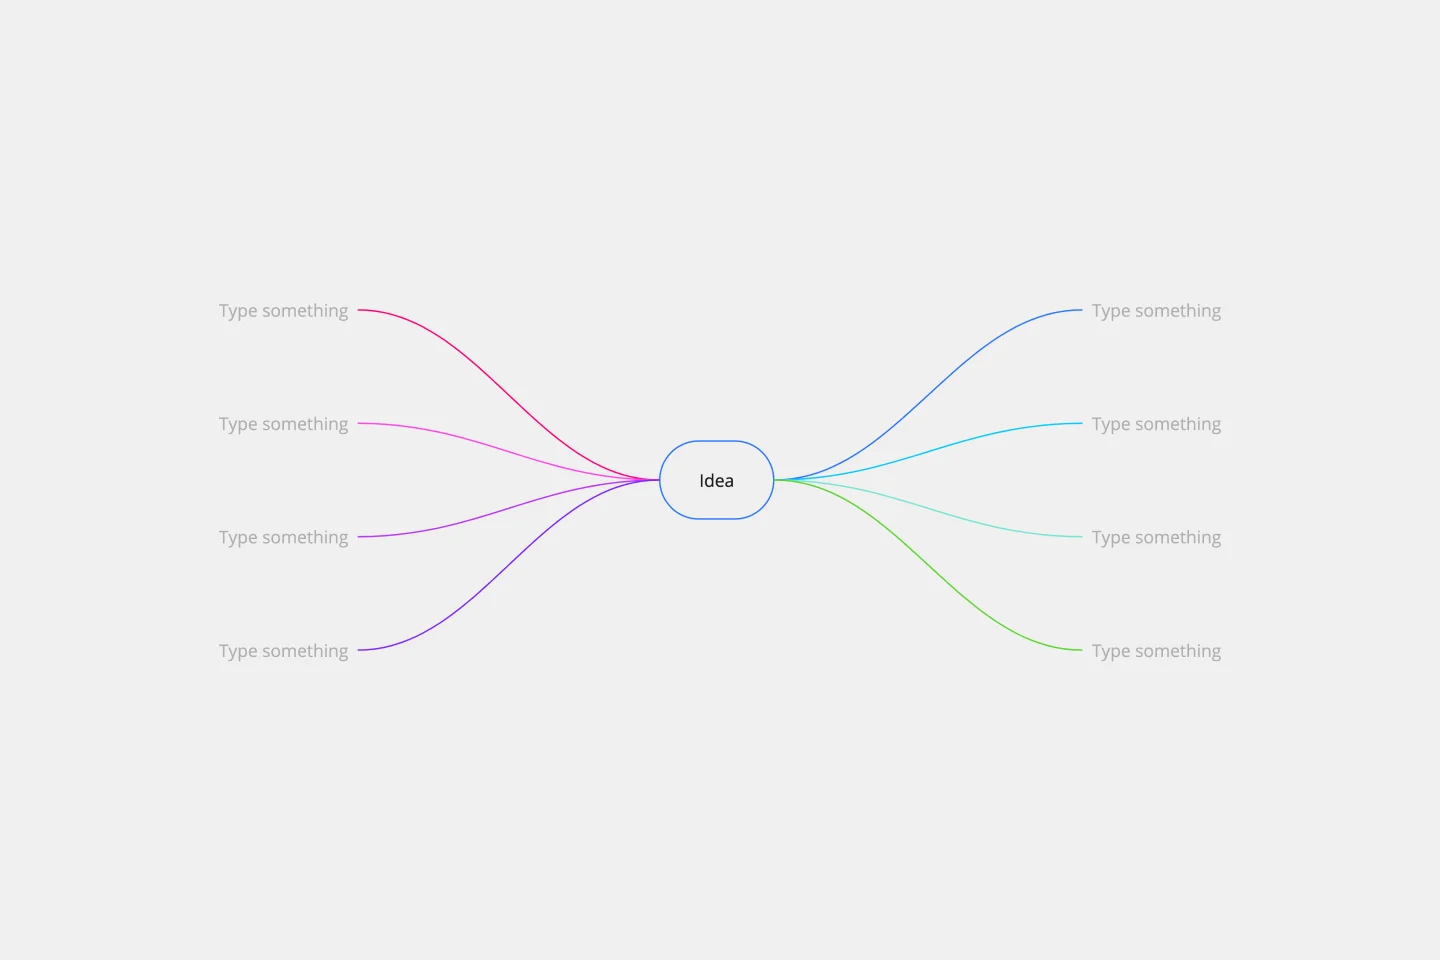
Random Words Template
Works best for:
Ideation, Brainstorming, Mind Mapping
Random word brainstorming is a simple, creative technique using random words to generate new ideas and creative solutions to your problems. Using random word prompts allows you to step beyond traditional boundaries and address challenges from a different direction. Random word brainstorming allows your team to unlock their creativity to solve business problems, create new inventions, improve existing ideas, or just think about problems in a new way.
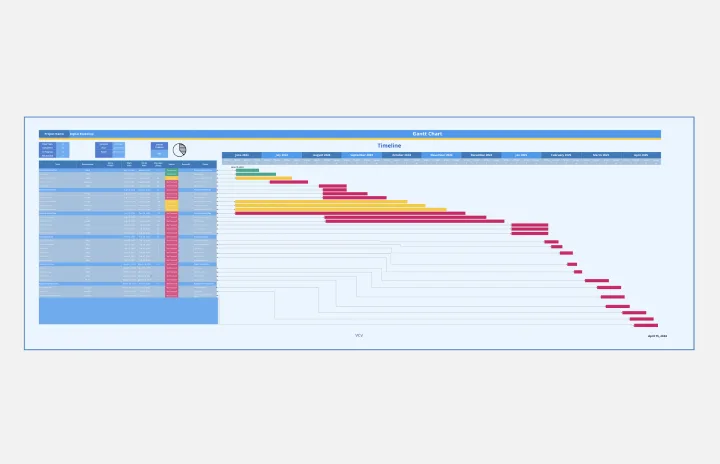
Gantt Chart Project
Works best for:
Strategy, Planning
The Gantt Chart Project template is a versatile tool for managing various types of projects. It provides a clear visual timeline of your project's tasks, deadlines, and dependencies. Use it to plan, execute, and monitor your project's progress, ensuring all activities are aligned and on track. This template enhances team collaboration, improves time management, and helps address potential bottlenecks for successful outcomes.