Venn Diagram for Product Development
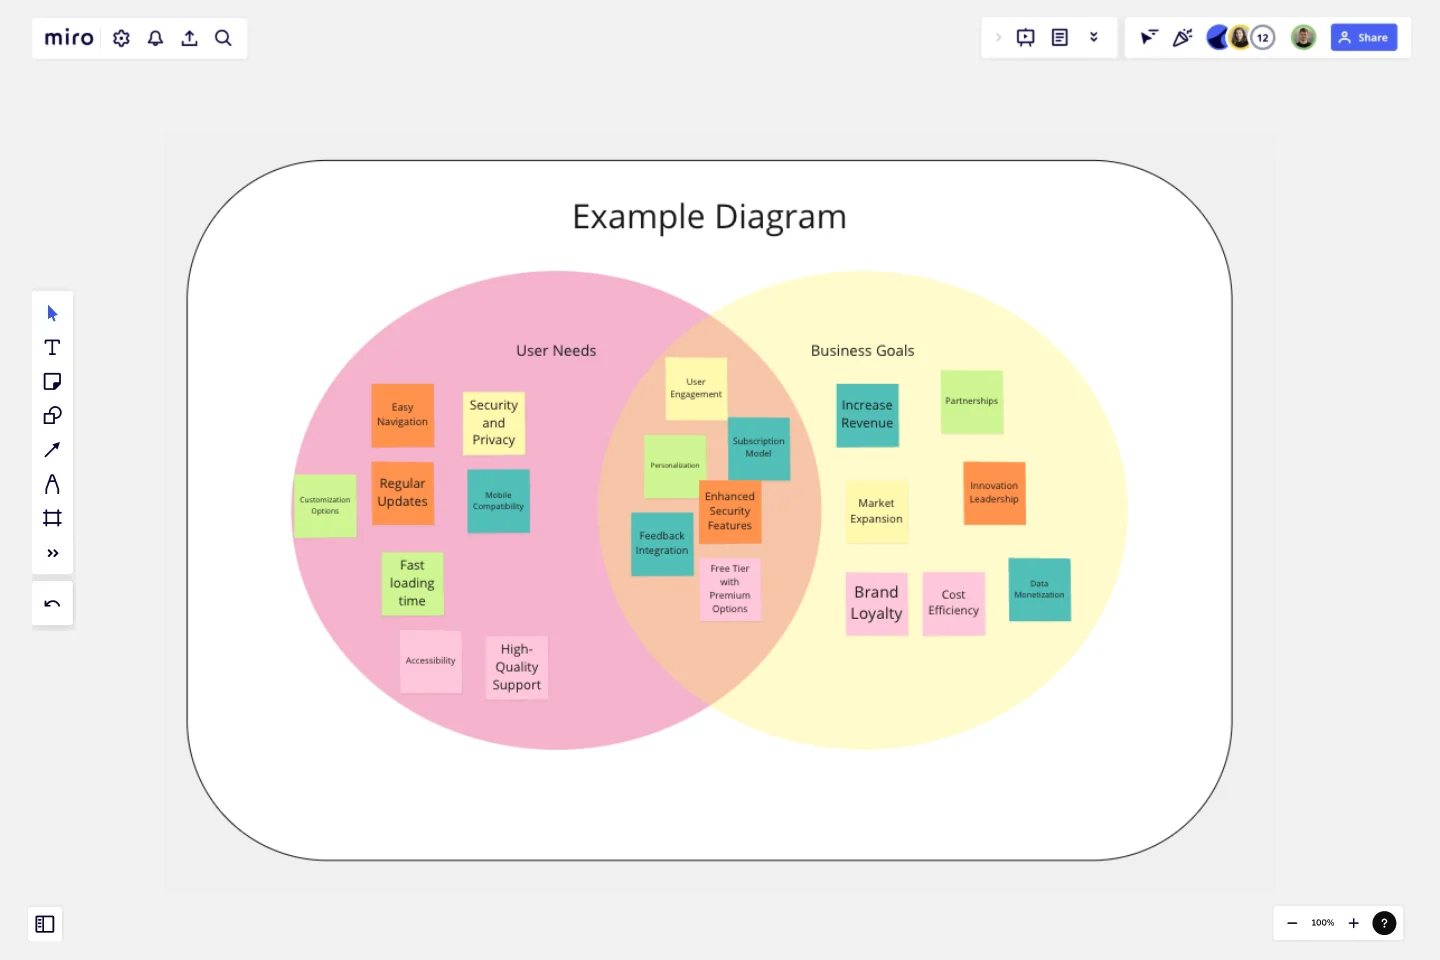
The Venn Diagram for Product Development template is a powerful tool designed to help teams align user needs with business goals.
By visually mapping out these two critical areas and identifying their intersections, this template facilitates a clearer understanding of where efforts should be focused for maximum impact.
Why Use This Template?
Clarify Priorities:
Visual Clarity: The template provides a simple, clear layout to help teams visually differentiate and prioritize user needs and business goals.
Focus Areas: It highlights the sweet spot where user needs and business goals overlap, showing areas that offer the highest potential for successful product development.
Enhance Collaboration:
Team Alignment: Use this template in meetings to ensure all team members and stakeholders are on the same page.
Interactive Tool: Perfect for interactive sessions, allowing teams to collaboratively identify and discuss key priorities.
Drive Decision-Making:
Informed Choices: Helps teams make data-driven decisions by clearly showing which features and initiatives meet both user needs and business goals.
Strategic Planning: Ideal for planning product features, enhancements, and roadmaps with a balanced approach.
Ease of Use:
Pre-Labeled Sections: Comes with pre-labeled sections for "User Needs," "Business Goals," and the overlap area, making it easy to get started.
Editable Placeholders: Includes editable placeholders for quick note-taking and brainstorming.
Versatile Application:
Adaptable: Suitable for various stages of product development, from initial brainstorming to detailed planning.
Reusable: Can be reused for different products or iterations, making it a valuable tool for ongoing development processes.
Use Cases:
Product Brainstorming: Identify which features or enhancements to prioritize based on user feedback and business objectives.
Strategy Meetings: Align product strategy with overall business goals and customer demands.
Feature Planning: Plan and prioritize features that offer the best balance between user satisfaction and business success.
Team Workshops: Facilitate collaborative workshops to gather diverse perspectives and insights.
By using the Venn Diagram for Product Development template, teams can ensure a balanced and comprehensive approach to product planning, leading to more effective and successful outcomes.
This template was created by Anthony.
Get started with this template right now.
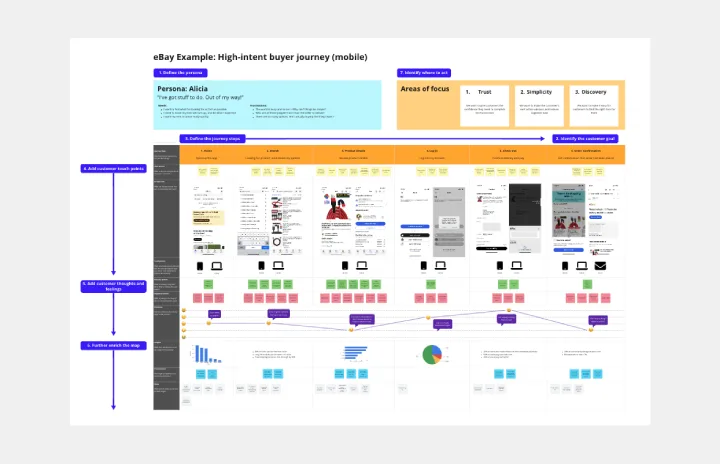
Customer Journey Map by Hustle Badger
Works best for:
Customer Journey Map
Customer journey mapping is a method that visualizes and narrates how users navigate a site or app to achieve their objectives.
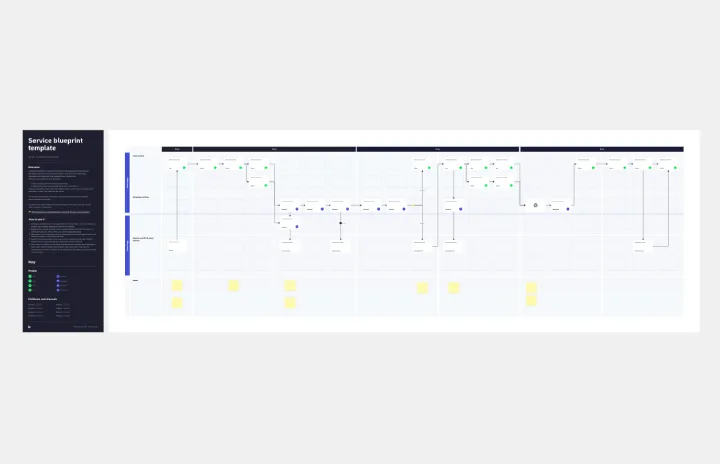
Service Blueprint by Hyperact
Works best for:
Research & Design
The Service Blueprint template is perfect for visualizing the orchestration of service components. It maps out frontstage and backstage elements, helping you analyze and enhance customer experiences. Use this template to align teams, identify pain points, and streamline processes, ensuring a seamless service delivery. It's ideal for creating a shared understanding of service dynamics among stakeholders and collaborators.
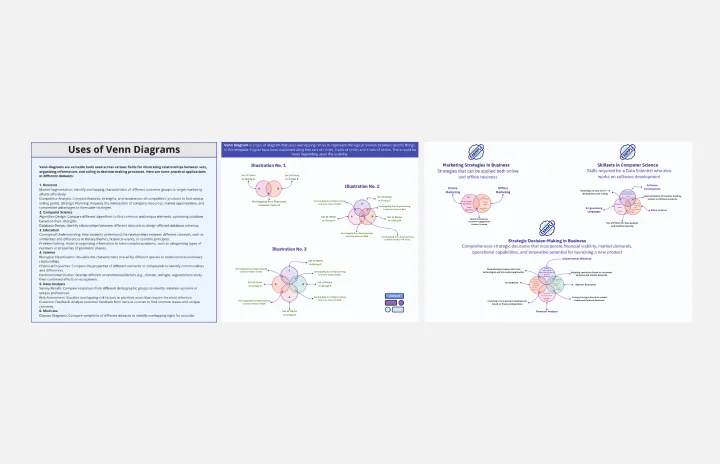
Venn Diagram Practical Applications
Works best for:
Venn Diagram
The Venn Diagram for Practical Applications template helps you apply Venn diagrams to real-world scenarios. Use this template to solve problems, identify relationships, and make decisions based on clear visual analysis. It's perfect for practical tasks such as project planning, resource allocation, and strategic decision-making. This tool is ideal for business professionals, educators, and anyone looking to apply theoretical concepts to practical situations.
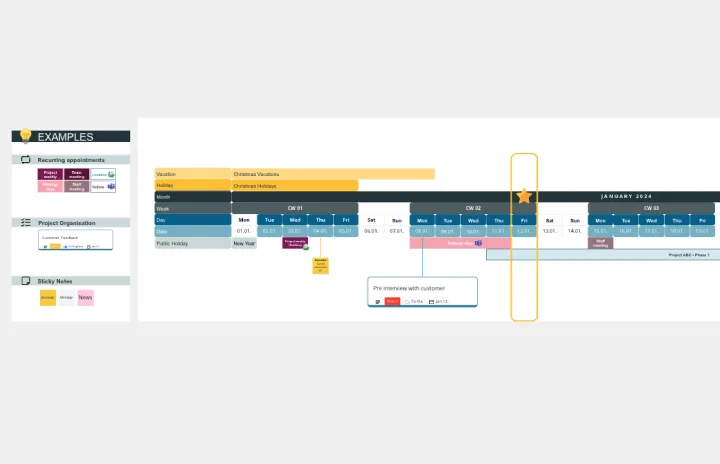
Workday Calendar - Timeline 2024
Works best for:
Planning, Timeline
The Workday Calendar Timeline 2024 template is ideal for planning your work year. It helps you organize work schedules, track important deadlines, and plan for holidays and events. This template ensures you stay productive and on top of your work commitments.
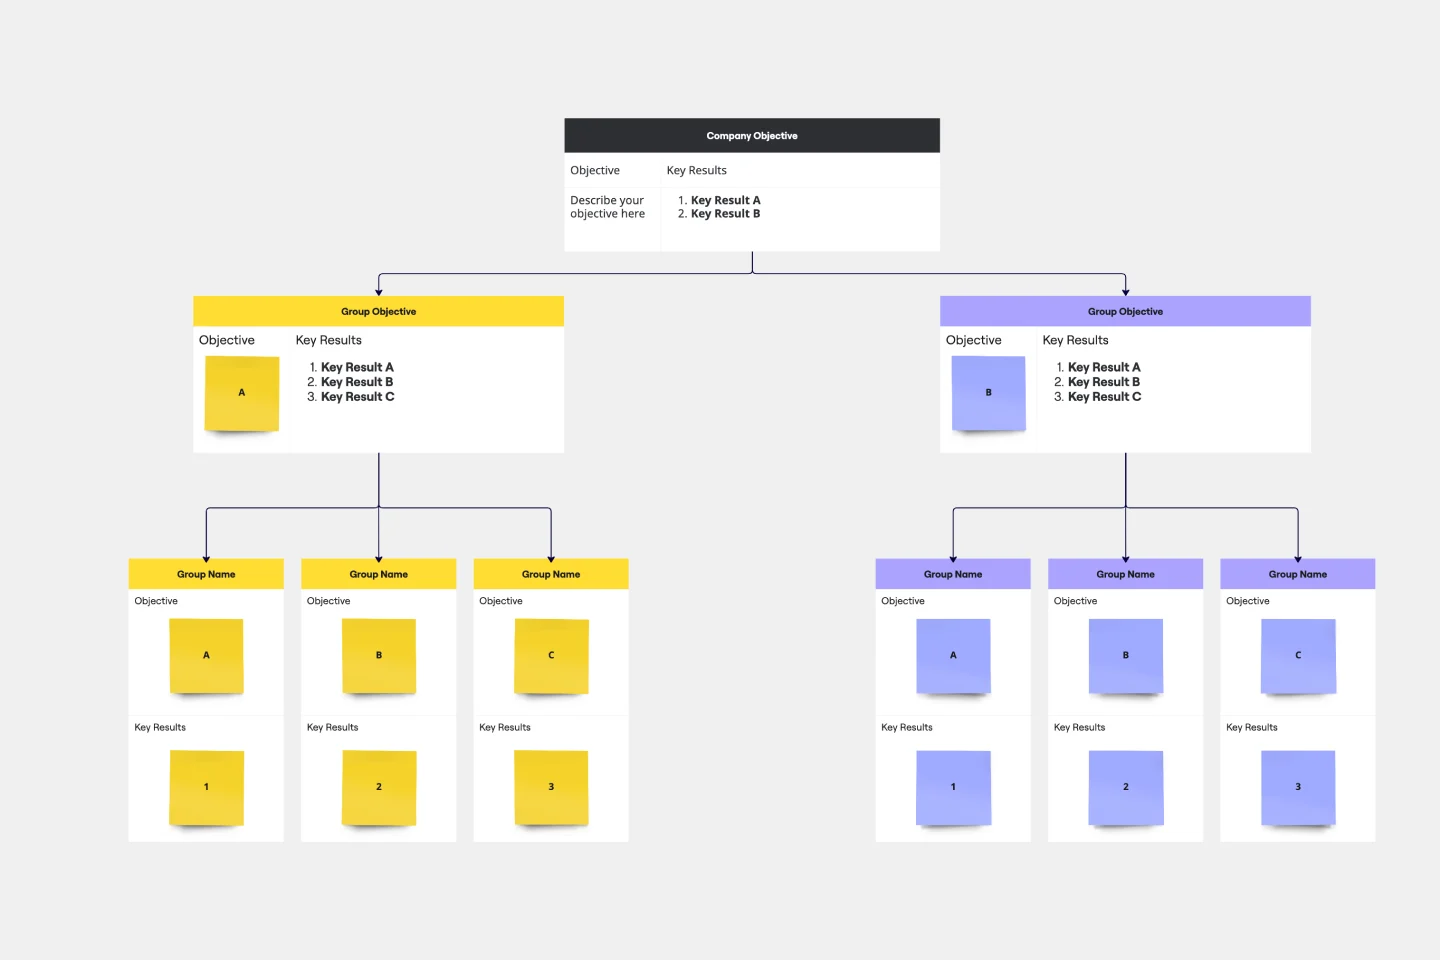
Objectives and Key Results (OKRs) Template
Works best for:
Leadership, Strategic Planning, Project Planning
Clarity, focus, and structure — those are the key ingredients to feeling confident in your company’s directions and decisions, and an OKR framework is designed to give them to you. Working on two main levels — strategic and operational — OKRs (short for objectives and key results) help an organization’s leaders determine the strategic objectives and define quarterly key results, which are then connected to initiatives. That’s how OKRs empower teams to focus on solving the most pressing organizational problems they face.

20/80 Process Diagram - EOS Compatible
Works best for:
Diagramming
The 20/80 Process Diagram - EOS® Compatible template is a visual tool for mapping out processes and workflows aligned with the Entrepreneurial Operating System (EOS®) methodology. It provides a structured framework for identifying core processes and key activities that drive business outcomes. This template enables organizations to streamline operations, clarify roles and responsibilities, and enhance accountability. By promoting alignment with EOS® principles, the 20/80 Process Diagram empowers teams to achieve organizational excellence and drive sustainable growth.