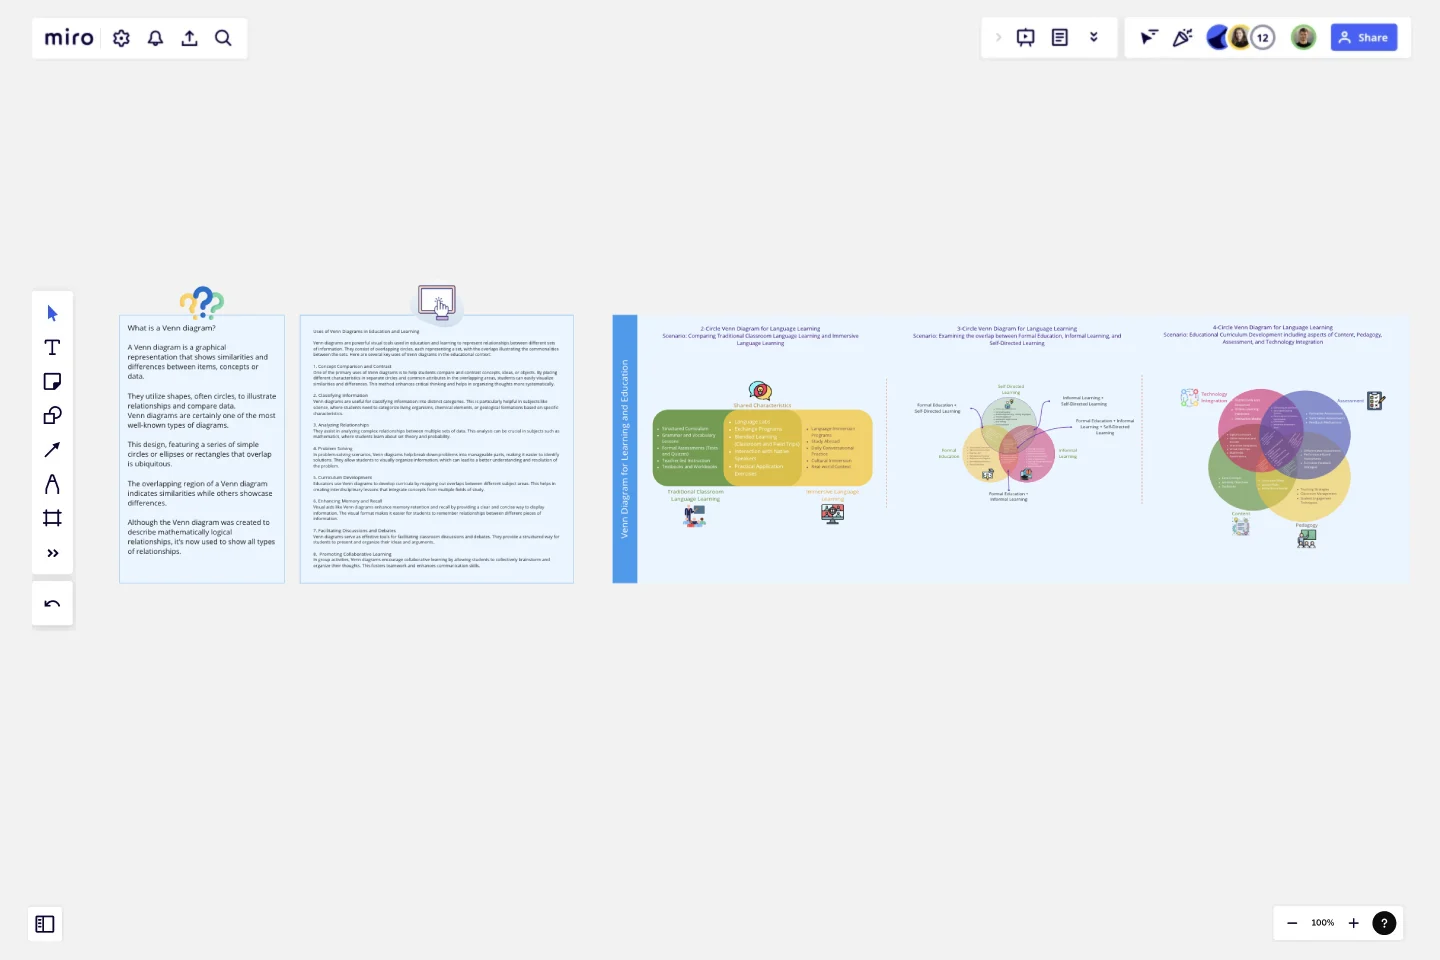
Venn Diagram for Learning and Education
A Venn diagram is a graphical representation that shows similarities and differences between items, concepts or data.
They utilize shapes, often circles, to illustrate relationships and compare data.
Venn diagrams are certainly one of the most well-known types of diagrams. This design, featuring a series of simple circles or ellipses or rectangles that overlap is ubiquitous. The overlapping region of a Venn diagram indicates similarities while others showcase differences. Although the Venn diagram was created to describe mathematically logical relationships, it’s now used to show all types of relationships.
Uses of Venn Diagrams in Education and Learning
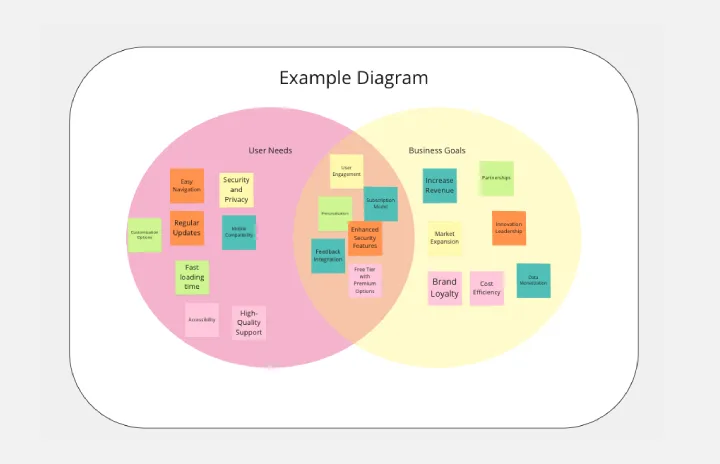
Venn diagrams are powerful visual tools used in education and learning to represent relationships between different sets of information. They consist of overlapping circles, each representing a set, with the overlaps illustrating the commonalities between the sets. Here are several key uses of Venn diagrams in the educational context:
1. Concept Comparison and Contrast
One of the primary uses of Venn diagrams is to help students compare and contrast concepts, ideas, or objects. By placing different characteristics in separate circles and common attributes in the overlapping areas, students can easily visualize similarities and differences. This method enhances critical thinking and helps in organizing thoughts more systematically.
2. Classifying Information
Venn diagrams are useful for classifying information into distinct categories. This is particularly helpful in subjects like science, where students need to categorize living organisms, chemical elements, or geological formations based on specific characteristics.
3. Analyzing Relationships
They assist in analyzing complex relationships between multiple sets of data. This analysis can be crucial in subjects such as mathematics, where students learn about set theory and probability.
4. Problem Solving
In problem-solving scenarios, Venn diagrams help break down problems into manageable parts, making it easier to identify solutions. They allow students to visually organize information, which can lead to a better understanding and resolution of the problem.
5. Curriculum Development
Educators use Venn diagrams to develop curricula by mapping out overlaps between different subject areas. This helps in creating interdisciplinary lessons that integrate concepts from multiple fields of study.
6. Enhancing Memory and Recall
Visual aids like Venn diagrams enhance memory retention and recall by providing a clear and concise way to display information. The visual format makes it easier for students to remember relationships between different pieces of information.
7. Facilitating Discussions and Debates
Venn diagrams serve as effective tools for facilitating classroom discussions and debates. They provide a structured way for students to present and organize their ideas and arguments.
8. Promoting Collaborative Learning
In group activities, Venn diagrams encourage collaborative learning by allowing students to collectively brainstorm and organize their thoughts. This fosters teamwork and enhances communication skills.Three examples from the above areas have been created to help you understand the application of the Venn diagram in the Education and Learning domain.
This template was created by Khawaja Rizwan.
Get started with this template right now.
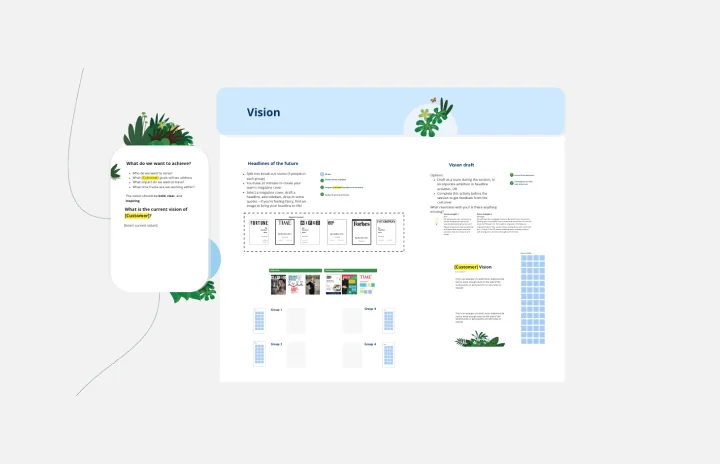
V2MOM Salesforce Template
Works best for:
Meetings, Strategic Planning
Align goals and strategies across your organization with the Salesforce V2MOM Template. Bring everyone together towards the same goals.
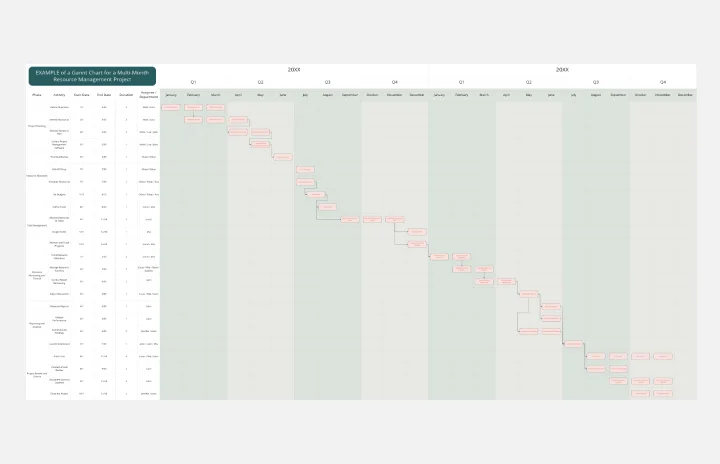
Resource Management Gantt Chart
Works best for:
Strategy, Planning
Efficient resource allocation is crucial for project success. The Resource Management Gantt Chart template helps you plan and manage your resources effectively. Use it to track the availability and allocation of personnel, equipment, and materials throughout your project. This template ensures resources are optimally utilized, reducing waste and avoiding delays, providing a clear overview of assignments and workload balance.
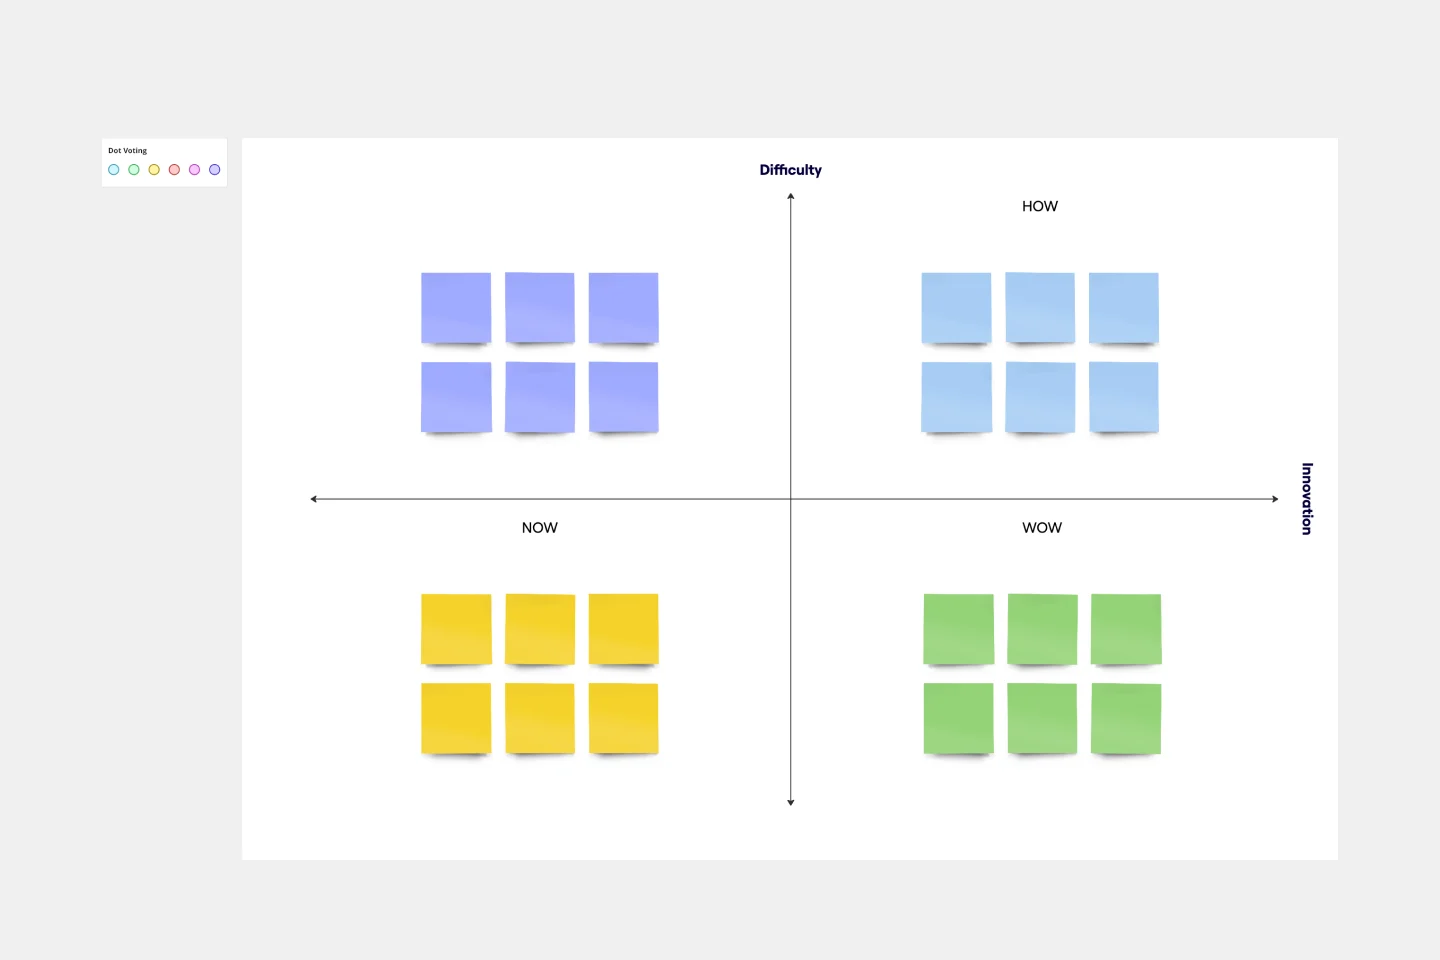
How Now Wow Matrix Template
Works best for:
Ideation, Product Management, Prioritization
There are no bad ideas in a brainstorm — but some are more original and easier to implement. The How Now Wow matrix is a tool that helps you identify and organize those great ideas, as well as reinvigorates your team to think creatively and take risks (a taller order as you scale). Grab this template to create your own matrix, then rank the ideas you generated in a brainstorm as “How” (difficult to implement), “Now” (easy to implement), or “Wow” (both original and easy to implement).
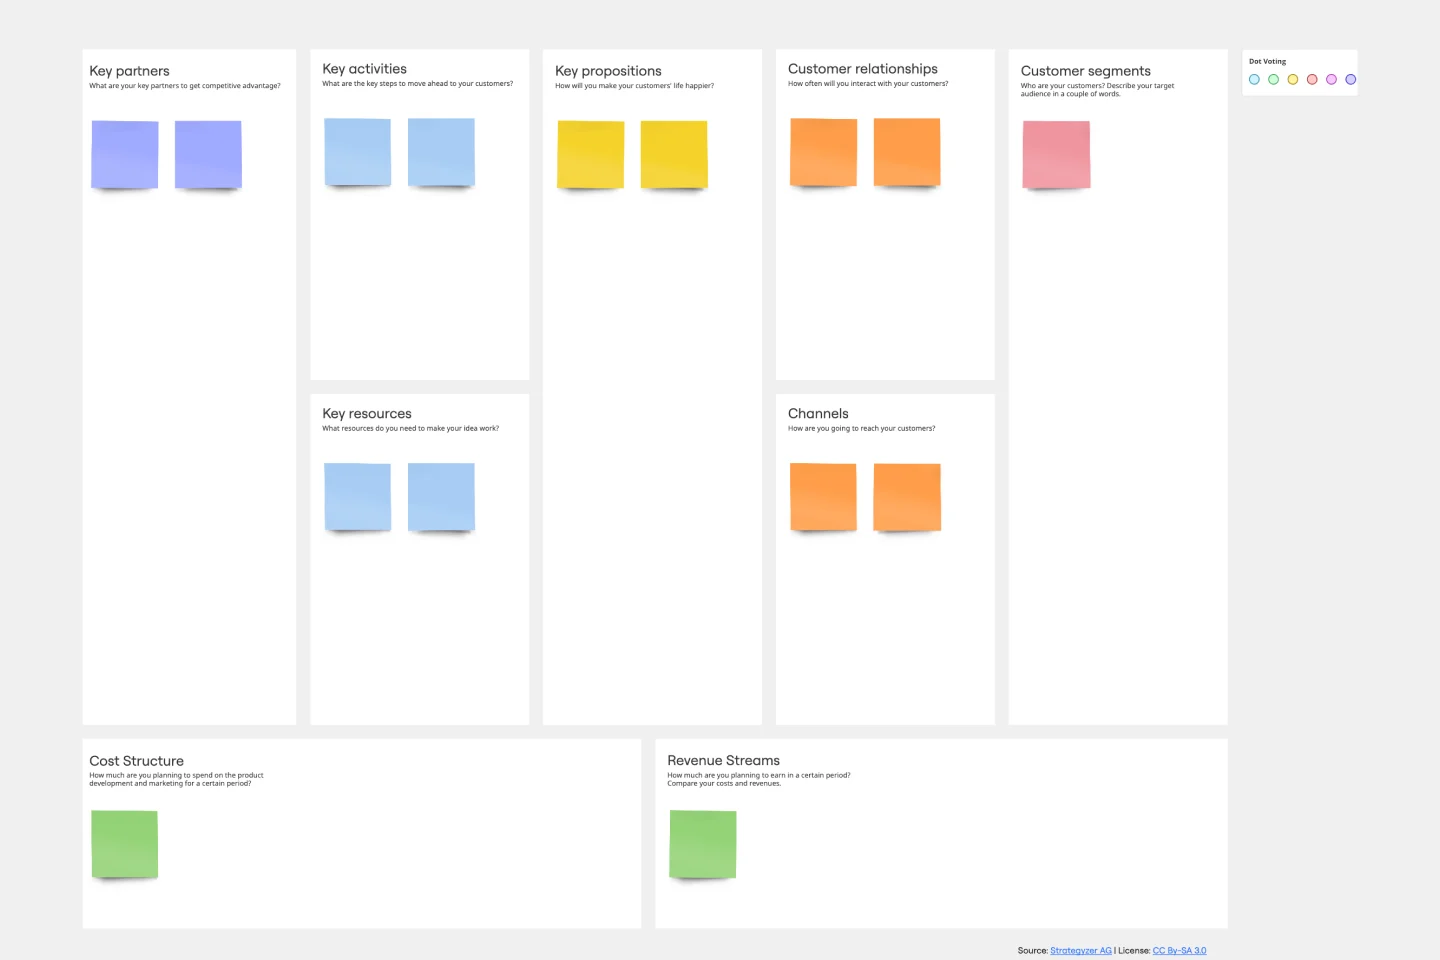
Business Model Canvas Template
Works best for:
Leadership, Agile Methodology, Strategic Planning
Your business model: Nothing is more fundamental to who you are, what you create and sell, or ultimately whether or not you succeed. Using nine key building blocks (representing nine core business elements), a BMC gives you a highly usable strategic tool to develop and display your business model. What makes this template great for your team? It’s quick and easy to use, it keeps your value proposition front and center, and it creates a space to inspire ideation.
Venn Diagram for Product Development
Works best for:
Venn Diagrams
Streamline your product development process with the Venn Diagram for Product Development template. Use it to compare product features, identify market needs, and explore design options. This template helps you visualize relationships and prioritize features based on customer requirements and competitive analysis. It's an essential tool for product managers, designers, and development teams aiming to create successful and user-centric products.
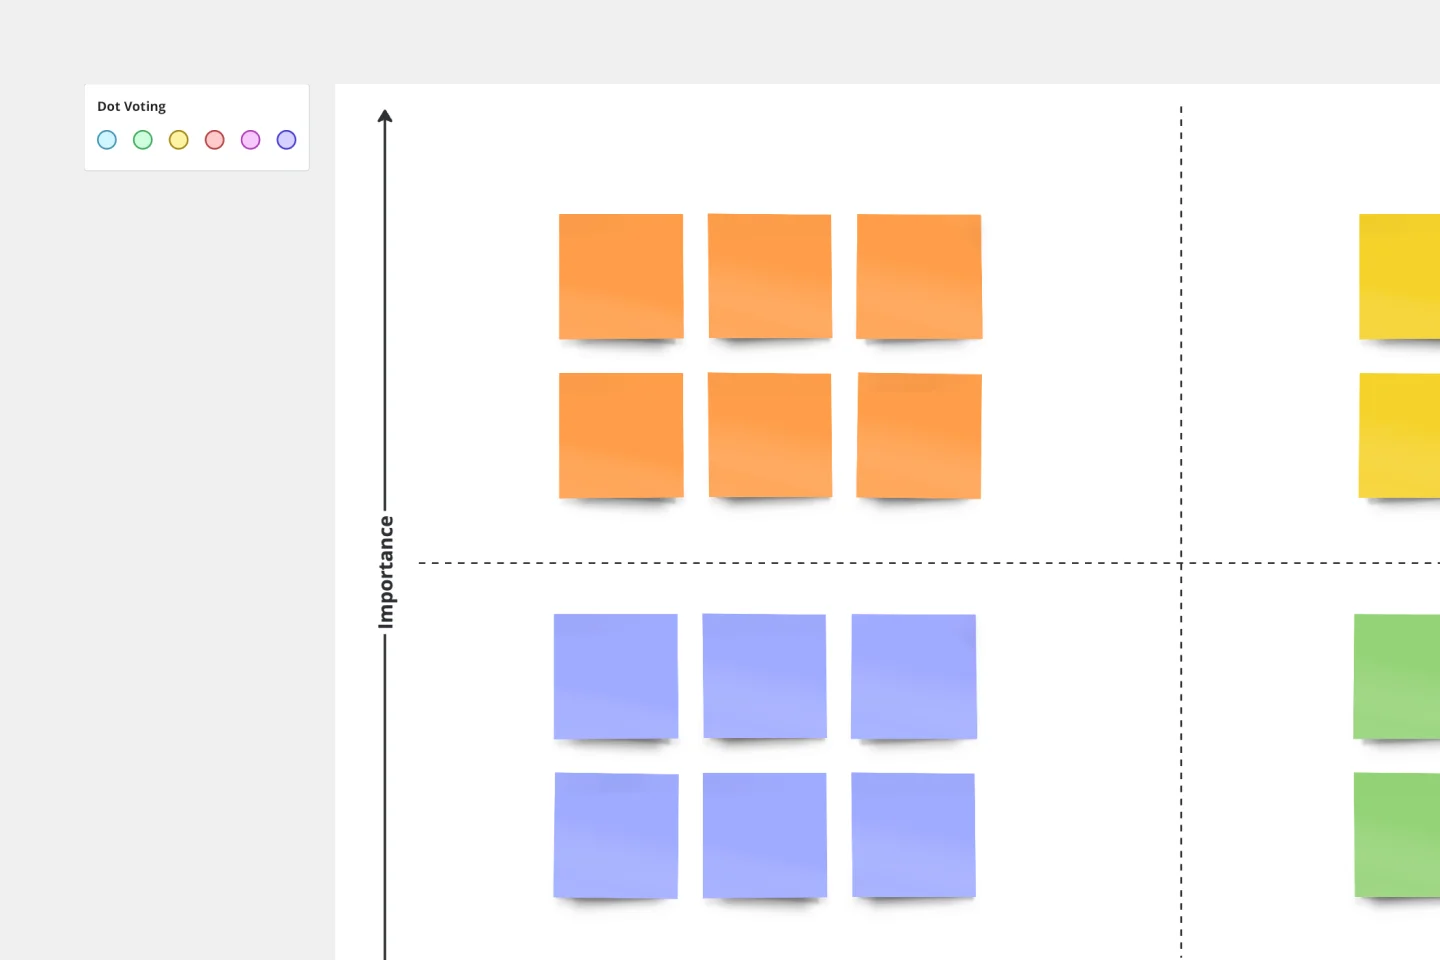
2x2 Prioritization Matrix Template
Works best for:
Operations, Strategic Planning, Prioritization
Ready to set boundaries, prioritize your to-dos, and determine just what features, fixes, and upgrades to tackle next? The 2x2 prioritization matrix is a great place to start. Based on the lean prioritization approach, this template empowers teams with a quick, efficient way to know what's realistic to accomplish and what’s crucial to separate for success (versus what’s simply nice to have). And guess what—making your own 2x2 prioritization matrix is easy.