UML Use Case Diagram
Visualize system interactions with the UML Use Case Diagram. Map out user interactions and system processes for better planning.
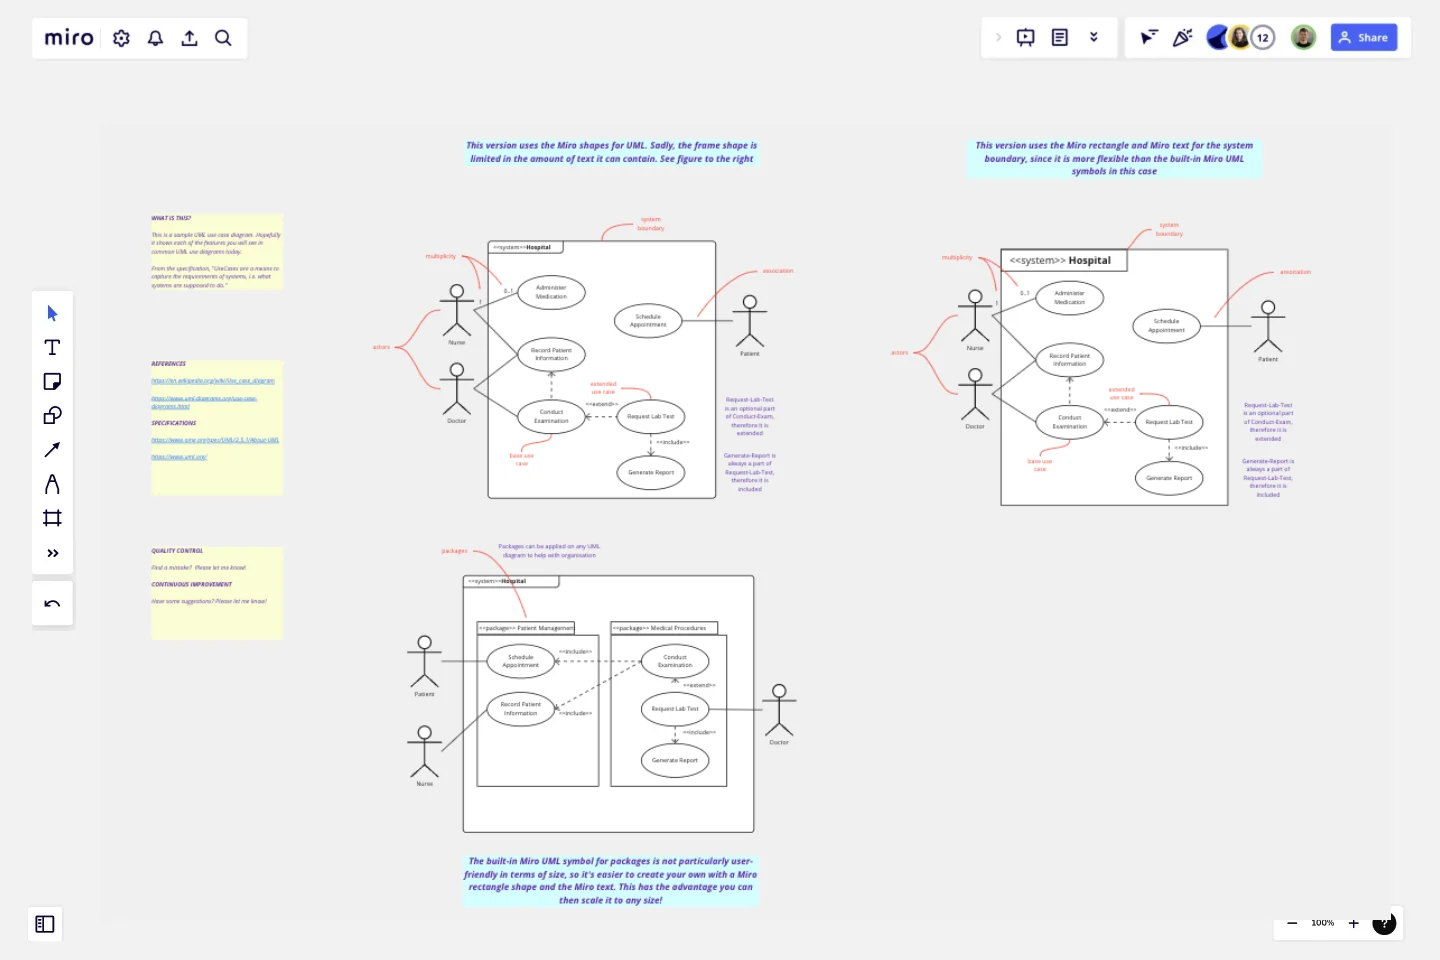
It is an internationally recognized standard consisting of 14 diagrams in two categories: behavior diagrams (that document how systems work and interact) and structural diagrams (that document how systems are structured.The UML Use Case Diagram is without doubt the most common behavioral diagram. It visually represents the functional requirements of a system, illustrating the interactions between users (actors) and the system to achieve specific goals (use cases).
Who can use this [UML Use Case Diagram] template
This template can be used by anyone who needs to create a UML Use Case Diagram.
How to use this [UML Use Case Diagram] template
This template contains two sample UML Use Case diagrams: one that has been created with Miro's built-in diagramming symbols, and one that uses some custom symbols. For simple diagrams, the built-in Miro symbols will probably work well. But in some cases (such as when the text is very long) not all the built-in Miro symbols will look as aesthetically pleasing as they could.
What this [UML Use Case Diagram] helps you accomplish
If you need to create a UML Use Case diagram, this template can hopefully make the job a bit easier and faster. Instead of starting from scratch, you can copy-and-paste this diagram into your own template and customize as you require.
Tips and best practices
Identify your actors and systems clearly
Keep it simple and high-level
Use descriptive names (e.g. "order pizza")
Take a goal-oriented approach. In other words, what goals do the actors have and what use cases are required for the actors to achieve their goals.
This template was created by Ken Ritley.
Get started with this template right now.
ERD Blogging System Template
Works best for:
ERD
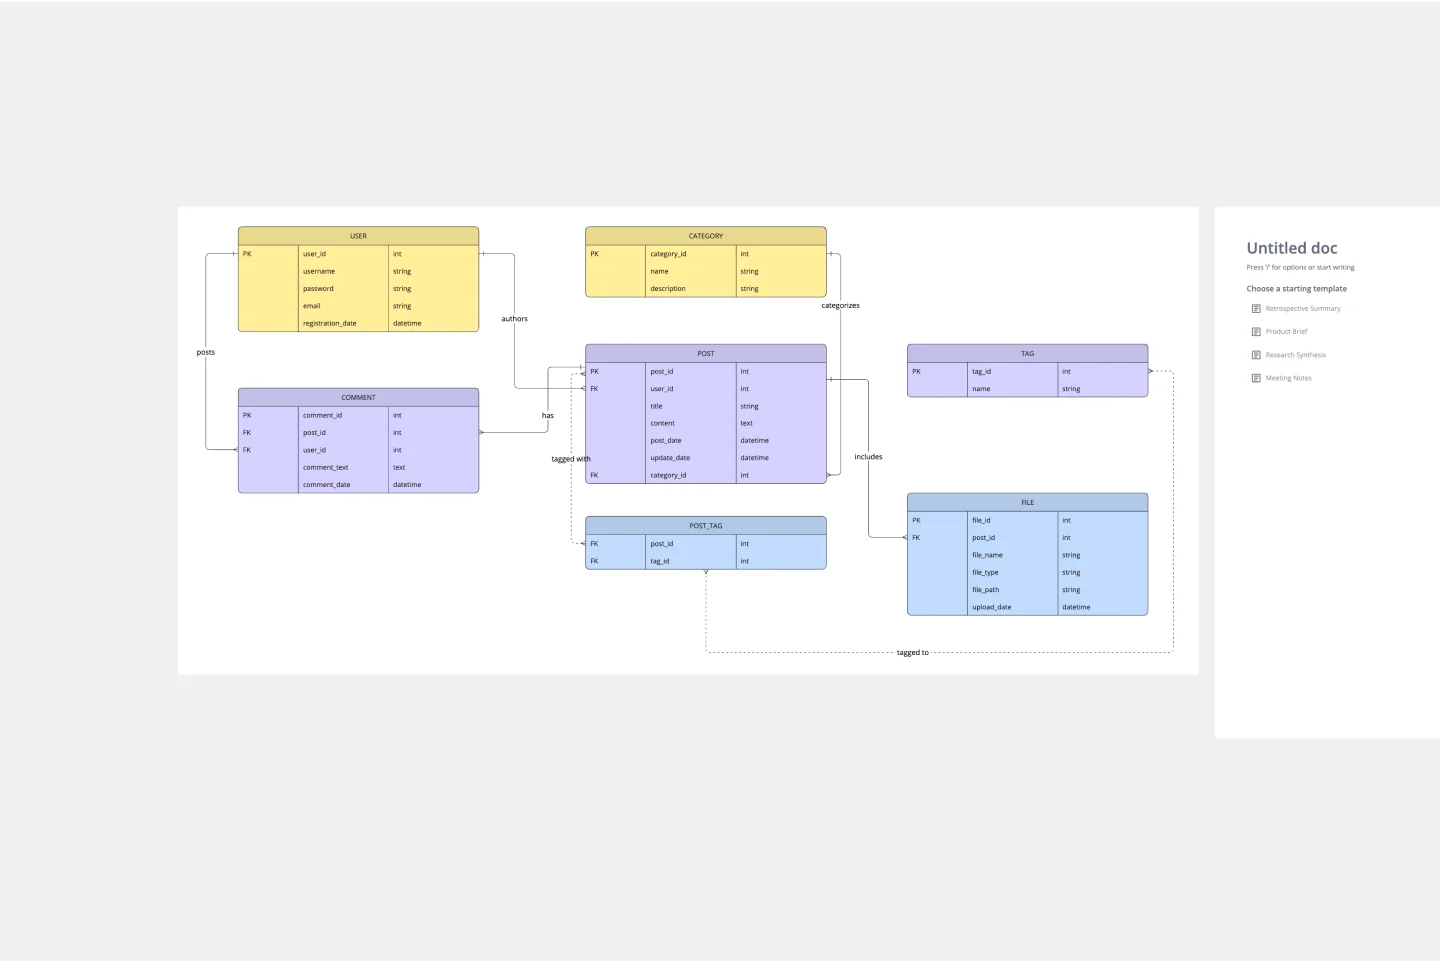
The ERD Blogging System template in Miro efficiently manages and organizes digital content. It features key entities such as User, Post, Comment, Category, Tag, and File, which are essential for managing the creation and publication of blog posts, engaging users through comments, and organizing content via categories and tags. Additionally, it supports media attachments through the File entity, linking them to the relevant content. This template helps streamline the blogging process, making it an invaluable tool for content management and publication.
UML Activity Diagram Template
Works best for:
Diagrams
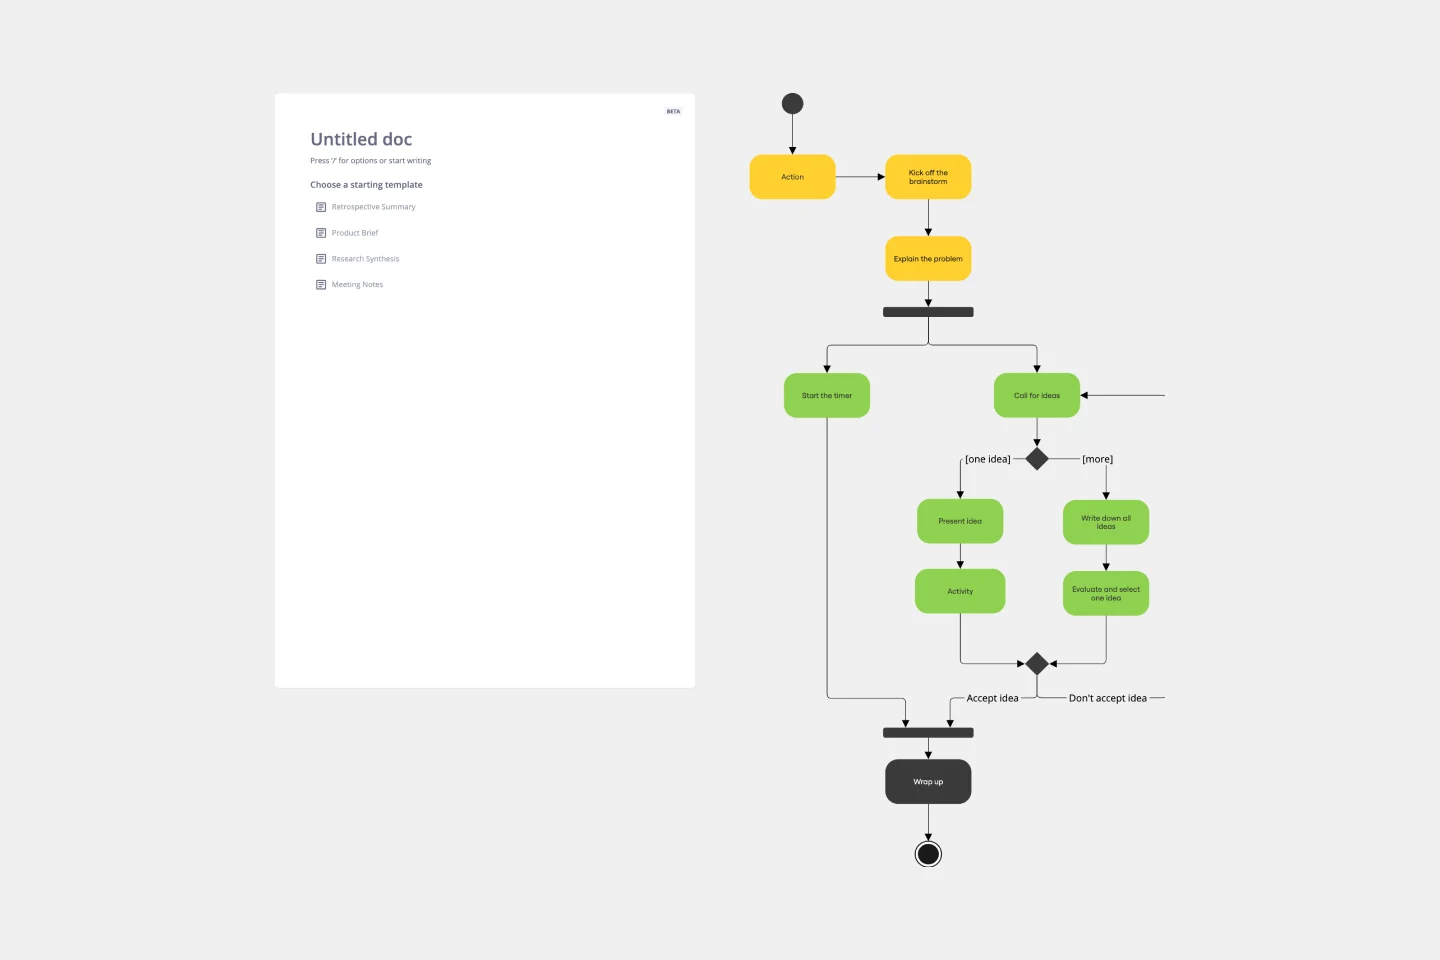
Use our Activity Diagram template to break down activities into smaller decisions and subprocesses. Improve and optimize systems and processes in I.T., business management, and more.
Turtle Diagram for BA
Works best for:
Diagramming
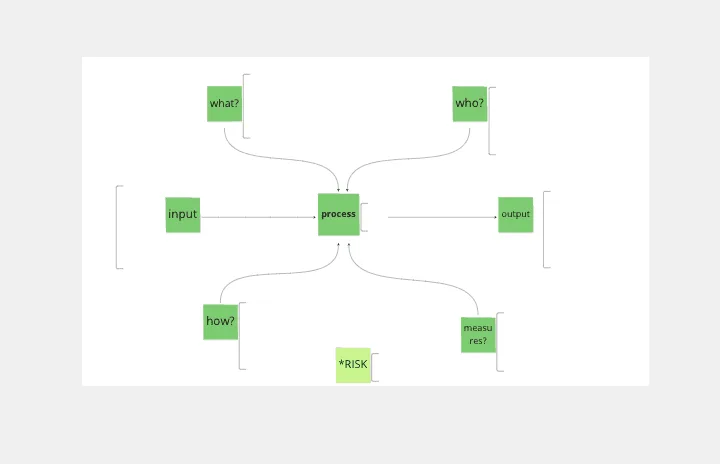
The Turtle Diagram for BA template offers a visual framework for defining and auditing business processes according to ISO 9001 standards. It provides elements for documenting process inputs, outputs, activities, and controls. This template enables organizations to ensure compliance, identify process improvements, and enhance quality management practices. By promoting systematic process documentation and auditability, the Turtle Diagram for BA empowers organizations to achieve and maintain ISO 9001 certification, demonstrating commitment to quality and continuous improvement.
Supply and Demand Graph Template
Works best for:
Market Research, Mapping, Diagrams
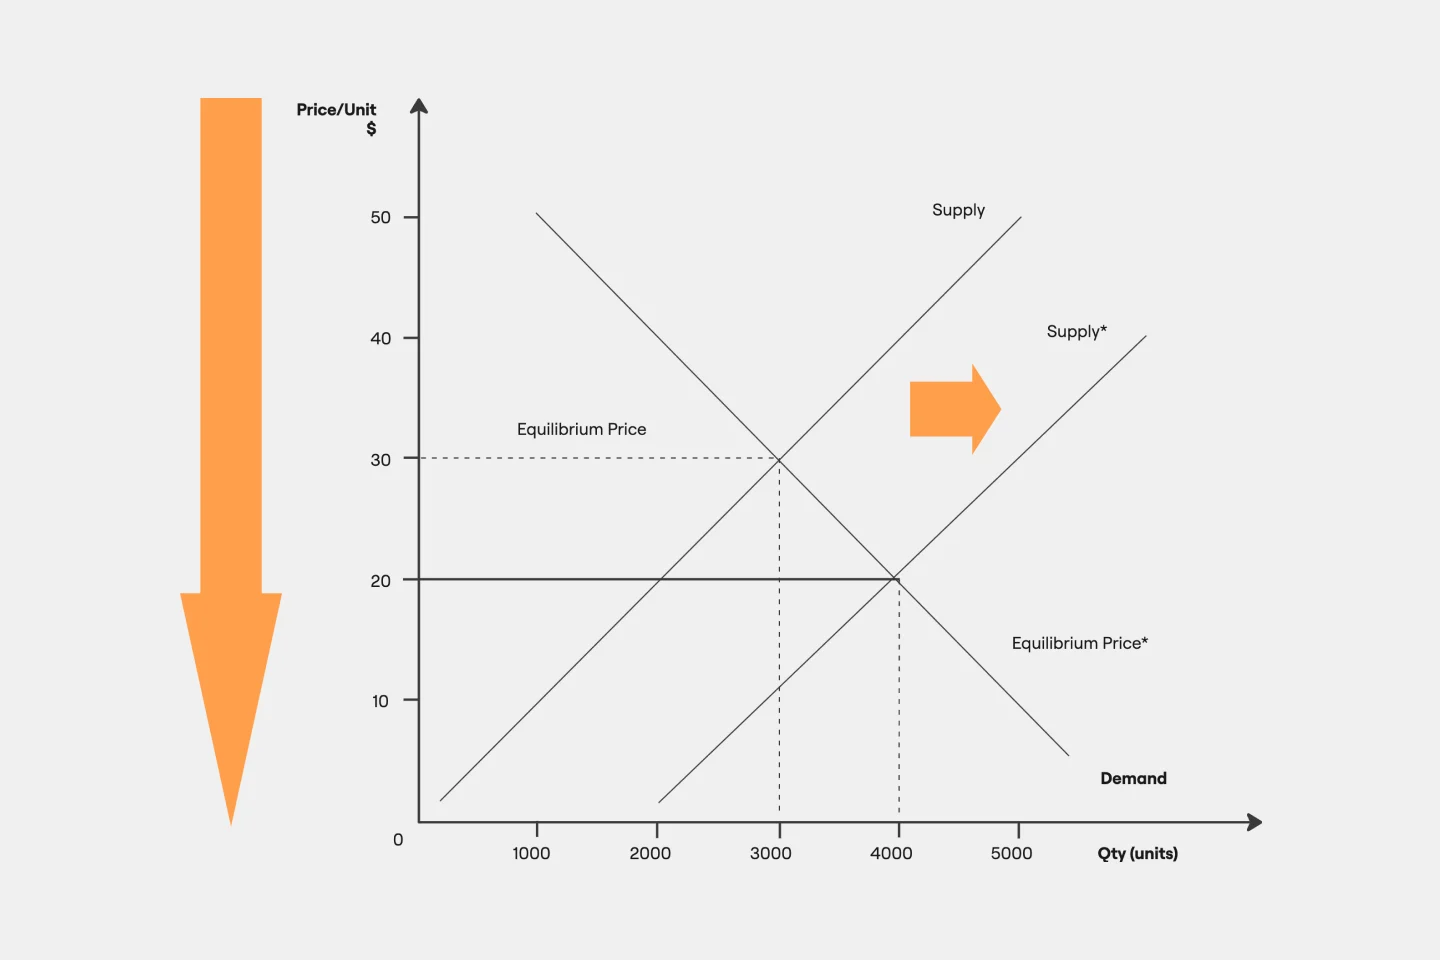
How do you price your product so that you make a profit while keeping customers and manufacturers happy? By finding a fair price. A supply and demand diagram is a graph that visualizes how much demand there is for your product and how many products you need. This, in turn, helps you with product pricing.
Project Management Flow Chart
Works best for:
Flowcharts, Diagrams, Mapping
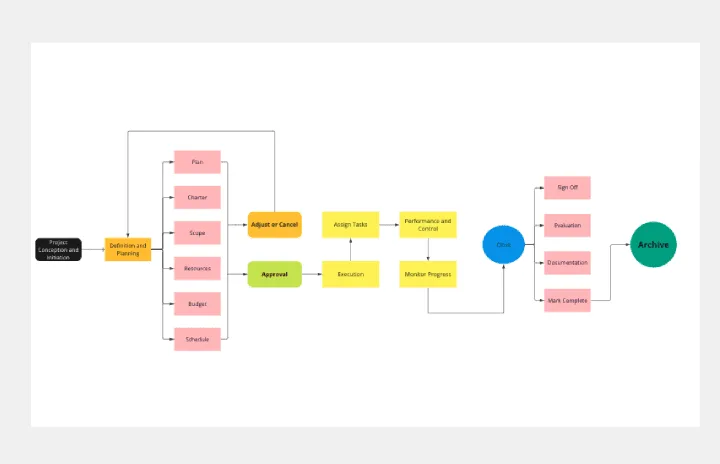
The Project Management Flow Chart template offers a visual tool for planning and managing projects using flowchart diagrams. It provides elements for mapping out project phases, tasks, dependencies, and timelines. This template enables project managers and teams to visualize project workflows, identify critical paths, and track progress effectively. By promoting clarity and transparency, the Project Management Flow Chart empowers organizations to deliver projects on time, within budget, and according to specifications.
ERD Customer Relationship Management (CRM) Template
Works best for:
ERD, CRM
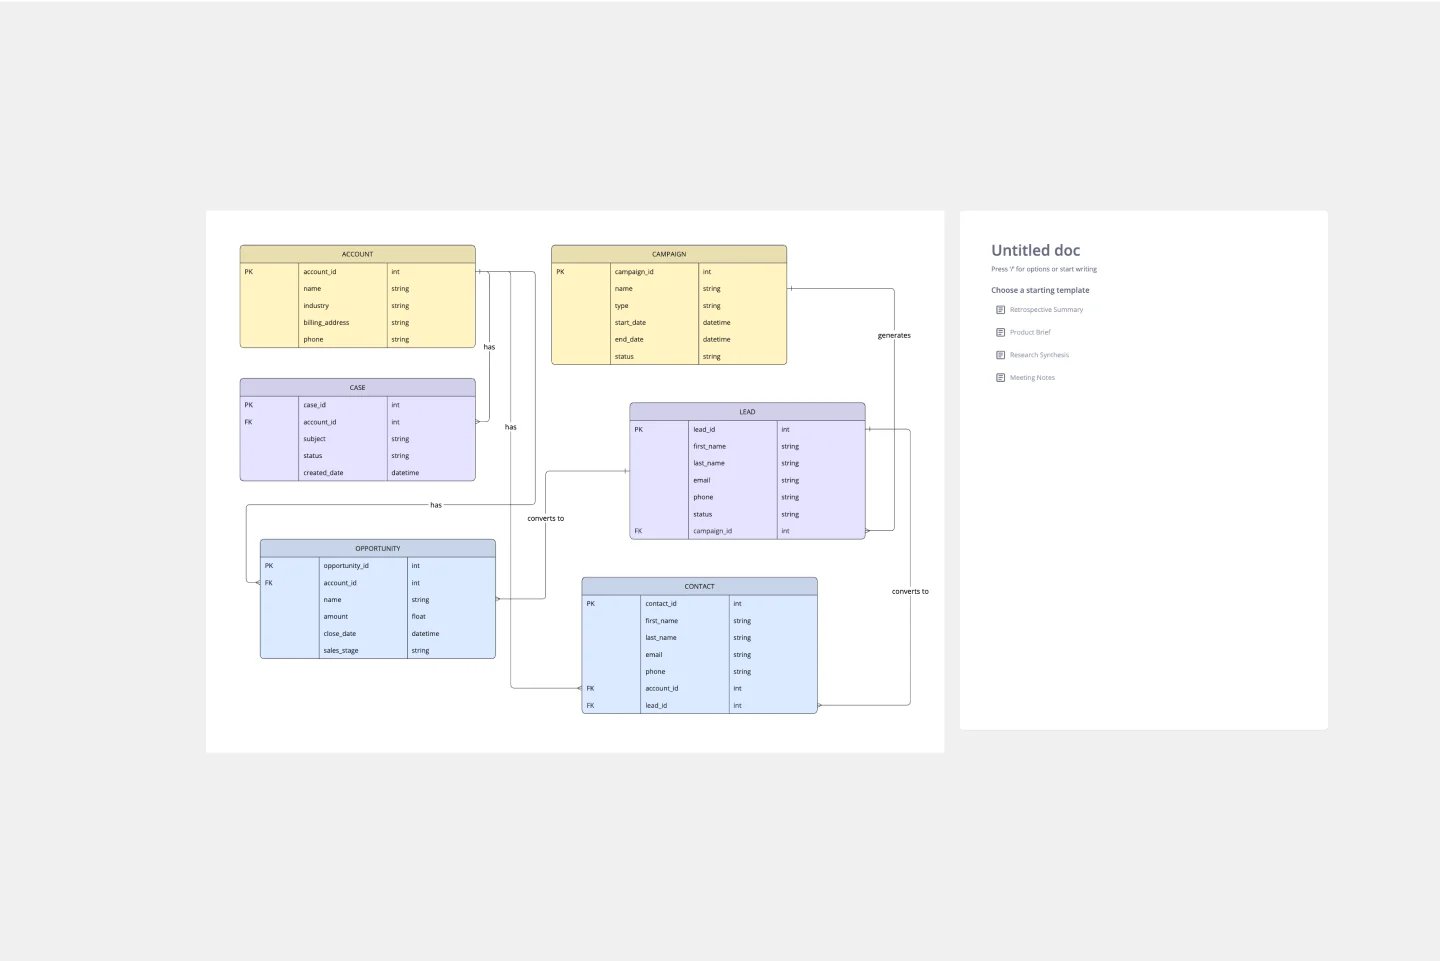
The ERD Customer Relationship Management (CRM) template streamlines and enhances the management of customer relationships within businesses. It focuses on organizing customer information and interactions in a visually intuitive manner. Key entities such as Customer, Interaction, Sales Opportunity, Product, and Support Ticket are central to the template, facilitating the tracking of customer relationships, sales funnel activities, product purchases, and customer service interactions. This structured approach is critical for boosting customer satisfaction and optimizing sales strategies, making the ERD CRM template an invaluable asset for businesses aiming to improve their CRM processes.