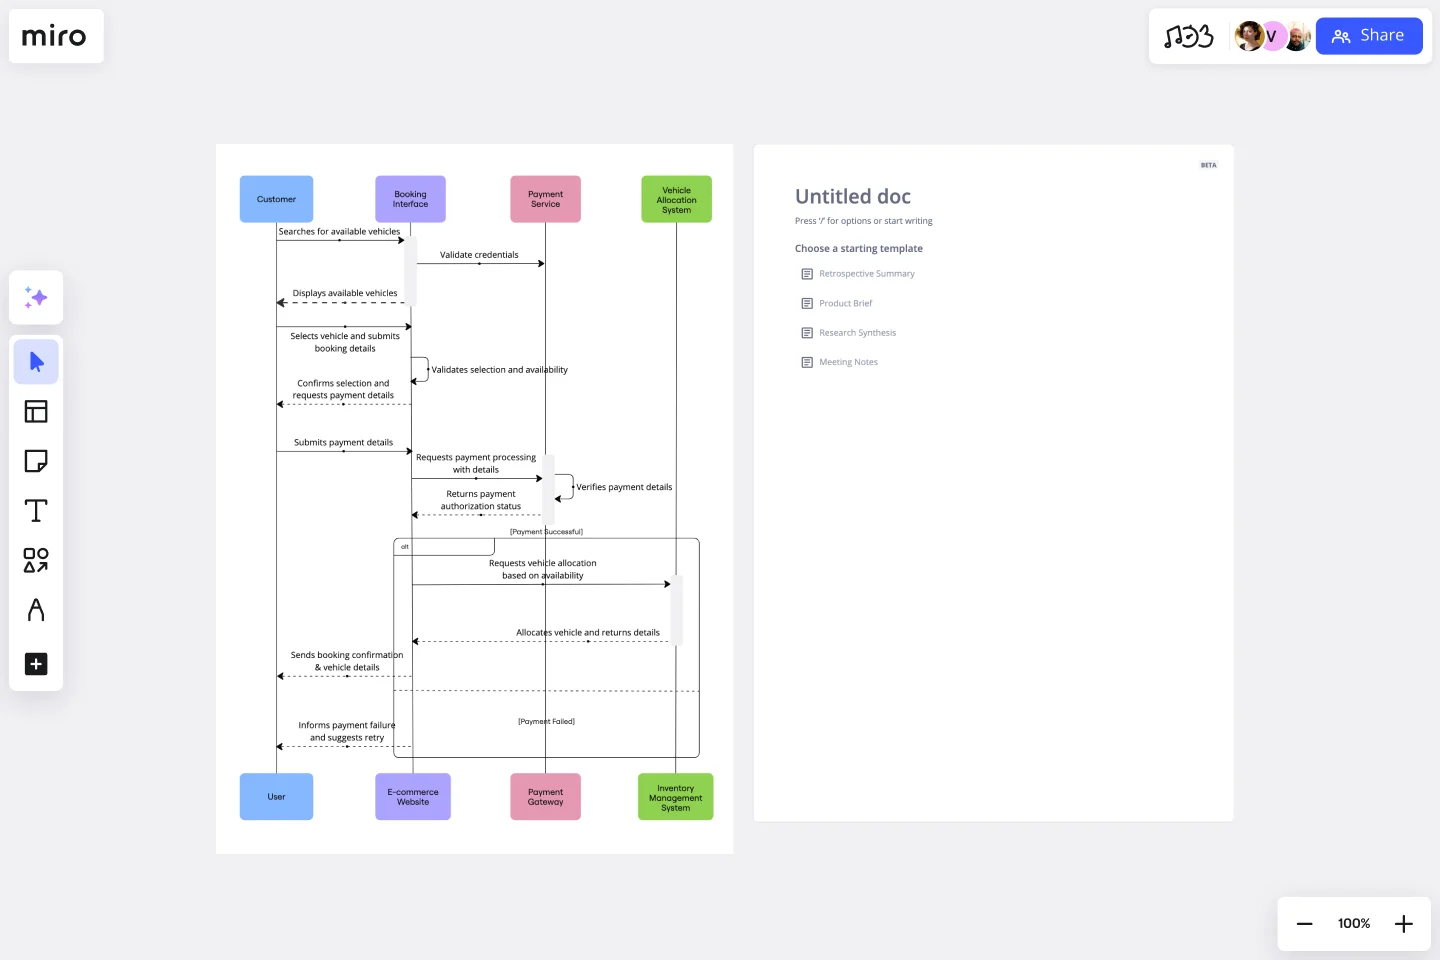
UML Sequence Rental Booking System Template
Streamline the documentation and visualization process of interactions within rental booking systems with the UML Sequence Rental Booking System Template.
Available on Enterprise, Business, Education plans.
About the UML Sequence Rental Booking System Template
The UML Sequence Rental Booking System Template in Miro is designed to streamline the process of documenting and visualizing the interactions within a car rental booking system. This template aids in mapping out the communication flow between the customer, user interface, payment service, and vehicle allocation system, ensuring a smooth and efficient workflow. By using this template, teams can understand the sequence of interactions necessary for a successful rental booking process.
How to use the UML Sequence Rental Booking System Template
Customize the template: Once the template is open on your board, you can start customizing it to fit your specific project needs. Miro allows you to add, remove, or modify the elements within the template easily. For more complex diagrams, use Miro's UML shape packs or integrate with text-to-diagram apps like PlantUML and Mermaid.
Collaborate in real time: Invite your team members to collaborate on the diagram in real-time. Miro's collaborative features enable you to work together seamlessly, regardless of your physical location. Use comments, @mentions, and live editing to gather input and make decisions efficiently.
Iterate and refine: As your project evolves, so too will your understanding of the necessary interactions within the rental booking system. Use Miro to iterate on your diagram, refining it to accurately reflect the system's architecture and flow.
Share and present: Once your diagram is complete, share it with stakeholders directly from Miro. You can also present your diagram during meetings using Miro's presentation mode, ensuring everyone is aligned on the system's design.
Why use the UML Sequence Rental Booking System Template
Clarity and understanding: The template offers a visual representation of the interactions within a rental booking system. This visual aid helps team members and stakeholders easily understand the system's flow and requirements, promoting a clear understanding of complex systems.
Efficiency: Utilizing a pre-made template saves time that would otherwise be spent on creating diagrams from scratch. This efficiency allows teams to focus more on refining the system's architecture and interactions rather than on the mechanics of diagramming.
Collaboration: Miro's collaborative environment enhances teamwork by enabling multiple users to contribute to the diagram simultaneously. This feature is especially beneficial for remote or distributed teams, as it supports real-time communication and iteration, ensuring that everyone is aligned and can contribute effectively, regardless of their location.
Get started with this template right now. Available on Enterprise, Business, Education plans.
Cause and Effect Diagram Template
Works best for:
Diagramming
The Cause and Effect Diagram Template is a useful tool for analyzing complex relationships, identifying root causes of problems, and improving organizational processes. It can be customized to fit user's unique needs and provides a structured framework for analysis. Teams can use real-time collaborative analysis on the Miro platform to drive continuous improvement initiatives.
RAID Log Template
Works best for:
Agile Methodology, Project Management, Agile Workflows
Use the RAID Log template to better understand potential risks, assumptions, issues, and dependencies relating to an upcoming project. With this information, you can make effective contingency plans and prepare your resources accordingly. You’ll know what could go wrong throughout the project and how to fix the problem.
Team Meeting Agenda Template
Works best for:
Documentation, Team Meetings, Workshops
Making the time for your team is important to help you to make decisions, align on priorities, and move in the same direction together. Team meeting agendas help add a schedule and structure to your allocated time slot when you need to share information and collaborate with your team. They also allow your team to agree on goals, talking points, action items, and who will lead the next steps. Uninterrupted team meeting time with an agenda can help your team review progress against OKRs, share updates, discuss roadblocks, and brainstorm ideas.
Org Unit Visual Guide
Works best for:
Org Charts, Operations, Mapping
Org Unit Visual Guide template offers a visual reference for understanding organizational units and their relationships. By mapping out departments, teams, and reporting lines, this template enhances clarity and transparency. With customizable features for adding annotations and descriptions, this template facilitates communication and alignment across organizational units.
DevOps Roadmap Template
Works best for:
Documentation, Product Management, Software Development
DevOps teams are constantly creating code, iterating, and pushing it live. Against this backdrop of continuous development, it can be hard to stay abreast of your projects. Use this DevOps Roadmap template to get a granular view of the product development process and how it fits into your organization's product strategy. The DevOps Roadmap lays out the development and operations initiatives you have planned in the short term, including milestones and dependencies. This easy-to-use format is easily digestible for audiences such as product, development, and IT ops.
Login Sequence Diagram Template
Works best for:
Diagramming, Technical Diagramming
The UML Sequence Login Diagram Template is a valuable tool for visualizing user authentication processes. It breaks down complex login sequences into clear, visual components, facilitating collaborative understanding among team members, regardless of their technical expertise. This shared understanding is crucial for ensuring all stakeholders, from developers to project managers, are on the same page, leading to efficient decision-making and a smoother development process. The template's ability to translate technical details into an accessible format streamlines communication and significantly reduces the likelihood of misinterpretation or oversight, making it an essential asset in any software development project.
