UML Component Diagram Template
Plan, draw, and share an object-oriented system’s elements and components using our UML component diagram template.
Available on Enterprise, Business, Education plans.
About the Component Diagram Template
Easily map out complex software systems using Miro’s fully customizable UML component diagram template. With pre-made component and interface symbols from our extensive UML shape pack, adjustable connection lines, and text boxes, you’re all set to create high-level visual overviews of anything from e-commerce systems to banking systems.
Using Miro’s component diagram template also gets you access to our powerful visual workspace — allowing you to quickly expand on the template with our automated diagramming tools and seamlessly collaborate with your team online.
We’ll walk you through how to make the most of our UML component diagram template.
How to use the component diagram template
To get started, click on the blue “Use template” button to open the component diagram template in Miro. Once you’re in, set your board up by inviting any collaborators you’d like to work on the template with. When you’re ready, follow the steps below to start filling the component diagram template out:
1. Pick a system
Decide on the system you’d like to visualize using the component diagram template — whether it’s an e-commerce system, banking system, or something else. It’s also worth aligning with your team to gather any input you might need from them to build the diagram.
2. Plot components
Once you’ve picked a system, start by visualizing its various components. The template comes with pre-made component symbols from our UML shape pack. To edit them, double-click on the pre-written text and add your own labels. For example, if you’re visualizing an e-commerce system, you might have components like “user interface,” “payment gateway,” and “product catalog.”
Need more components? Click on any component symbol to reveal blue dots on its side. Any blue dot you click on with automatically generate a connection line from that point with a matching component symbol on the other end — allowing you to quickly expand on the template.
3. Plot interfaces
The template also comes with pre-made interface symbols from our UML shape pack, with text boxes below each one. Double-click on the text boxes to replace the pre-written content with your own, allowing you to represent your system’s interfaces on the component diagram template. Going back to our e-commerce example, you might have interfaces labeled “customer interface” and “admin interface.”
4. Adjust connection lines
Use the template’s pre-made connection lines to visualize dependencies and wiring within your system. To adjust the lines, click on one to reveal two white dots on each end, and drag them until you’re happy with the position. You can use the blue dot in the middle to adjust your line’s curve.
You can also grab sticky notes or text boxes from the toolbar to give the connections some context. For example, you could add more information to the “payment gateway” component by adding a text box below it that says “handles payment processing and transactions.”
5. Customize the template
Now that you’ve visualized the key components, interfaces, and connections, it’s time to customize the component diagram template. Change colors, play with font types, and adjust the sizes of your elements — anything that might make your diagram easier to understand, or simply make it your own.
You could even change the styles of your connection lines for some visual differentiation between them. Just click on a connection line to reveal the pop-up menu, then click on “Type” to edit your line style.
6. Share the diagram
Get feedback on your completed component diagram template by inviting your team to view and comment on your Miro board. You can also export it as a PDF or image, generate a shareable link, or embed your Miro board on other sites.
Prefer to build your component diagram from scratch? Use Miro's UML component diagram tool and get access to our extensive UML shape pack.
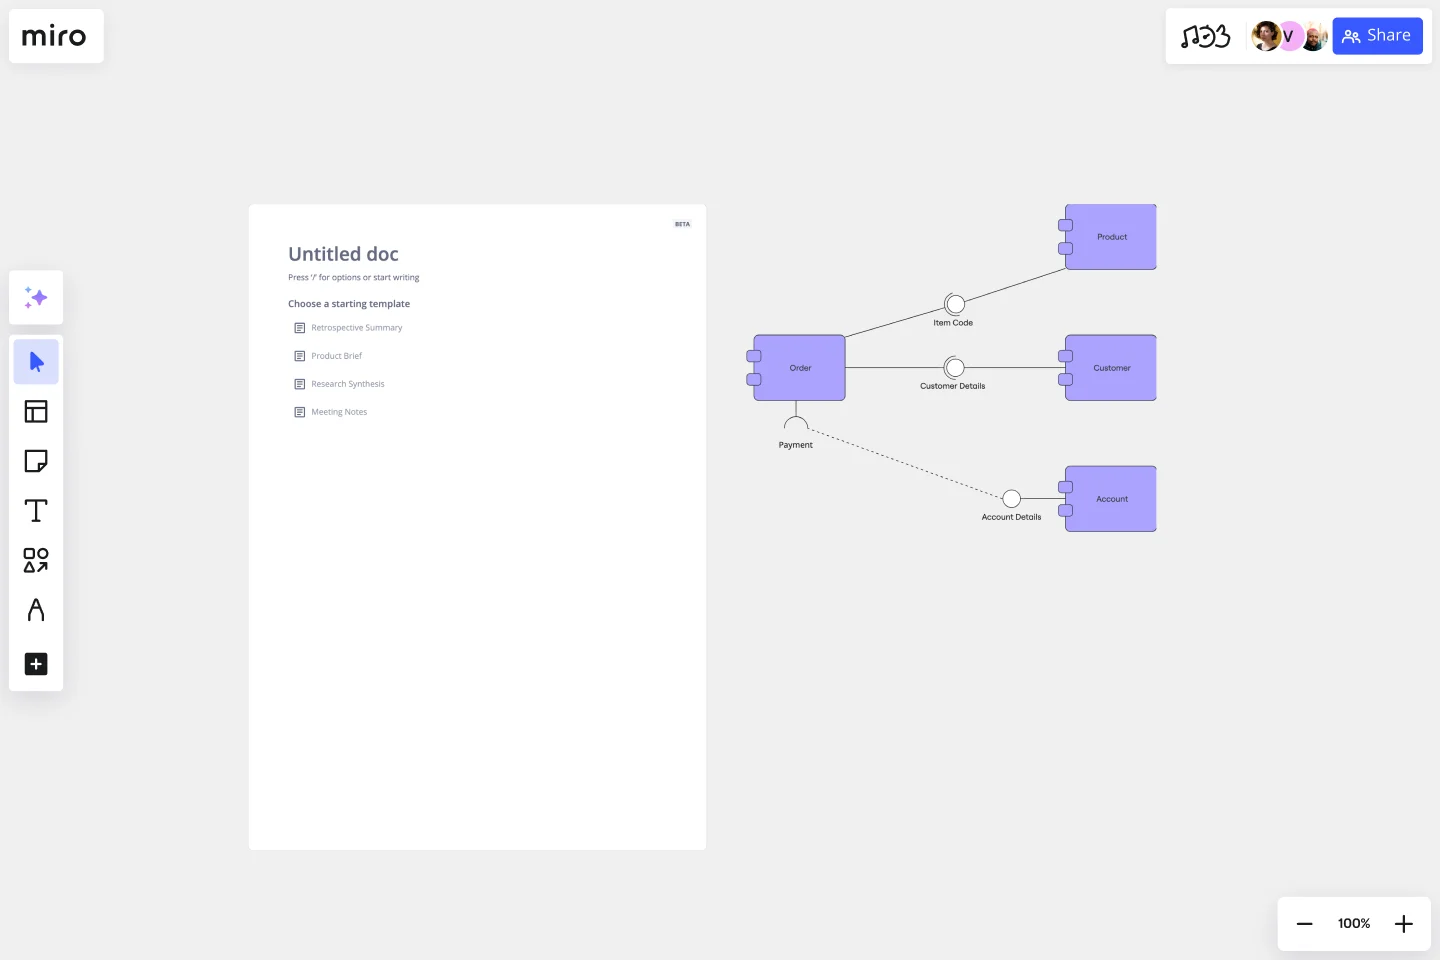
Component diagram example: e-commerce website
Let’s take a look at an example of a component diagram depicting an e-commerce website. In this case, you’d make sure the component diagram template illustrates all the physical components and artifacts that make up an e-commerce system. Here are some components you’d include:
Suppliers
Components labeled “suppliers” might refer to warehouses that stock and re-sell goods or fulfill physical orders. It could also include production facilities, like factories and workshops. Supplier components typically connect to transportation, logistics, manufacturing, and other adjacent components.
Goods
Physical goods are another common component of a diagram representing an e-commerce website. You could visualize them independently of other components, or visualize them as part of a factory, a store, or a warehouse.
The receiving customer
Since the receiving customer is a physical entity too, it’s worth representing them on the component diagram template. Though you’d likely separate them from the rest of your components since they only interact with the system and aren’t actually part of it.
When should I use a UML component diagram?
A UML component diagram shows the components and artifacts in a system and the structural relationship between these components and artifacts. You can use component diagrams to plan, create, and optimize system components at a high level — in software development, business process planning, and other complex processes across digital and business.
Can I collaborate with others on the UML component diagram template?
Yes, Miro brings teams together — whether you’re working remotely or in person. Invite your team to edit your Miro board with you in real-time or async — or get instant feedback by inviting them to view and comment on the component diagram template. You can also run live and interactive presentations right from your Miro board using Use Presentation Mode, or use TalkTrack to record immersive audio and video walkthroughs your team can watch in their own time.
Does Miro offer a shape pack for UML diagramming?
Yes, Miro offers plenty of specialized shape packs, including a UML shape pack — allowing you to fill out the component diagram template with industry-standard symbols. Get access to our UML shape pack with a Business, Enterprise, or Education plan.
Get started with this template right now. Available on Enterprise, Business, Education plans.
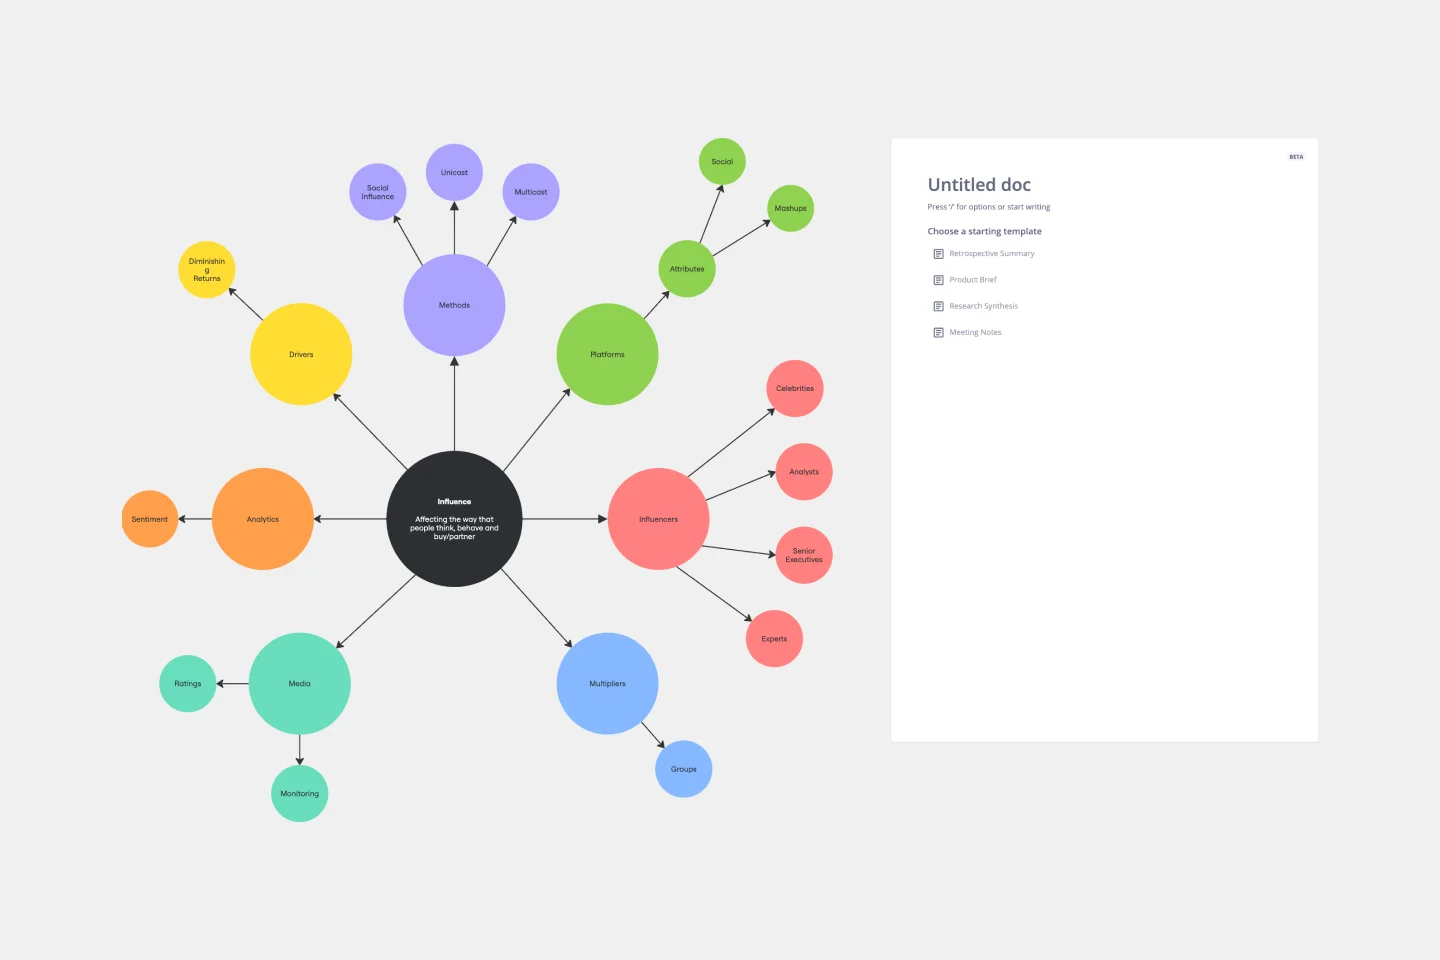
Cluster Diagram Template
Works best for:
Diagramming
The Cluster Diagram Template is a valuable tool for organizing and connecting ideas, concepts, and information in a visually compelling and coherent manner. The template's design centers on grouping related ideas around a core concept, creating a transparent and hierarchical structure. This clustering not only aids in breaking down complex information into manageable segments but also significantly enhances the process of idea generation and brainstorming. A structured yet flexible visual framework encourages deeper engagement and more precise understanding, making it an essential asset for teams and people looking to bring order to their creative and analytical processes.

Miro x AWS: Accelerate your cloud journey
Works best for:
Diagramming
The Miro x AWS: Accelerate your cloud journey template offers a visual framework for planning and executing cloud migration and optimization projects using Amazon Web Services (AWS). It provides elements for mapping out cloud architectures, migration strategies, and cost optimization initiatives. This template enables teams to collaborate effectively, align on objectives, and accelerate their cloud journey with AWS services. By promoting collaboration and alignment, the Miro x AWS template empowers organizations to leverage AWS cloud technologies efficiently and achieve their business objectives effectively.
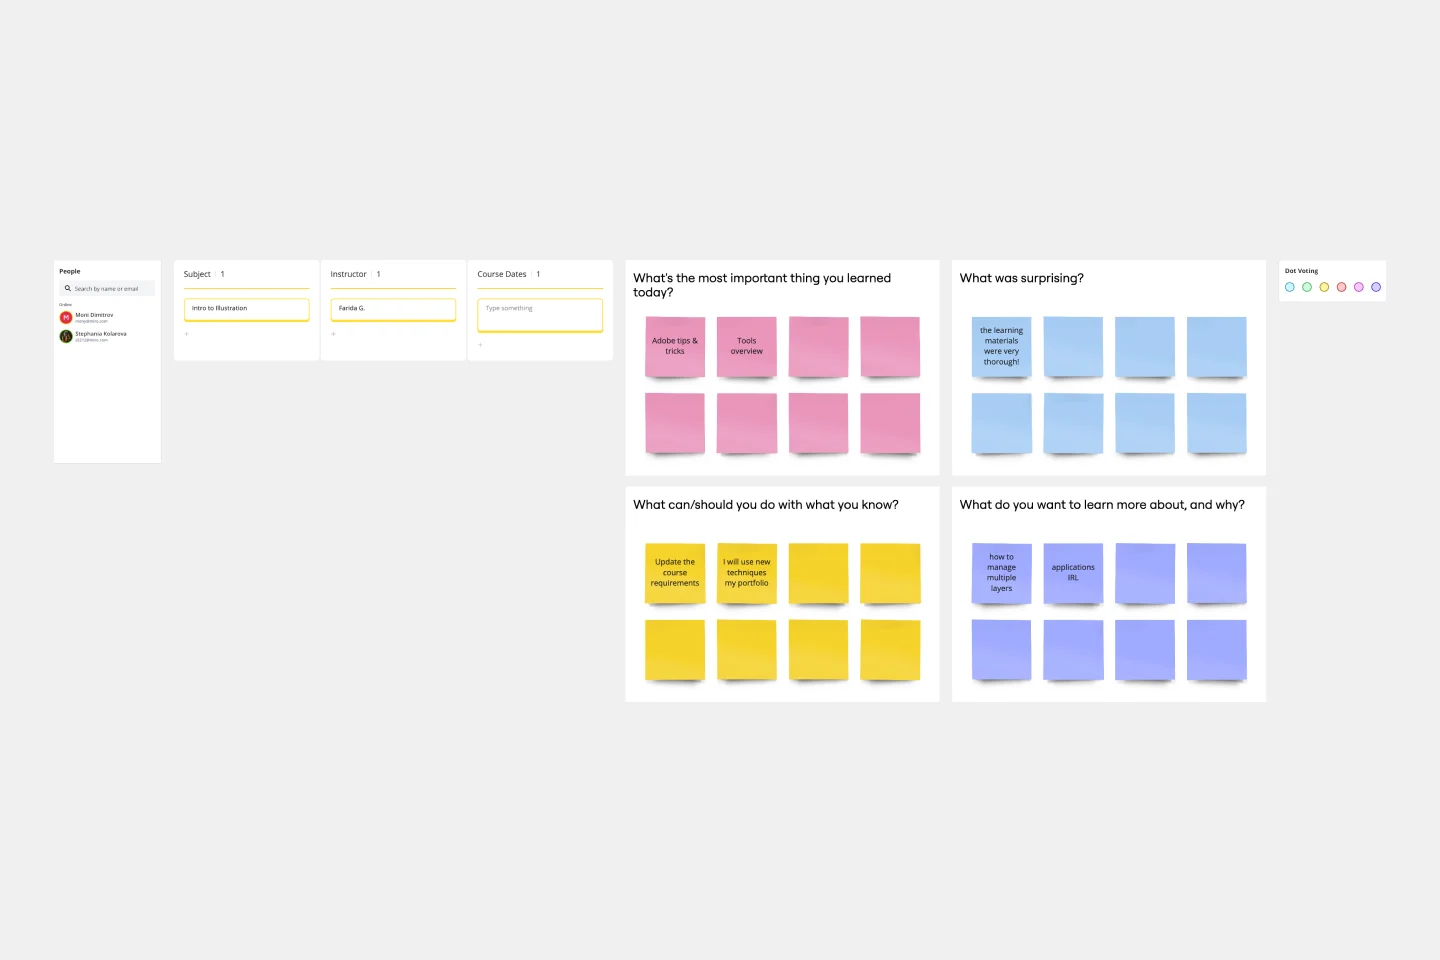
Lesson Reflection Template
Works best for:
Education, Meetings
The Lesson Reflection template is a tool to create space for self-reflection and improvement. Students can evaluate the key takeaways from a lesson and what are the topics they find most interesting. As teachers receive the student’s Lesson Reflection, they can look for opportunities to improve learning and teaching methodologies. The Lesson Reflection template can help you facilitate the educational process, and it’s easy to use and straightforward.
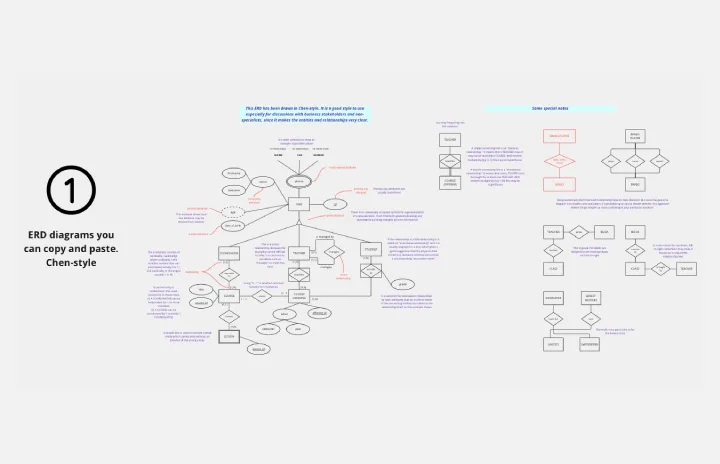
UML ERD Diagram
Works best for:
Diagramming, UML Diagram
This template contains a few Entity-Relationship diagrams that you can re-use for your own work.
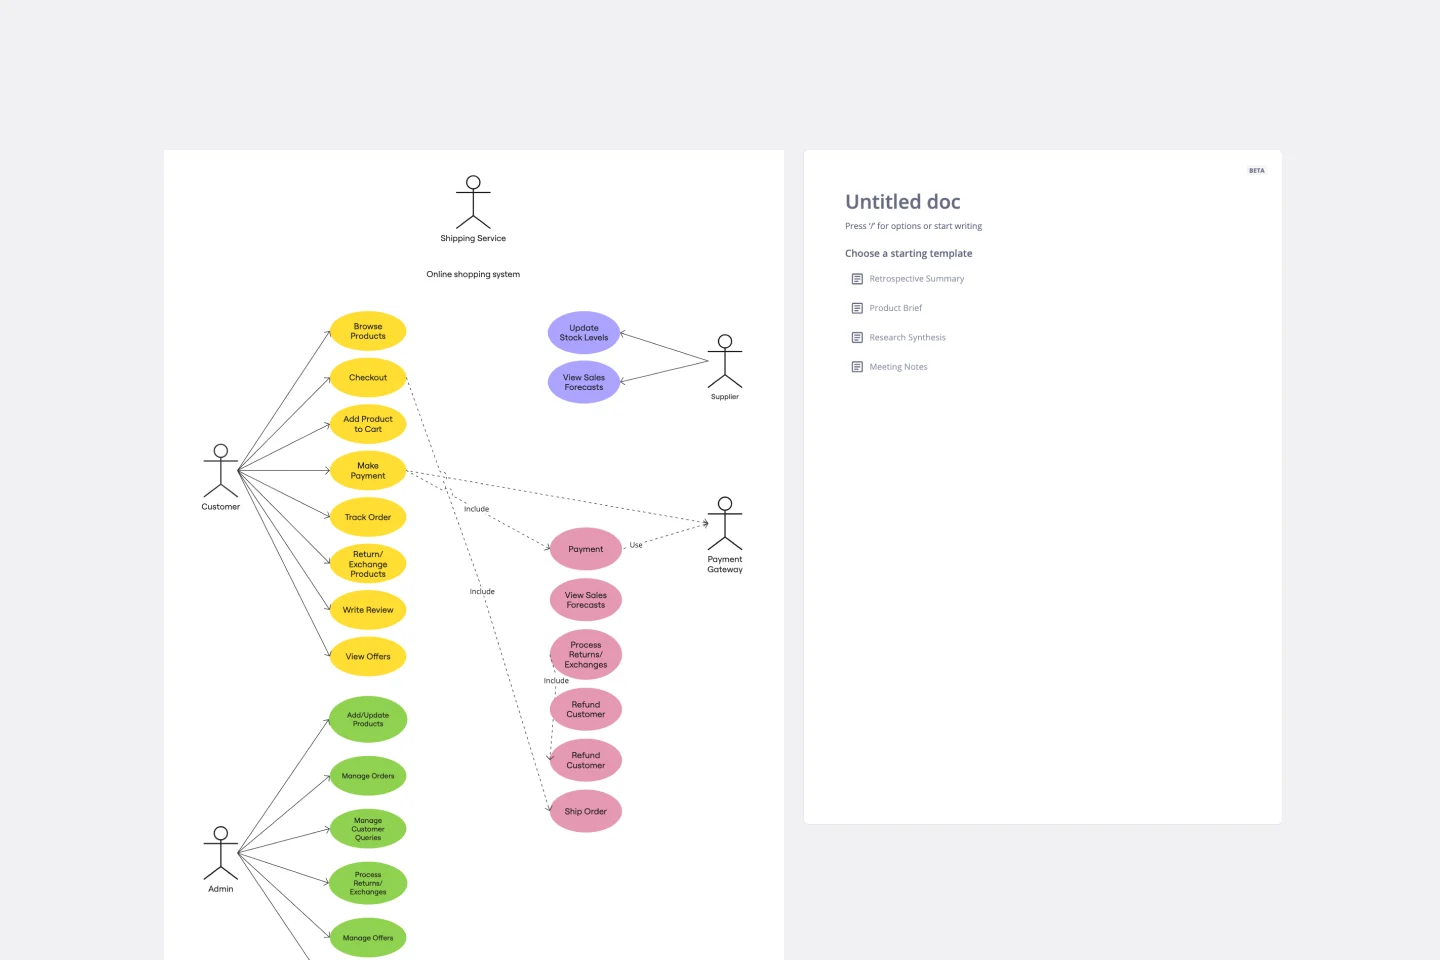
UML Use Case Online Shopping System Template
Works best for:
UML
The Online Shopping System Template simplifies the process of documenting and visualizing how users interact with an online shopping system. It provides a standard way to map out user interactions, such as product listings, inventory management, shopping carts, order processing, payments, and shipping details. By using this template, teams can collaborate effectively in real-time or at different times, adjusting the diagram to meet their project's specific needs. This not only improves clarity and efficiency but also fosters better communication among team members and stakeholders, ensuring a thorough understanding of the system's design and requirements.
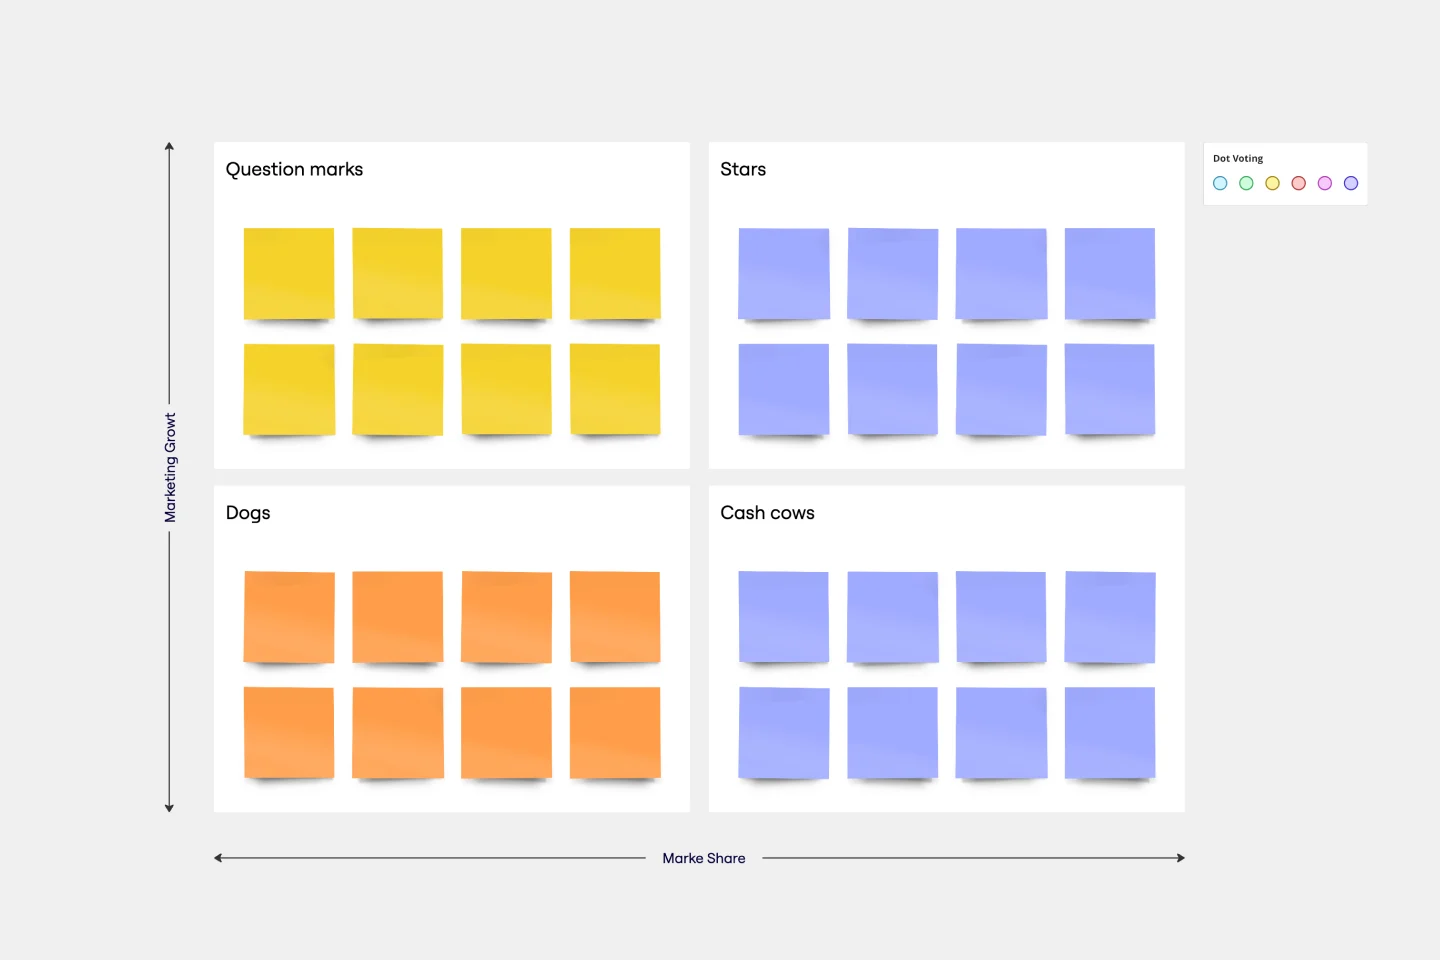
BCG Matrix Template
Works best for:
Strategic Planning
Use the BCG matrix template to make informed and strategic decisions about growth opportunities for your business. Assign your portfolio of products to different areas within the matrix (cash cows, dogs, question marks, stars) to prioritize where you should invest your time and money to see the best results.