UML Class Diagram by Dmitry Ermakov
A UML (Unified Modeling Language) Class diagram is a visual representation that shows the structure and relationships of classes in a system or software application.
It provides an overview of the objects or entities in the system, their attributes (data), and their relationships with other classes.
In simple terms, you can think of a UML Class diagram as a blueprint or a map that helps you understand how different parts of a system or program are connected. It shows the building blocks of the system (classes) and how they interact with each other.
What to pay attention to
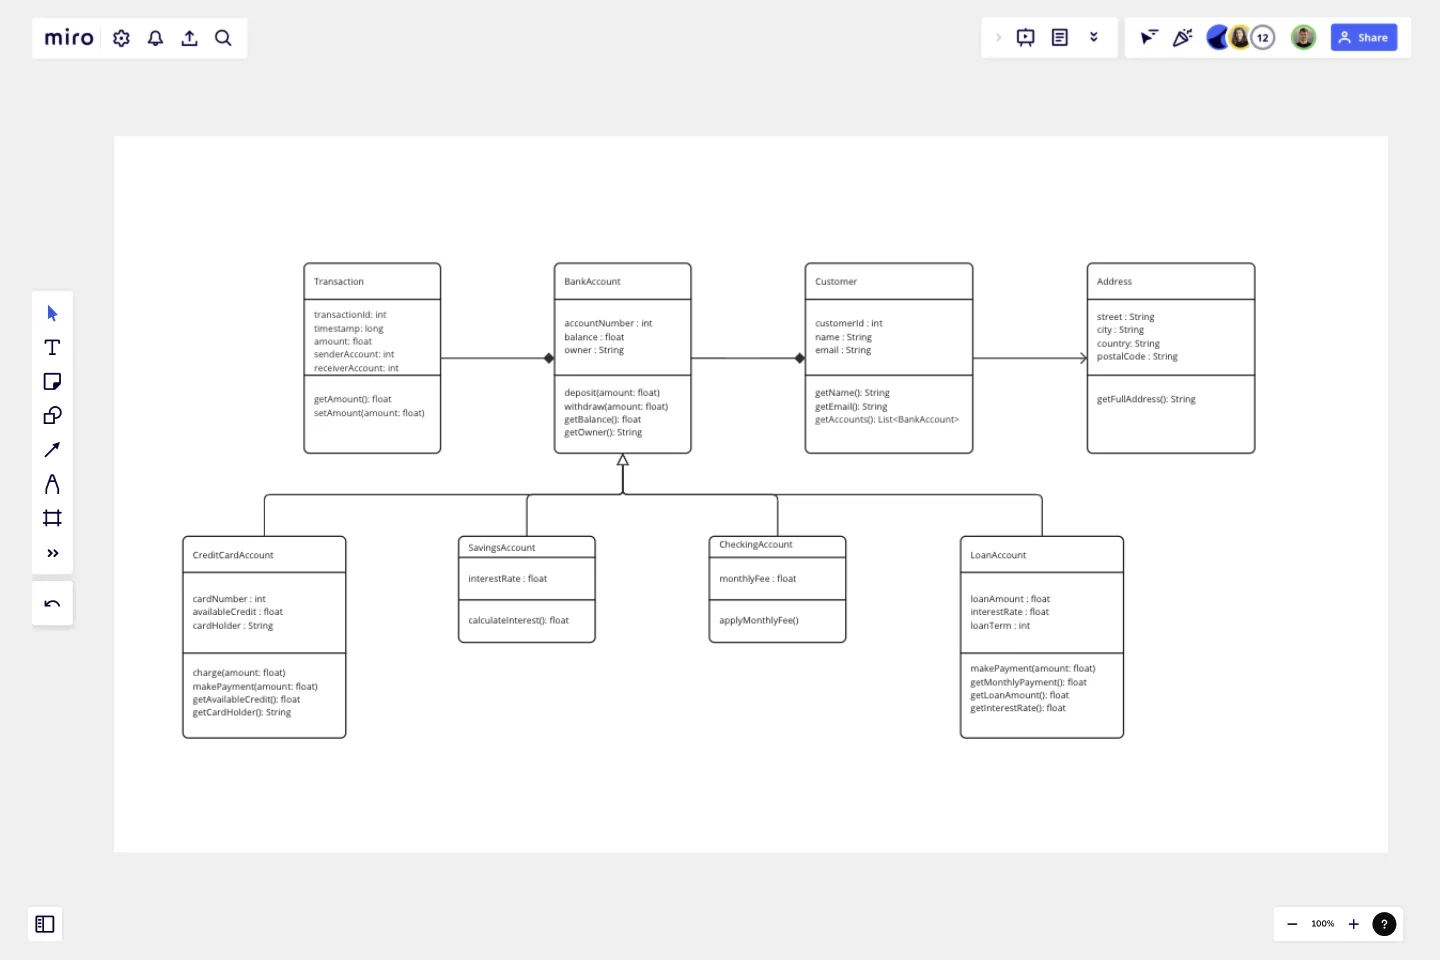
In a Class diagram, each class is represented as a box with three sections:
The top section contains the class name.
The middle section lists the attributes or properties of the class.
The bottom section shows the methods or behaviors that the class can perform.
The relationships between classes are represented by lines connecting the boxes. These relationships can include associations (connections between classes), generalization or inheritance (when one class inherits from another), aggregation or composition (when one class contains or is composed of another), and more.
Who this template is for
Overall, a UML Class diagram helps developers, designers, and stakeholders visualize and understand the structure of a system, the interactions between classes, and the behavior of objects within the system. It serves as a powerful communication tool for discussing, designing, and documenting software systems.
How to use a template
Use a template by adding it to a new or an exiting Miro board, and follow the intsructions on the board.
This template was created by Dmitry Ermakov.
Get started with this template right now.
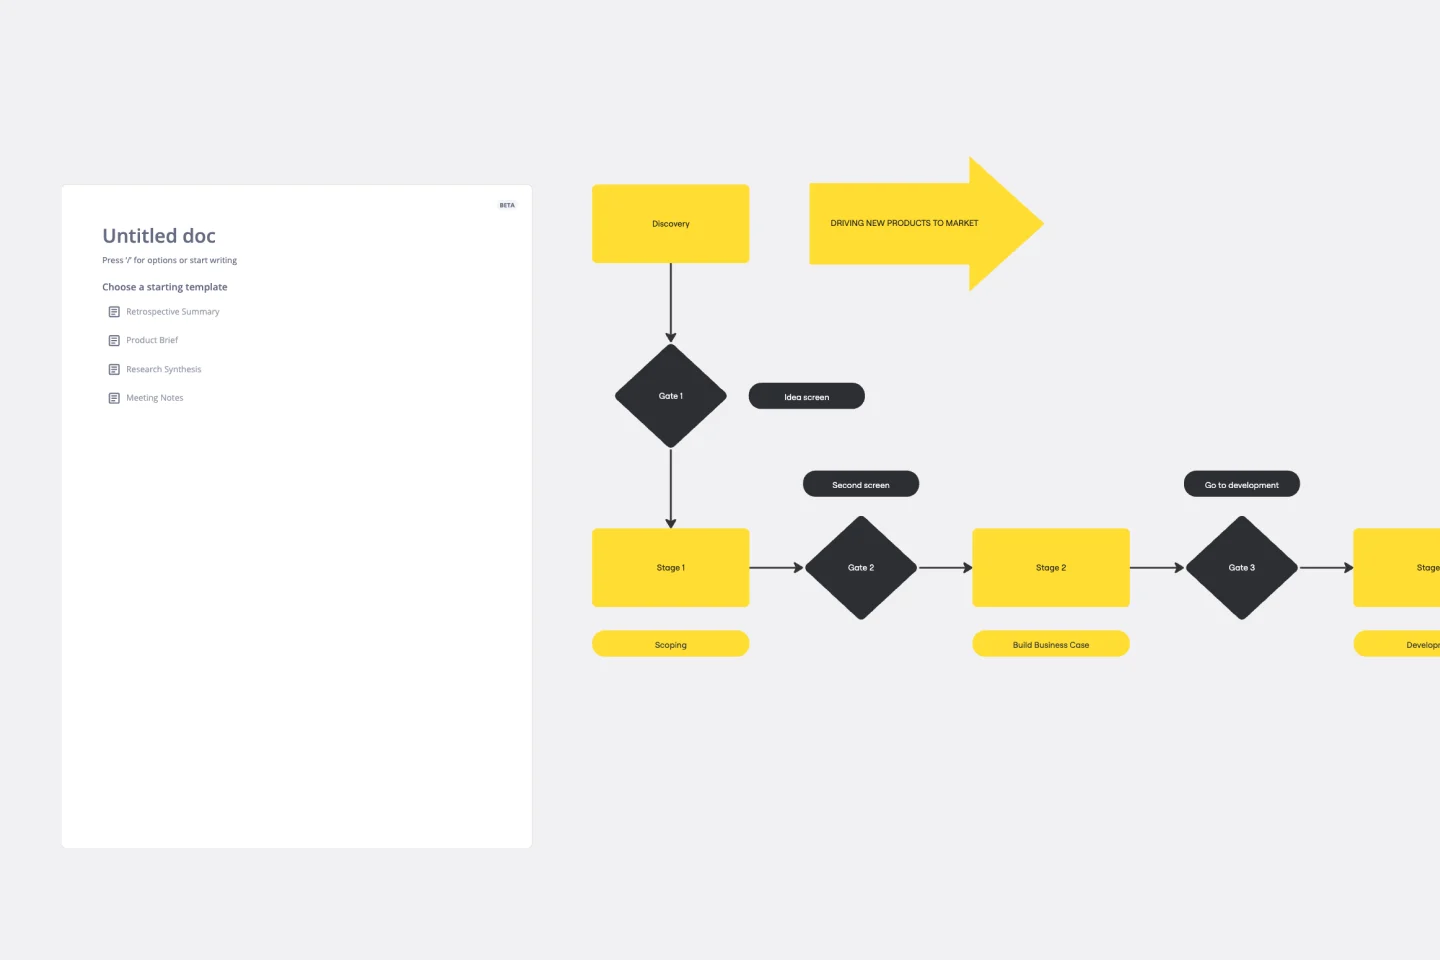
Stage-Gate Process Flowchart Template
Works best for:
Diagramming, Project Management
The Stage-Gate Process Flowchart Template structures a project into distinct stages separated by decision-making gates, enhancing the quality of decisions and leading to more successful project outcomes.
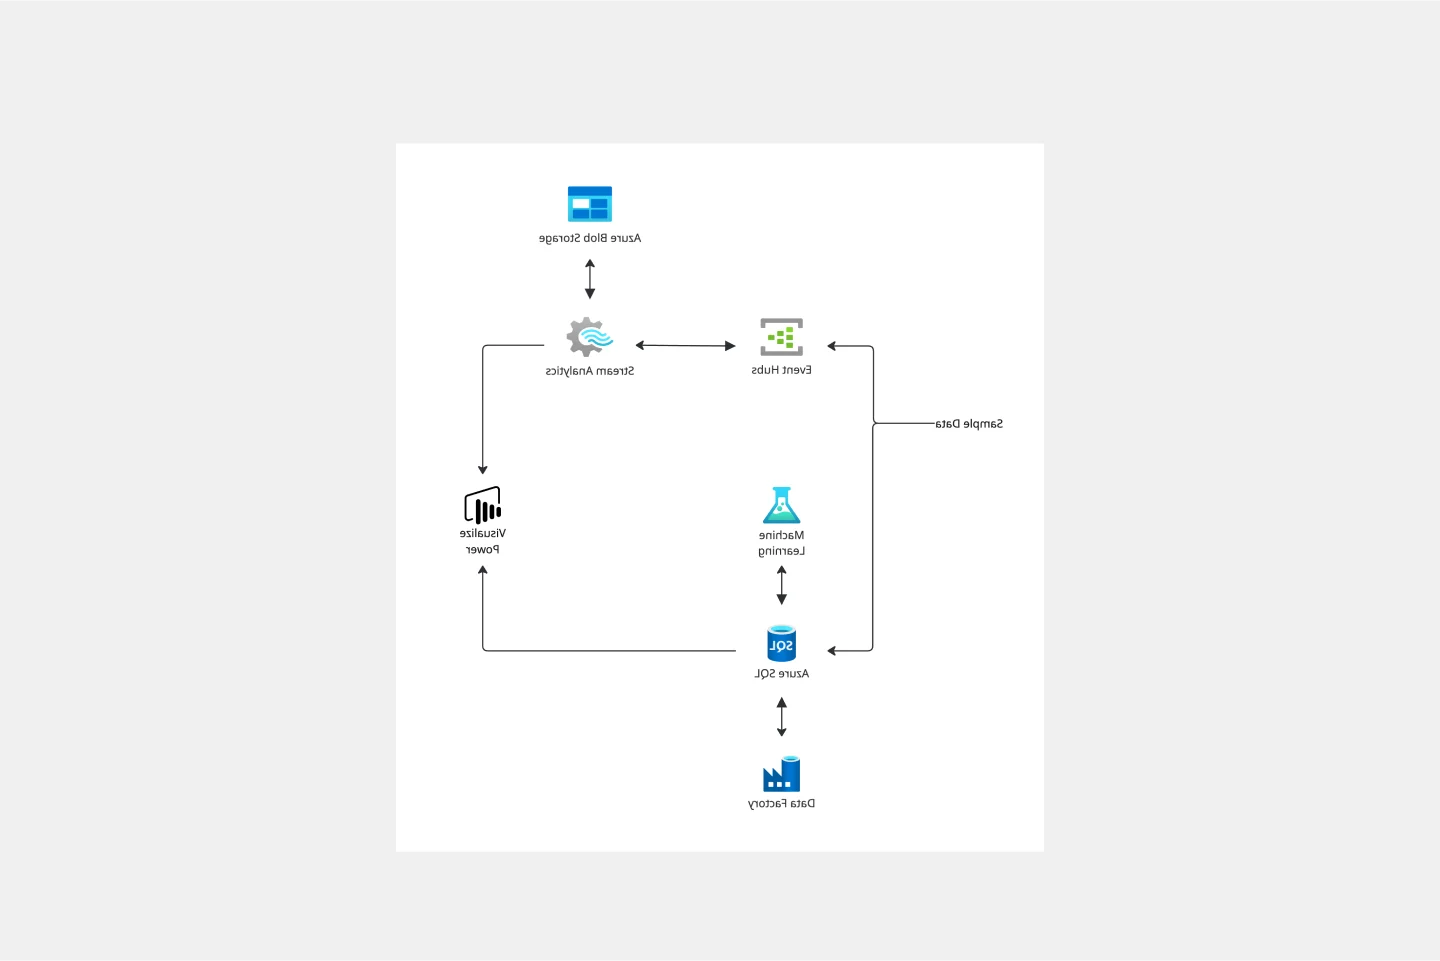
Azure Demand Forecasting Template
Works best for:
Software Development, Diagrams
The Azure Demand Forecasting diagram will show the architecture of a demand forecast, making it easier for you to predict data consumption, costs, and forecast results. Azure is Microsoft’s cloud computing platform, designed to provide cloud-based services such as remote storage, database hosting, and centralized account management. Azure also offers new capabilities like AI and the Internet of Things (IoT).
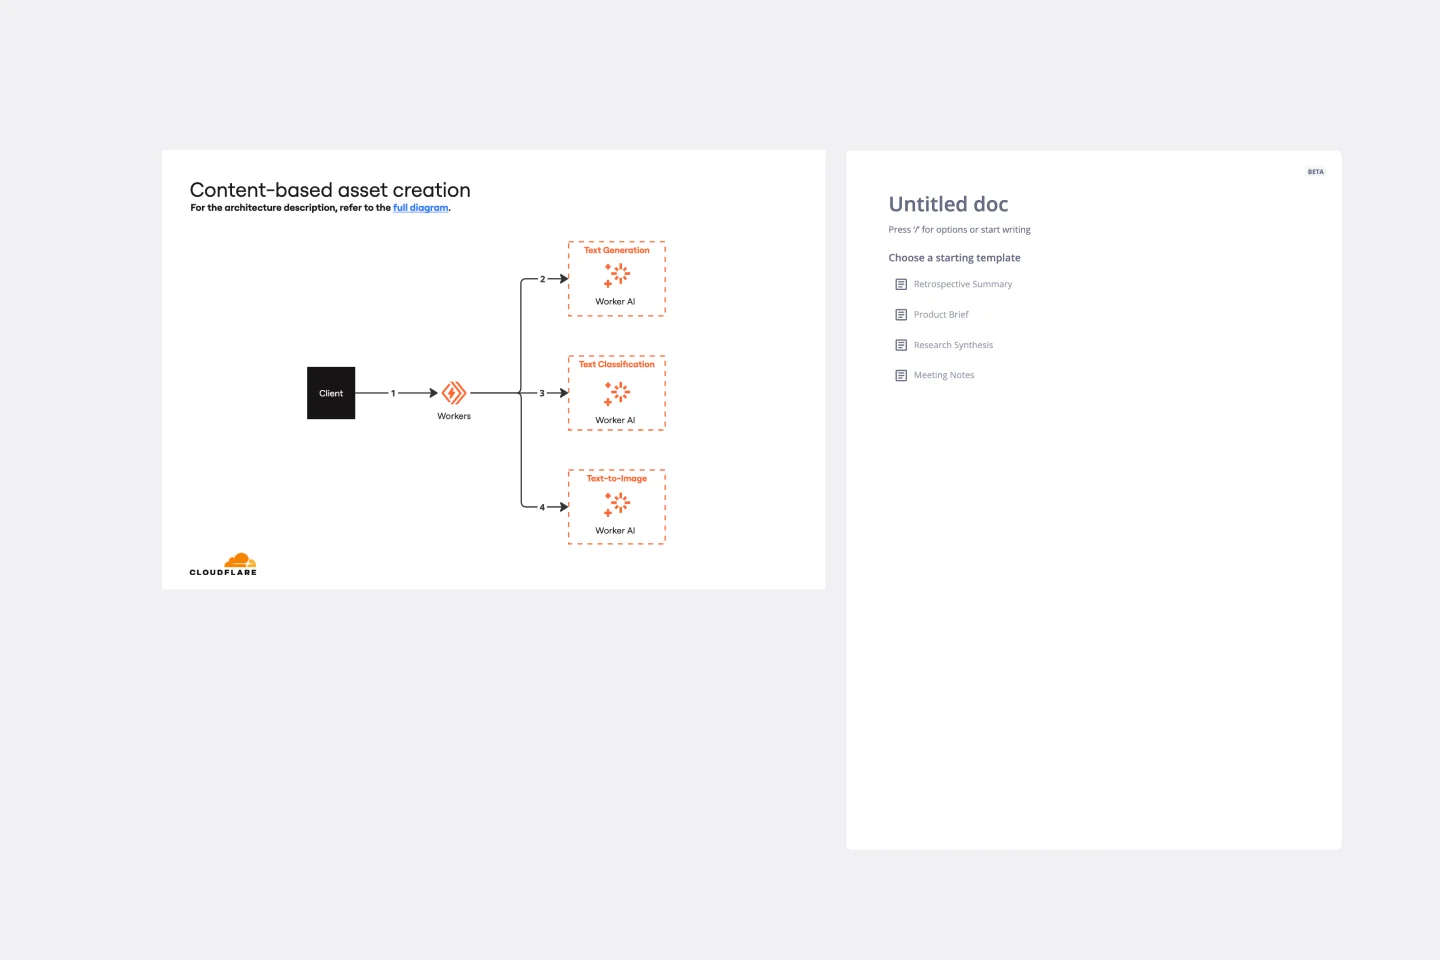
Cloudflare Content-based Asset Creation Template
The Cloudflare Content-based Asset Creation Template enhances efficiency and collaboration within teams working on cloud infrastructure projects. This template provides a structured and intuitive framework for creating and managing digital assets, which streamlines the asset creation process.
UML Sequence Registration Process Template
Works best for:
UML
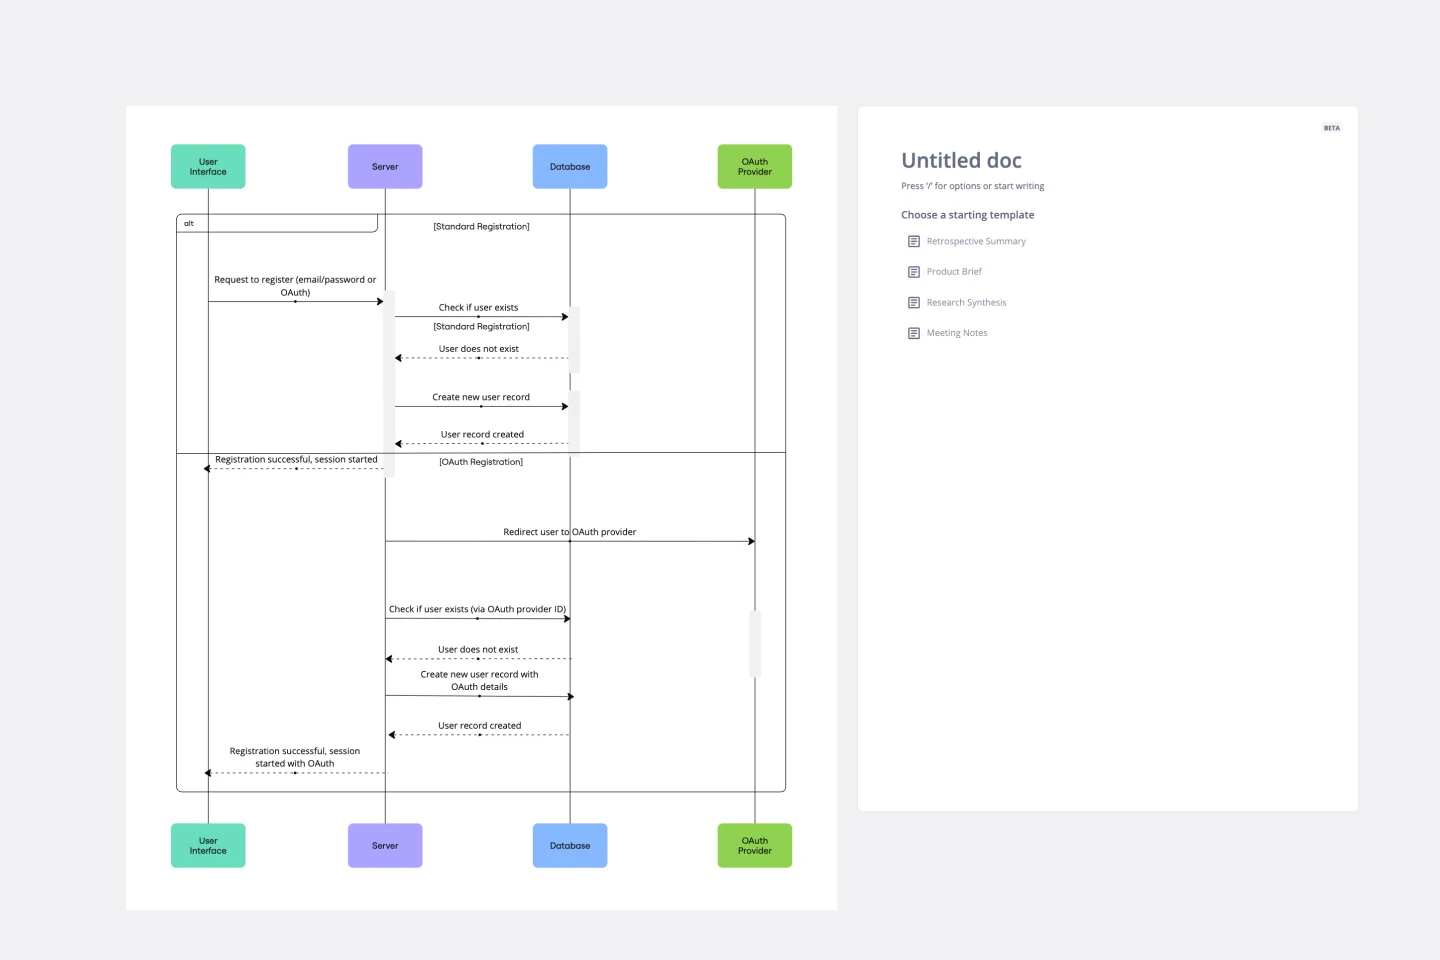
The UML Sequence Registration Process Template helps visualize and document user registration processes. It enables the rapid creation of sequence diagrams, which are crucial for enhancing clarity and identifying potential issues early in the design phase. This template not only supports collaborative efforts through Miro's platform, facilitating real-time teamwork, but also ensures a comprehensive system design. Being part of a broader collection of UML diagram templates, it stands as a valuable asset for projects involving registration workflows, contributing to streamlined project execution and effective communication among team members.
UML Sequence E-commerce Checkout Template
Works best for:
UML
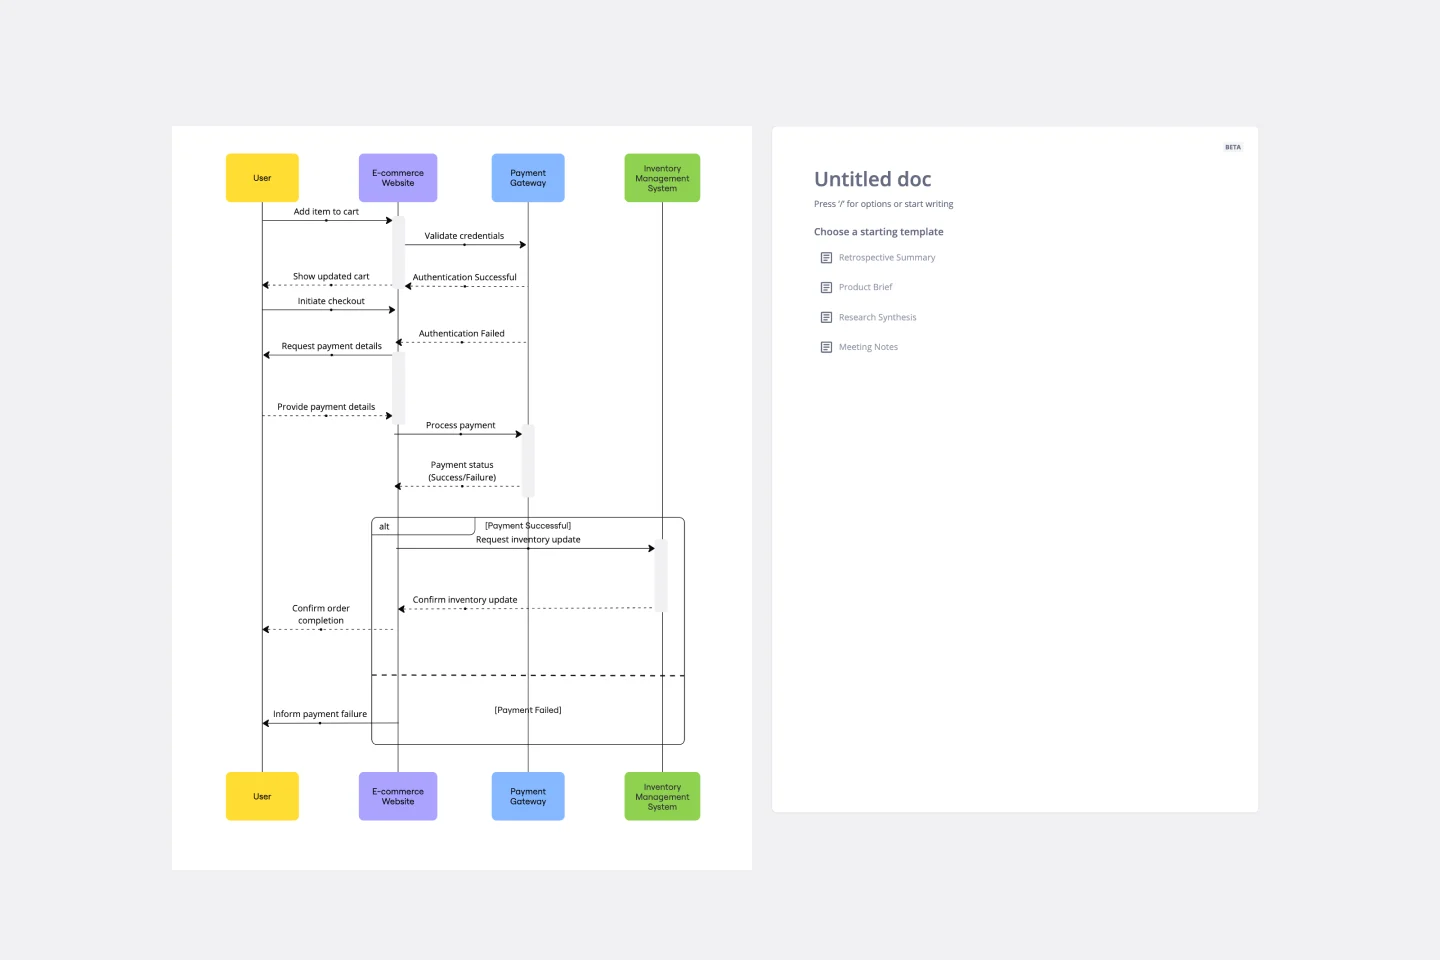
The UML Sequence E-commerce Checkout Template in Miro is a versatile tool for visualizing and analyzing e-commerce checkout processes. It provides a step-by-step visual representation of system interactions, is highly customizable, supports real-time collaboration, and is suitable for various e-commerce platforms. It serves as an efficient documentation tool, fosters team collaboration, and contributes to a more streamlined checkout experience for customers.
Value Stream Mapping Template
Works best for:
Project Management, Strategic Planning, Mapping
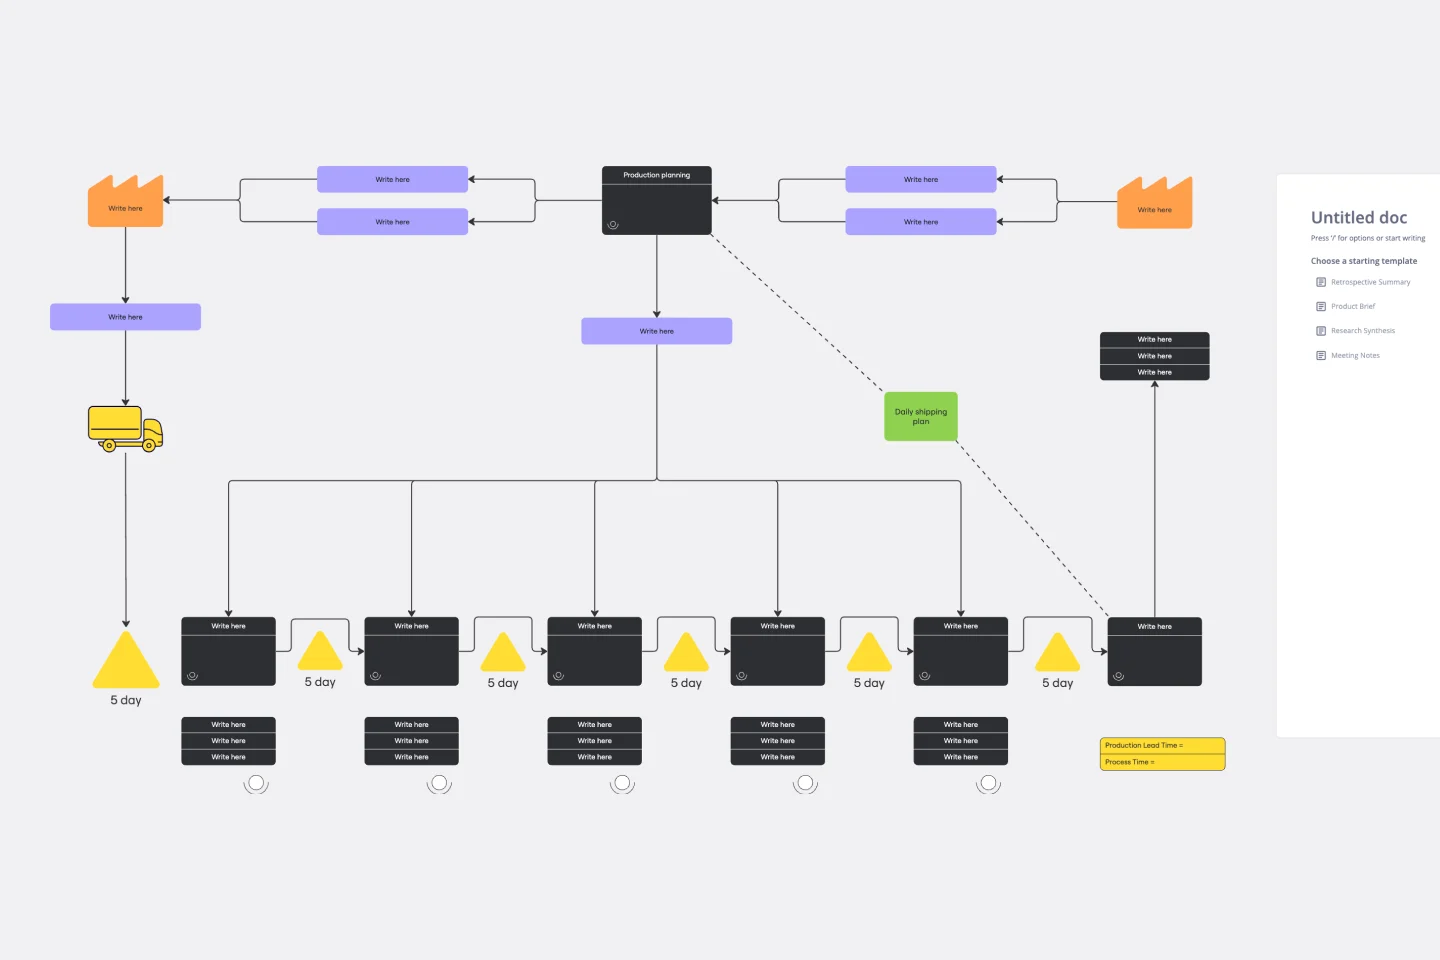
A value stream map can help you refocus your business on steps that actually provide value to your customers, cutting out wasteful and inefficient processes. With this template, you and your process team can collaborate on a value stream map today.