Turtle Diagram Template
Visualize complex processes, align team understanding, and optimize for operational excellence with the turtle diagram template.
About the Turtle Diagram Template
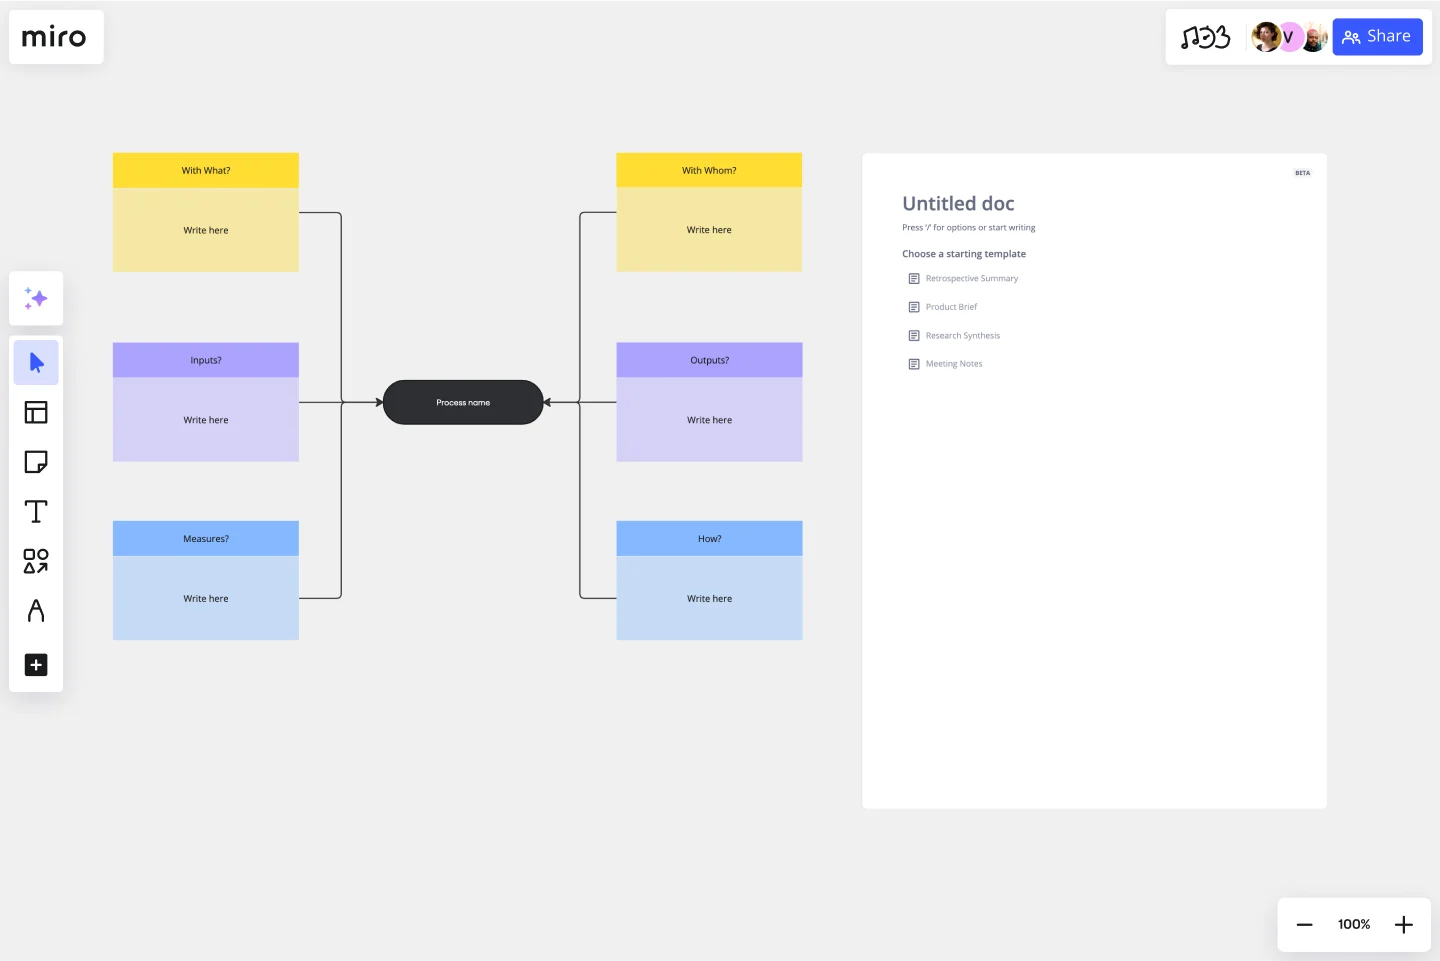
The Turtle Diagram Template is a valuable asset for visualizing processes in a structured and clear format. It's designed to study and organize the various components of a process into distinct, easy-to-understand parts, mirroring the anatomy of a turtle to help in visualization and analysis. Here's a breakdown of each section of the template:
With What: This section explores the tools, materials, and resources needed to complete the process. It's where the necessary equipment or software is identified.
With Whom: Identifies the personnel or roles responsible for executing the process. It could include specific teams, departments, or external partners.
Inputs: Lists the elements required to start the process. These catalysts drive the process forward, such as raw data, materials, or initial requests.
Outputs: Describes the end results or products that emerge from the process. These are the deliverables or outcomes that are expected once the process is complete.
Measures: Outlines the metrics or KPIs used to evaluate the success of the process. It includes the standards and criteria that the outputs are measured against.
How: Explains the methodologies, procedures, and instructions involved in the process. This section provides a step-by-step narrative of how the process is executed, including any methods or best practices that are followed.
By breaking down the process into these key components, the Turtle Diagram Template offers an in-depth understanding of how a process is built and how it should operate, paving the way for more efficient process management and continuous improvement.
How to use the turtle diagram template in Miro
To use the Turtle Diagram Template effectively:
Customize each section: Input data specific to your process into various template sections by double-clicking the text boxes.
Edit effortlessly: Change the diagram through intuitive drag-and-drop features, allowing seamless adjustments to suit your process depth.
Expand and connect: Use automated diagramming capabilities to expand your template and for a more detailed process network.
Enrich with artifacts: Drag and drop various artifacts onto your board, such as images and documents, for a richer contextual understanding of the process.
Why should you use a turtle diagram template?
Clarified process understanding: Breaks down complex processes into manageable parts for better clarity.
Enhanced communication: Simplifies the conveyance of process intricacies across teams and stakeholders.
Effective training resource: Acts as an educational tool for training new employees on existing processes.
Continuous improvement: Identifies areas for improvement by highlighting inefficiencies or bottlenecks within a process.
Compliance and documentation: Aids in meeting quality standards and regulatory requirements by providing clear documentation of processes.
If you prefer to start from scratch, Miro's diagram maker is easy to use and comes with a wide range of diagramming shapes in Miro's extensive library, so you'll find just what you need.
Can the turtle diagram template handle multiple processes at once?
While it's designed to map out individual processes for clarity, users can link multiple turtle diagrams to represent larger, interconnected systems.
Is previous knowledge required to use the Turtle Diagram Template?
No previous knowledge is necessary. The template is designed for ease of use, allowing anyone with a basic understanding of their process to begin mapping immediately.
How detailed can the input and output sections of the diagram be?
The input and output sections can be as detailed as required. Users have the flexibility to expand these sections to include all relevant details, ensuring a comprehensive process overview.
Are turtle diagram templates suitable for any industry?
Yes, these templates are versatile and can be adapted to suit the needs of any industry that benefits from detailed process analysis and quality management.
Get started with this template right now.
Cycle Diagram Template
Works best for:
Diagramming
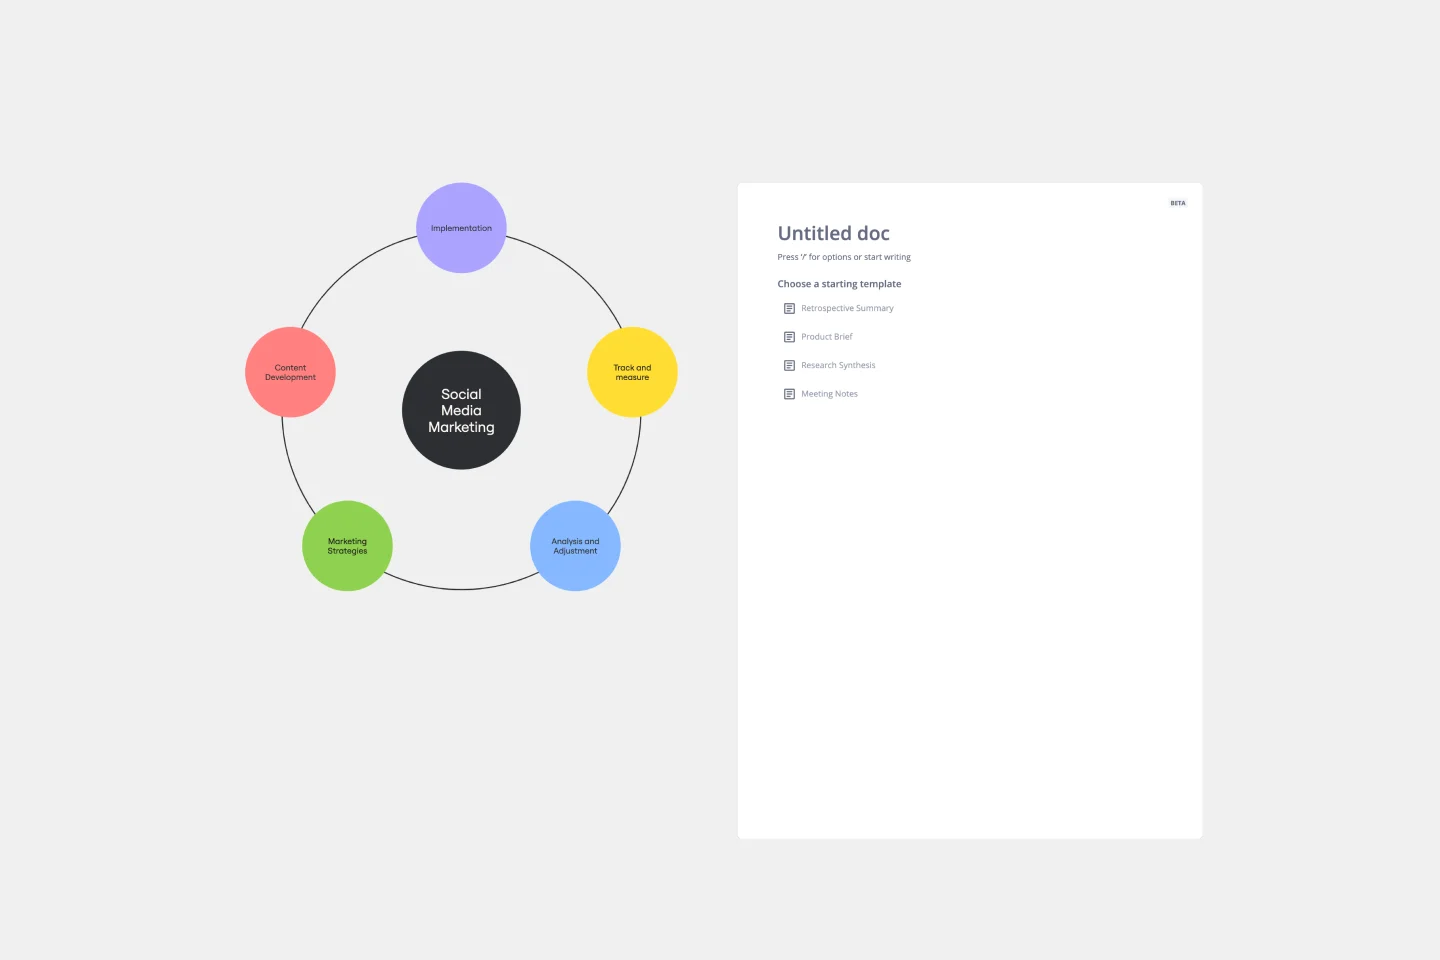
The cycle diagram template empowers professionals to visually represent complex cycles with precision and clarity. This template maps out cyclical processes, relationships, or events, ensuring that complex concepts are communicated seamlessly. One key benefit that sets this template apart is its ability to streamline communication and enhance understanding. By crafting visually appealing cycle diagrams, professionals can distill complex information into a clear visual language, making it easier for teams and stakeholders to grasp complex relationships. This ultimately fosters more effective collaboration and decision-making.
Driver Diagram Template
Works best for:
Diagramming
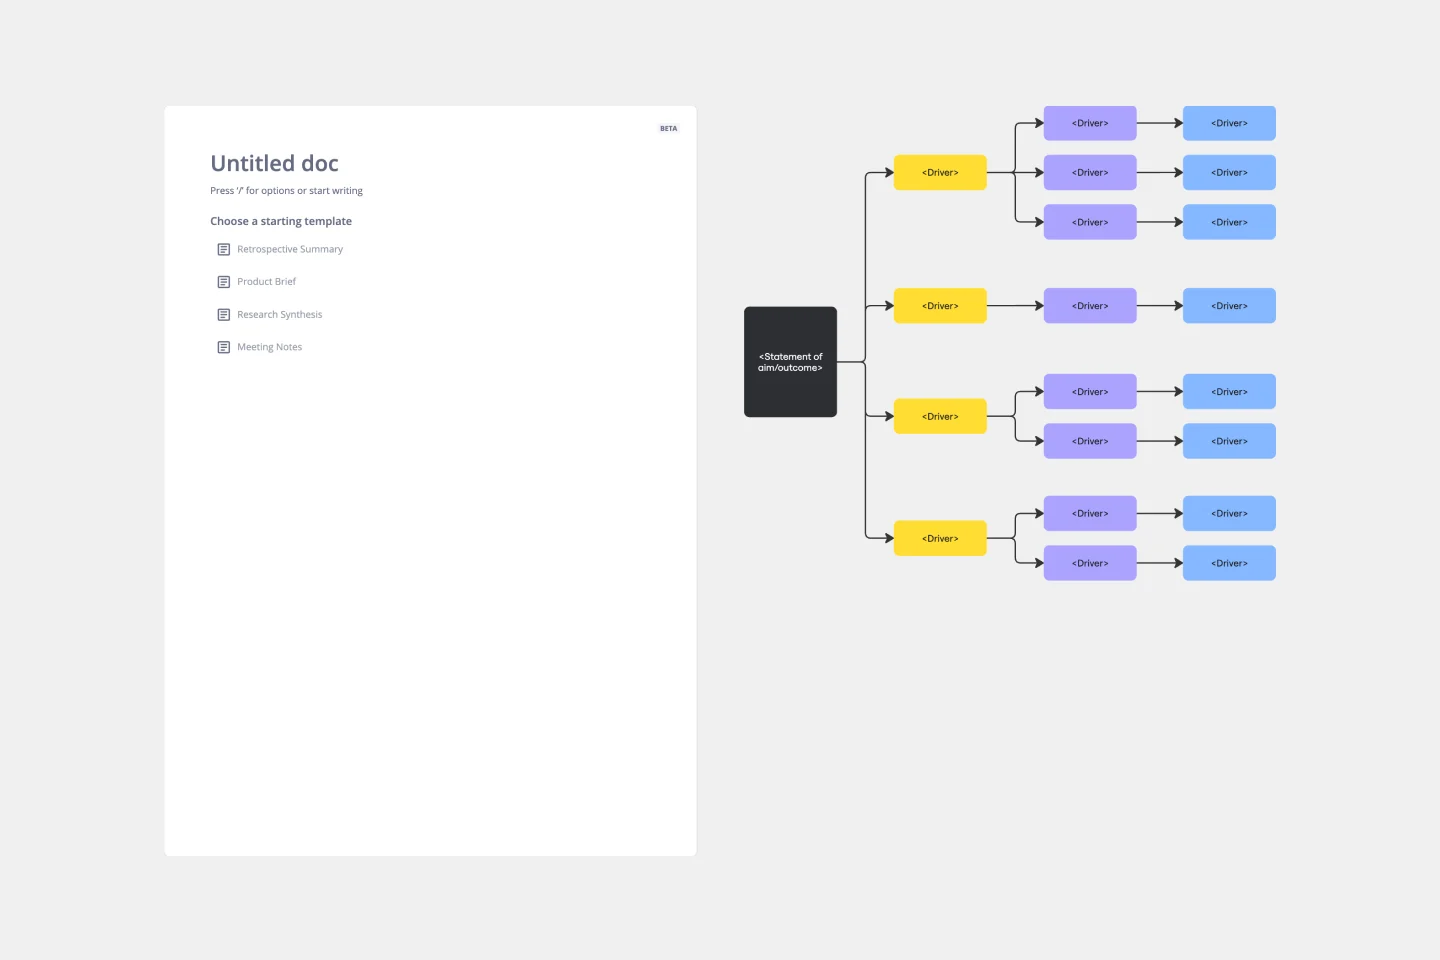
The driver diagram template is a strategic visual tool that helps teams map out their primary objectives and break them down into actionable components. It presents goals, drivers, and specific change ideas in a coherent and interconnected format, ensuring clarity of objective. By doing so, every team member is aligned towards a common endpoint, fostering unified efforts. The visual nature of the template simplifies complex objectives, making it easier for teams to stay on track and measure their progress effectively.
Force Field Analysis Template
Works best for:
Diagramming, Strategic Planning
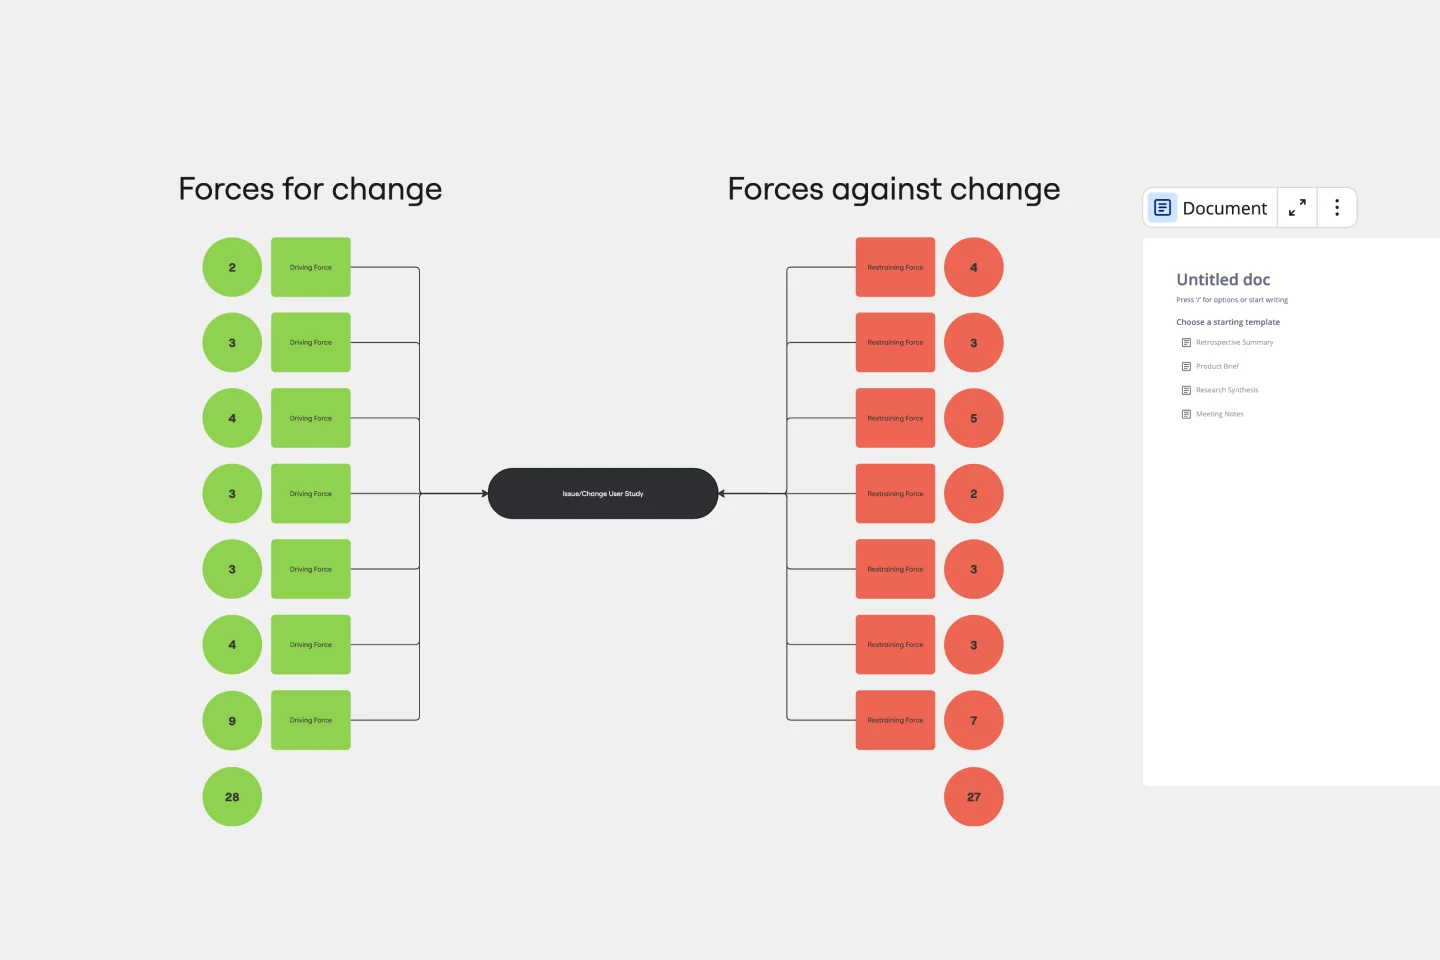
A Force Field Analysis Template is a powerful tool that helps teams identify and analyze the forces supporting or hindering progress toward a specific change or goal. This template provides a visual space where you can brainstorm and plot out 'driving forces' that push objectives forward and 'restraining forces' that prevent advancement, all on a single, intuitive board. One of the primary benefits of utilizing the Force Field Analysis template is that it fosters a shared understanding among team members. By visually mapping out and discussing each force, teams can prioritize efforts, build consensus on the central issues to tackle, and collaboratively devise strategic plans to strengthen positive influences while reducing negative ones.
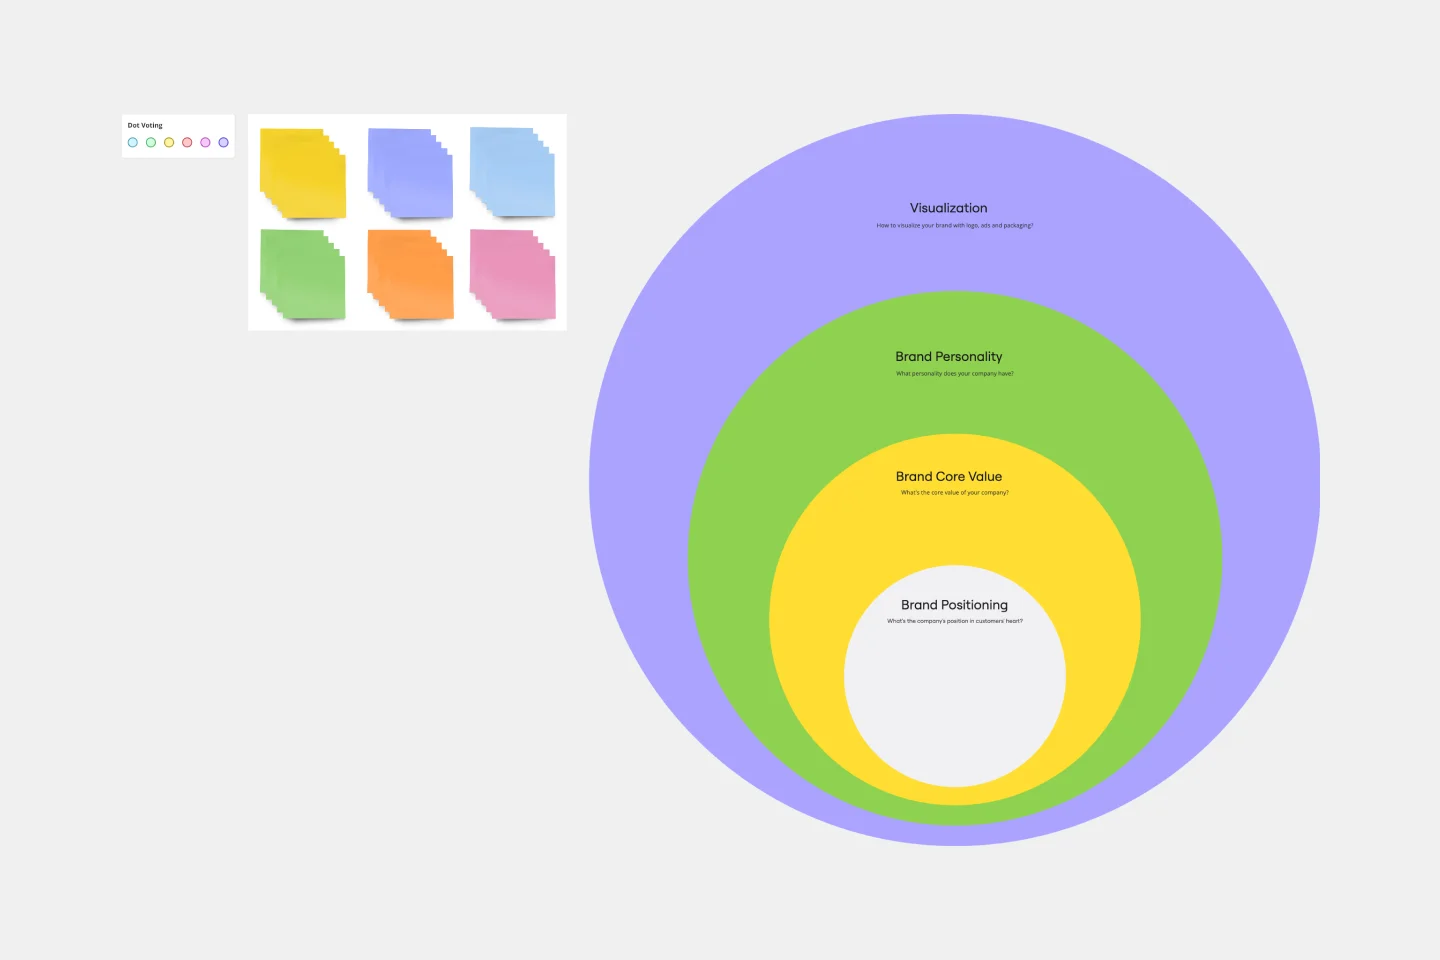
Onion Diagram Template
Works best for:
Diagramming, Mapping and Diagramming
The Onion Diagram Template is a distinct tool designed to visually represent layers of a specific concept, system, or process, akin to the layers of an onion. Each concentric layer of the diagram provides insights into a different aspect or phase of the topic at hand, moving from the core foundational element outwards to more peripheral components. One of the prime benefits of this template is its ability to offer hierarchical clarity. Users can immediately discern the importance, sequence, or interrelation of different elements within a system, facilitating enhanced comprehension and efficient decision-making.
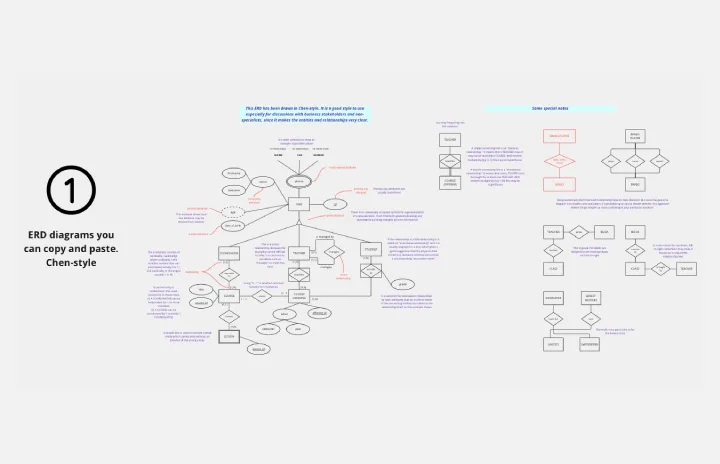
UML ERD Diagram
Works best for:
Diagramming, UML Diagram
This template contains a few Entity-Relationship diagrams that you can re-use for your own work.
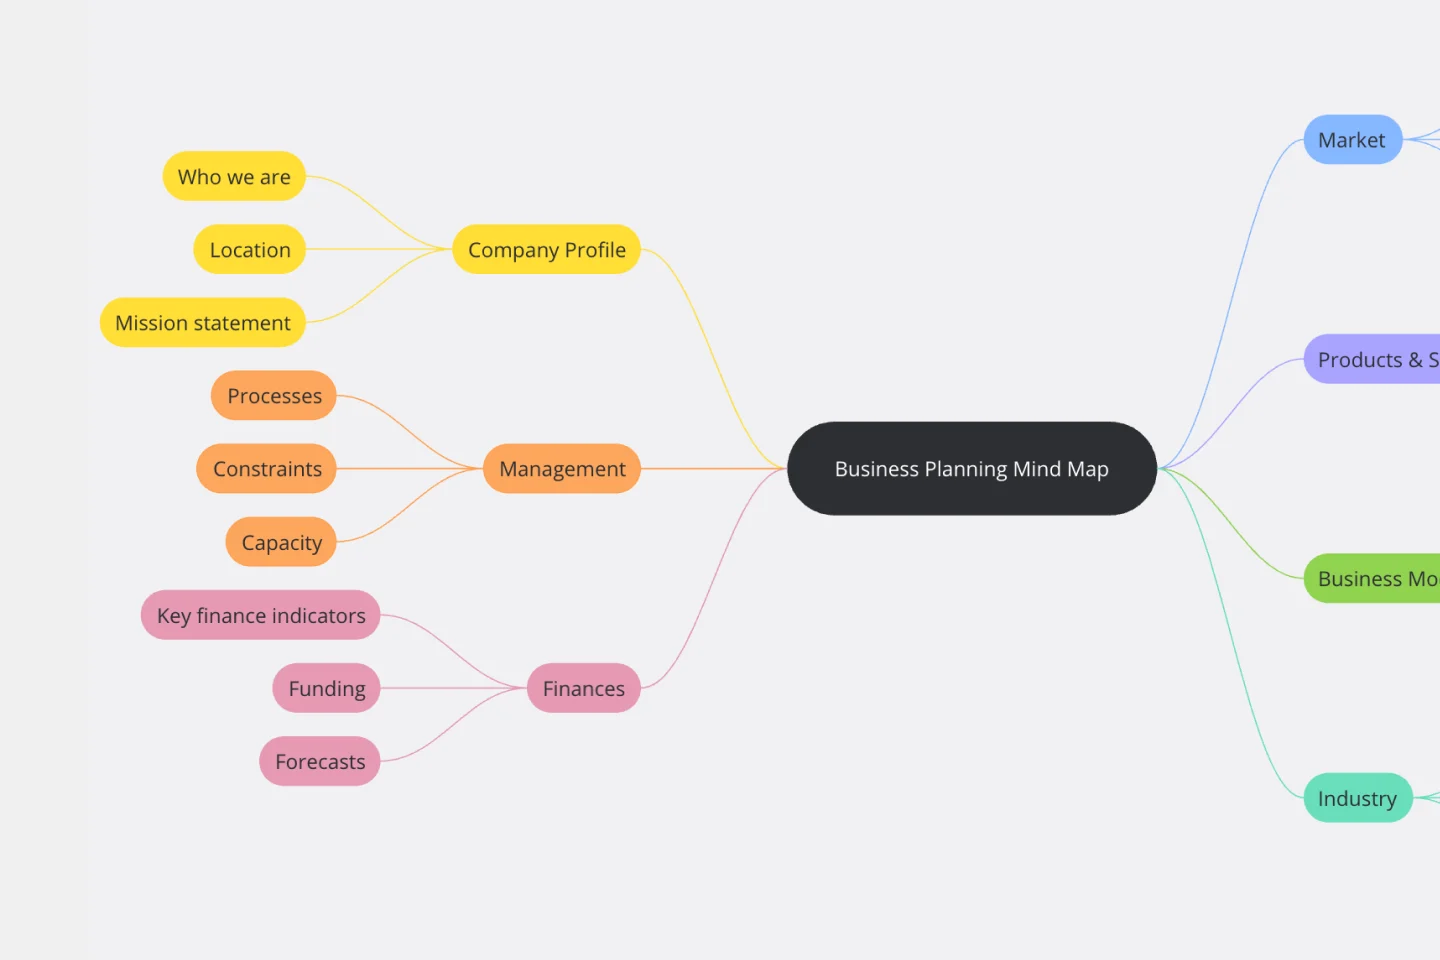
Business Plan Mind Map Template
Works best for:
Strategy, Planning
The Business Plan Mind Map Template simplifies complex business information by visually organizing each plan section as a branch on a mind map. This enhances communication, understanding, and attention to crucial aspects, making it an essential tool for developing effective business strategies.