Tree Diagram Template
Organize ideas effortlessly, enhance collaboration, and streamline decision-making with the tree diagram template.
About the Tree Diagram Template
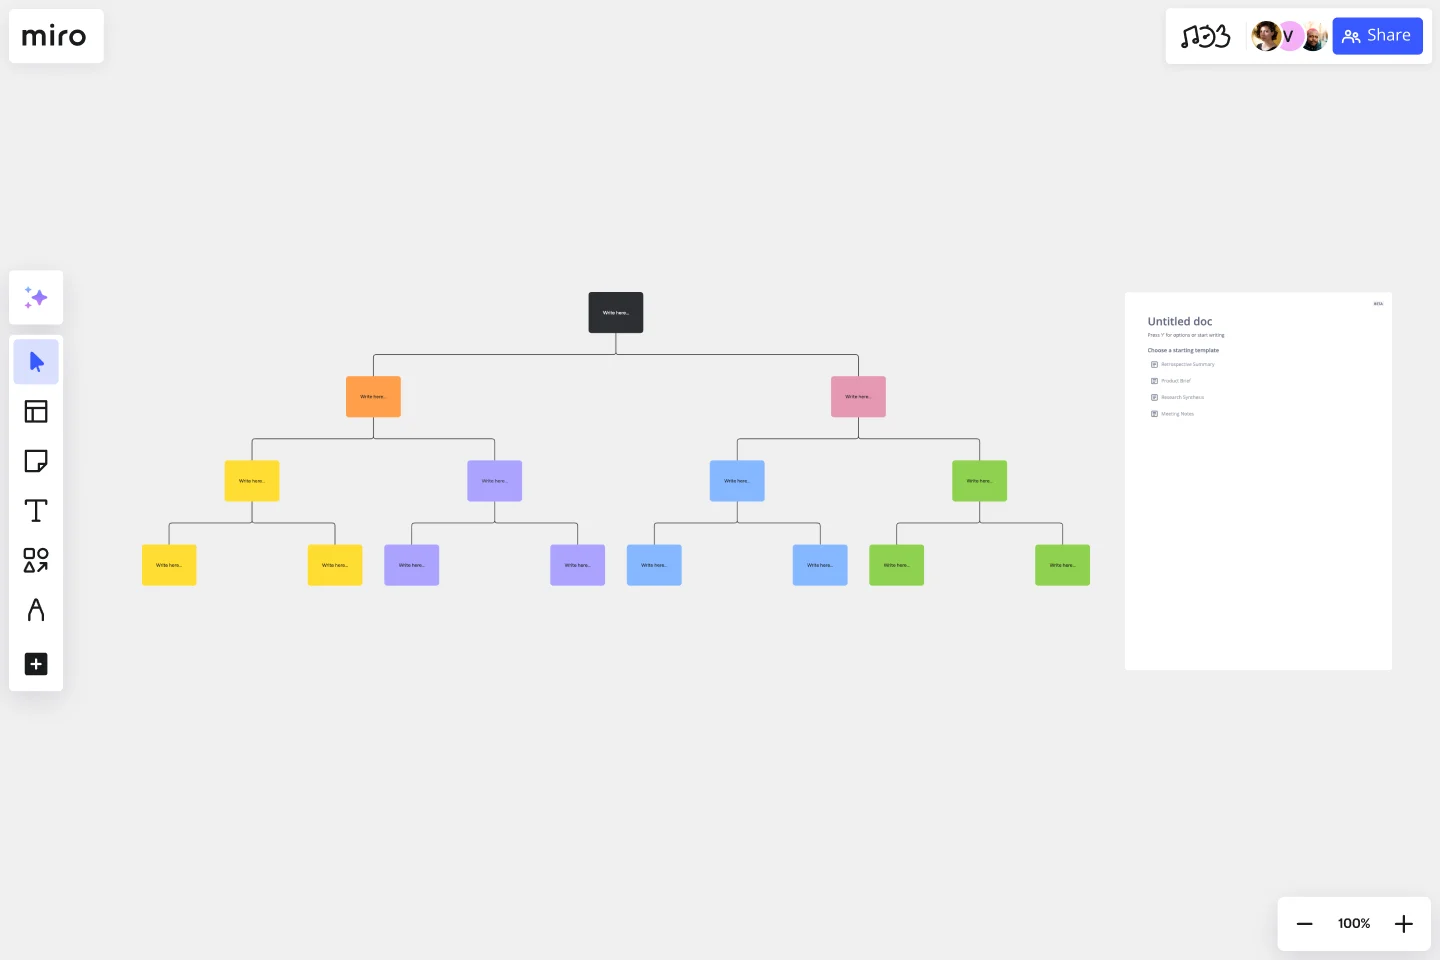
The tree diagram template is an excellent tool for organizing complex ideas and information in a clear, hierarchical structure. Its intuitive design and user-friendly interface provide a visual representation of your thoughts, making it easier to understand and communicate your ideas effectively. Whether you need to break down complex concepts or streamline decision-making processes, this template is your go-to solution. It brings clarity and structure to your ideas, allowing you to map out your thoughts and present them in a tree-like structure.
The template consists of a central node, often representing a main idea or concept, and branches extending outward to depict subcategories or related concepts. Each branch can expand into additional nodes, creating a hierarchical structure that mirrors the relationships between different elements. Users can easily customize each node with text, colors, and icons, providing a visually engaging representation of complex ideas.
How to use the tree diagram template in Miro
Central node: Start by adding your main idea or concept to the central node.
Branch out: Extend your tree by adding branches and sub-branches to represent hierarchical relationships.
Customization: Personalize each node with text, colors, and icons to enhance visual clarity.
Automated features: Easily expand your diagram with a single click, using automated features for seamless tree growth.
Contextual artifacts: Enhance your tree diagram by adding relevant artifacts to the Miro board, providing additional context and information.
Why should you use a tree diagram template?
Visual clarity: Simplify complex ideas by visually organizing information hierarchically.
Streamlined decision-making: Enable decision-making processes by providing a clear overview of relationships and dependencies.
Effective communication: Enhance communication by presenting information in a visually engaging and easily digestible format.
Flexible adaptability: Adapt your tree diagram to evolving ideas, ensuring your visual representation stays relevant and up-to-date.
Collaborative work: Foster collaboration among team members by using a shared visual space to brainstorm and organize thoughts.
Explore Miro's automated tree diagram maker and start creating your tree diagram now.
Can I add more branches to my tree diagram after creating it?
Absolutely! With the tree diagram template in Miro, you can easily add branches and sub-branches as your ideas evolve. Just click and expand as needed.
Can I change the colors of individual nodes for emphasis?
Yes, customization is a key feature. You can personalize each node with different colors, helping to emphasize specific elements and enhance visual hierarchy.
Is the tree diagram template suitable for collaborative work?
The template is designed for collaboration, allowing team members to contribute, edit, and build upon the tree diagram in real-time.
Can I export my tree diagram for use in presentations or documents?
Yes, Miro provides export options, allowing you to save your tree diagram as an image or PDF for seamless integration into presentations or documents.
Get started with this template right now.
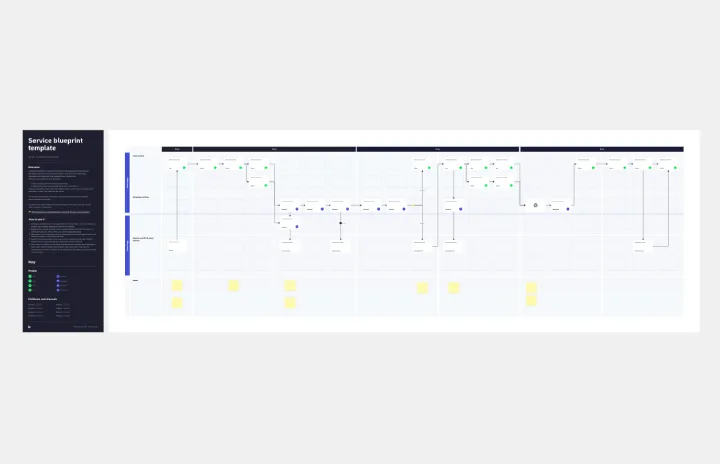
Service Blueprint by Hyperact
Works best for:
Research & Design
The Service Blueprint template is perfect for visualizing the orchestration of service components. It maps out frontstage and backstage elements, helping you analyze and enhance customer experiences. Use this template to align teams, identify pain points, and streamline processes, ensuring a seamless service delivery. It's ideal for creating a shared understanding of service dynamics among stakeholders and collaborators.
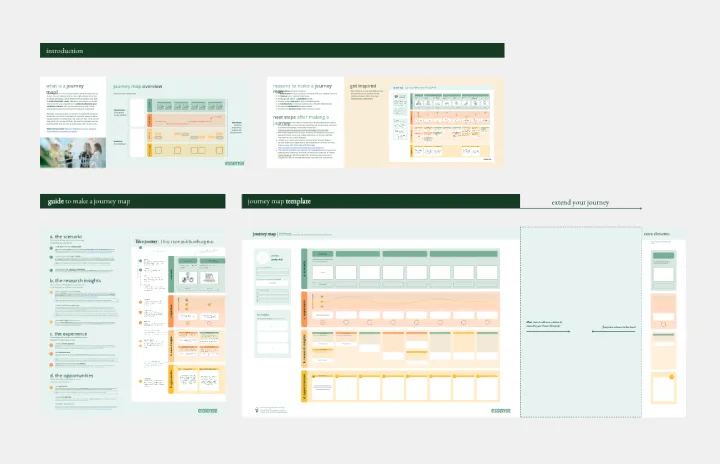
Journey Map To Plot the Customer Experience
Works best for:
Customer Journey Map
A journey is a tool to map out the customer experience of (a part of) your product/service in a visual way.
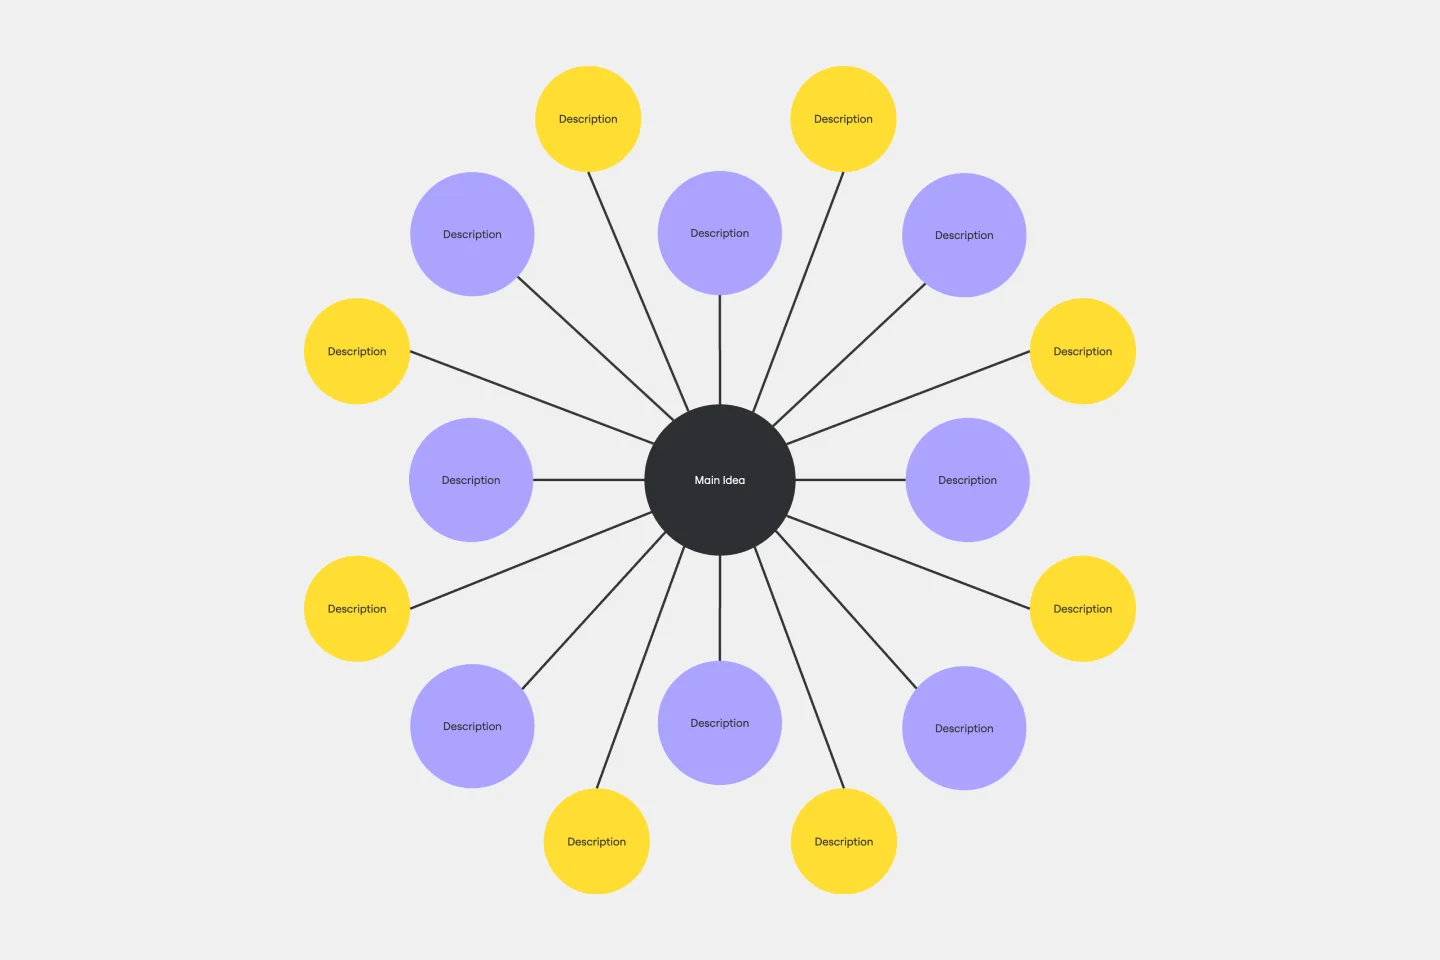
Bubble Map Template
Works best for:
Diagramming, Mapping, Brainstorming
A Bubble Map Template is a visual organization tool that uses bubbles or circles to represent various ideas or data points. These bubbles are linked together, displaying their relationships and creating a network of interconnected thoughts. Use a Bubble Map Template to streamline complex information, enhancing comprehension and promoting efficient decision-making.

20/80 Process Diagram - EOS Compatible
Works best for:
Diagramming
The 20/80 Process Diagram - EOS® Compatible template is a visual tool for mapping out processes and workflows aligned with the Entrepreneurial Operating System (EOS®) methodology. It provides a structured framework for identifying core processes and key activities that drive business outcomes. This template enables organizations to streamline operations, clarify roles and responsibilities, and enhance accountability. By promoting alignment with EOS® principles, the 20/80 Process Diagram empowers teams to achieve organizational excellence and drive sustainable growth.
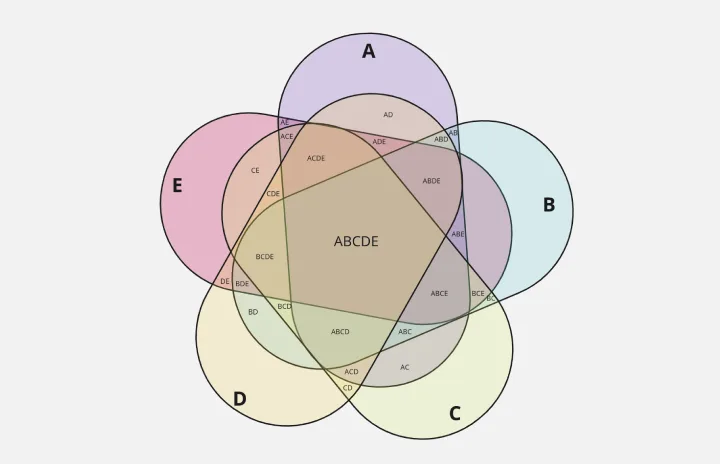
5-Set Venn Diagram
Works best for:
Venn Diagram
Analyze complex data with the 5 Set Venn Diagram template. This tool allows you to compare and contrast five different sets of data, highlighting intersections and unique elements. Perfect for in-depth data analysis, research, and strategic planning. Ideal for analysts, researchers, and educators looking to present comprehensive data insights in a clear and visual manner.
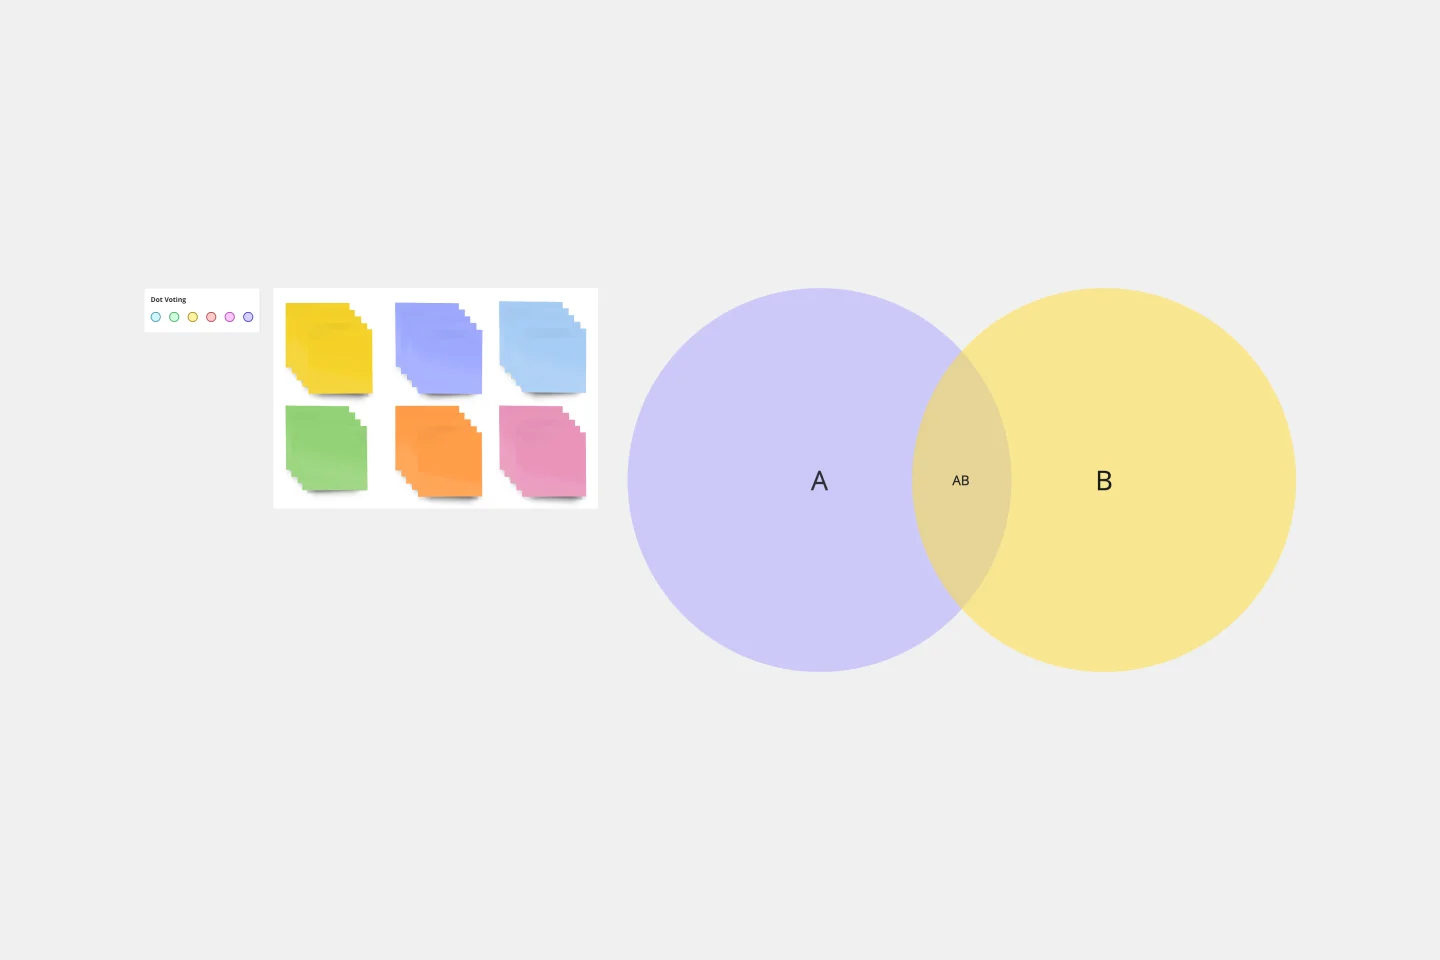
2-Circle Venn Diagram Template
The 2 Circle Venn Diagram Template is a dynamic, intuitive tool designed to represent the logical relationships between two data sets visually. For teams, this template proves valuable in enabling efficient collaboration, clear communication, and shared understanding.