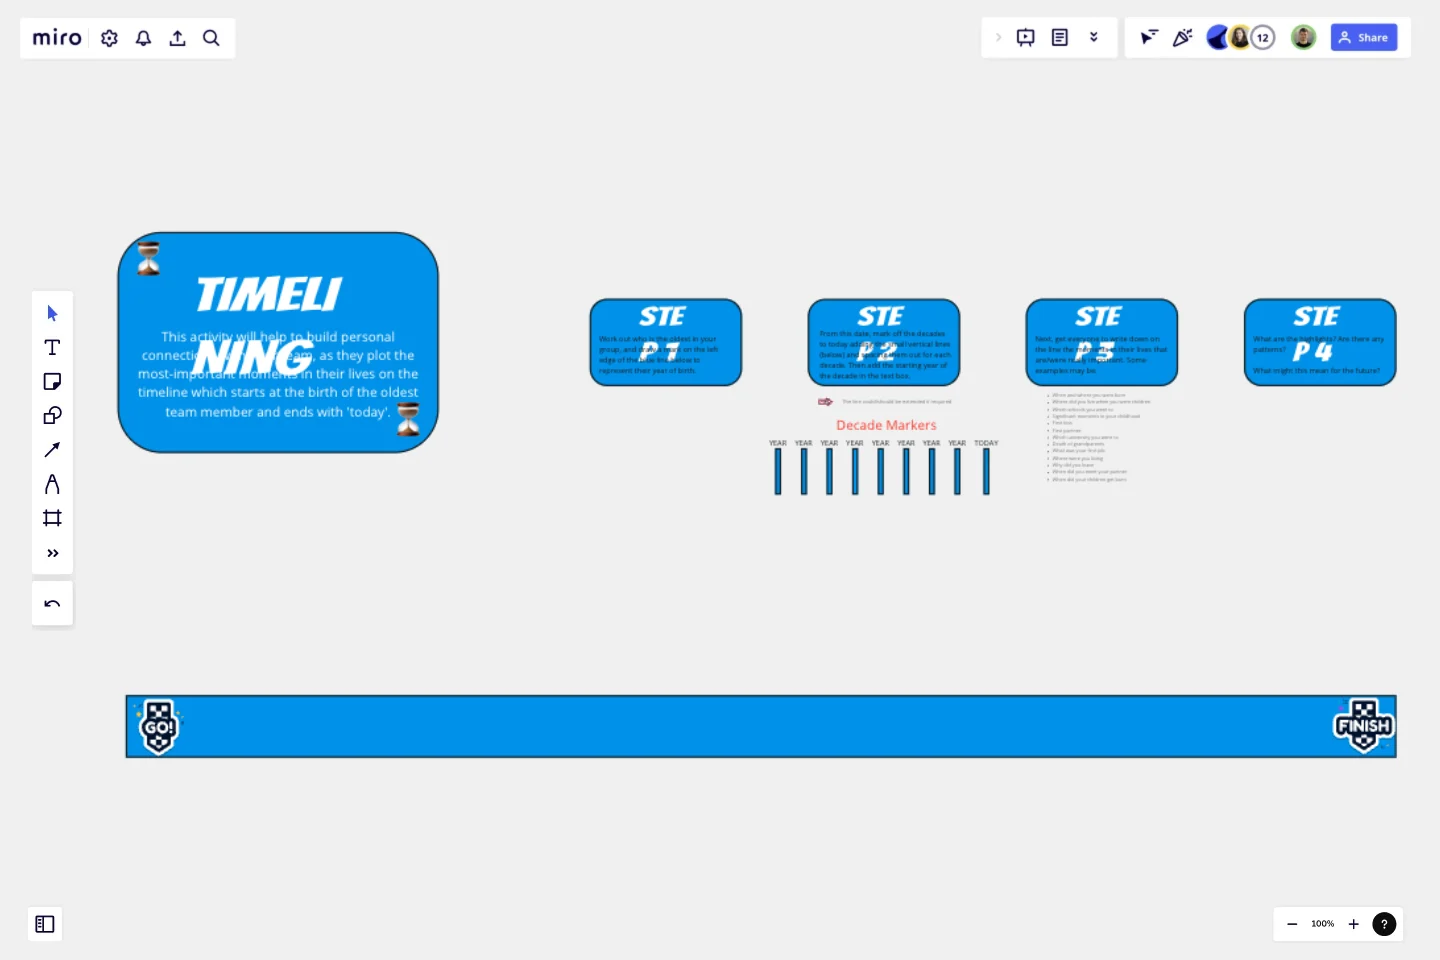
Timelining
This activity will help to build personal connections with your team, as they plot the most-important moments in their lives on the timeline.
What is Timelining all about?
Starting at the birth of the oldest team member and ending with 'today', it's a great way to foster team connection.
Instructions
The activity involves four steps.
Step 1
Work out who is the oldest in your group, and draw a mark on the left edge of the blue line (at "Go") to represent their year of birth.
Step 2
From this date, mark off the decades to today adding the small vertical lines and spacing them out for each decade. Then add the starting year of the decade in the text box.
Step 3
Next, get everyone to write down on the line the moments in their lives that are/were really important. Some examples may be:
When and where you were born
Where did you live when you were children
Which schools you went to
Significant moments in your childhood
First kiss
First partner
Which university you went to
Death of grandparents
What was your first job
Where were you living
Why did you leave
When did you meet your partner
When did your children get born
Step 4
What are the highlights? Are there any patterns? What might this mean for the future?
This template was created by Paul Snedden.
Get started with this template right now.
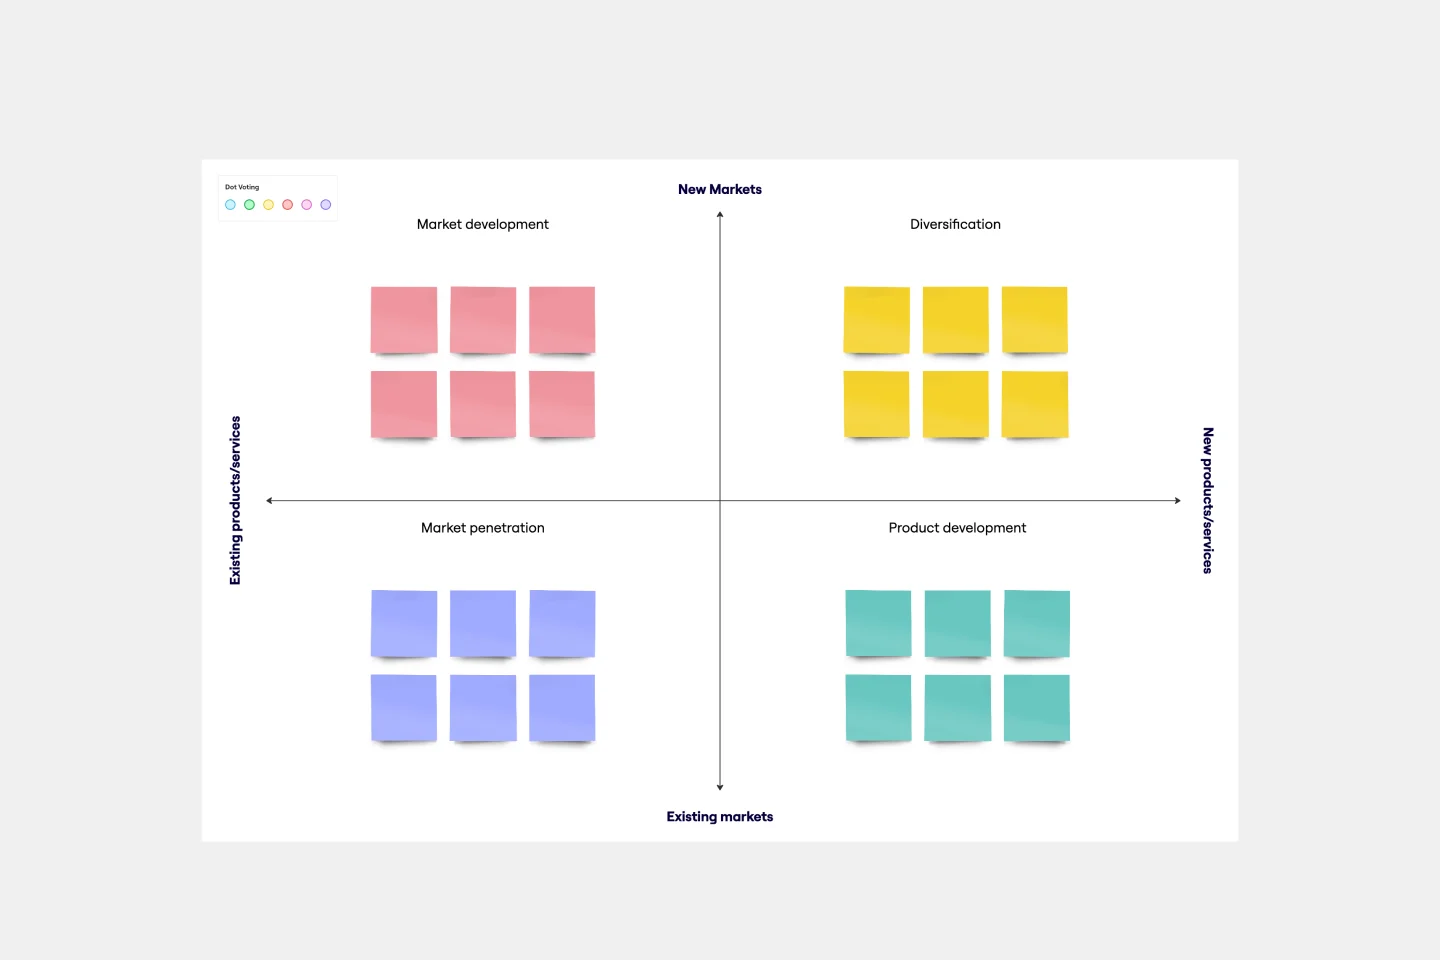
Ansoff Matrix Template
Works best for:
Leadership, Operations, Strategic Planning
Keep growing. Keep scaling. Keep finding those new opportunities in new markets—and creative new ways to reach customers there. Sound like your approach? Then this template might be a great fit. An Ansoff Matrix (aka, a product or market expansion grid) is broken into four potential growth strategies: Market Penetration, Market Development, Product Development, and Diversification. When you go through each section with your team, you’ll get a clear view of your options going forward and the potential risks and rewards of each.
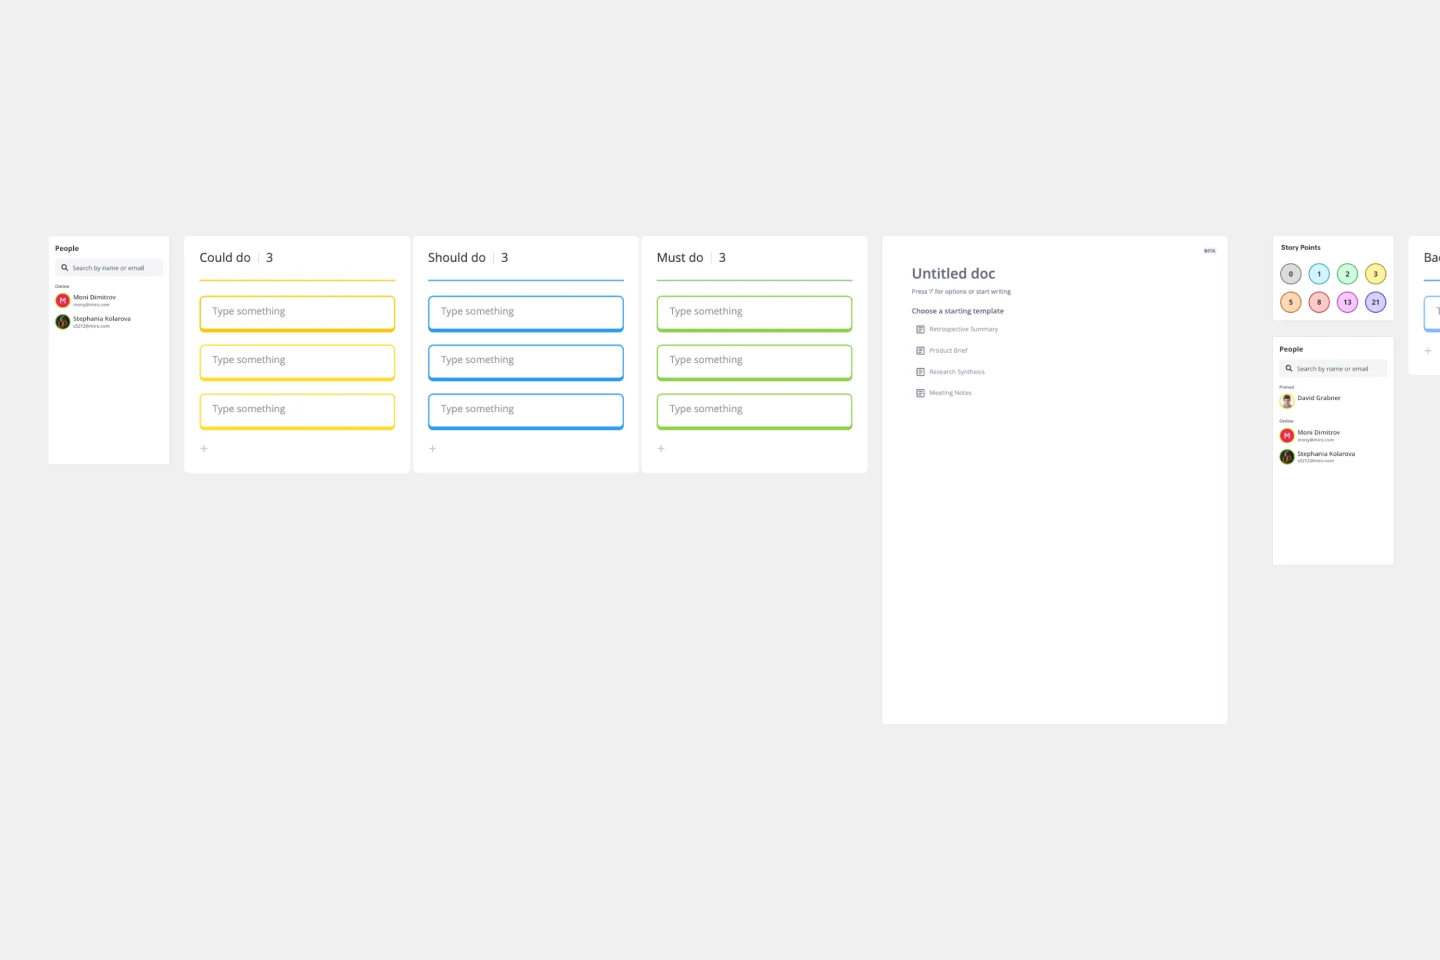
Idea Funnel Backlog
Works best for:
Design, Brainstorming, Agile Workflows
An Idea Funnel Backlog enables you to visualize your backlog and restrict the number of backlogged items at the top. In doing sos, you can prioritize items on your list without having to engage in unnecessary meetings or create too much operational overhead. To use the Idea Funnel Backlog, break up the funnel into different phases or treat it like a roadmap. Use the Idea Funnel Backlog as a hybrid model that combines your roadmap and backlog into one easily digestible format.
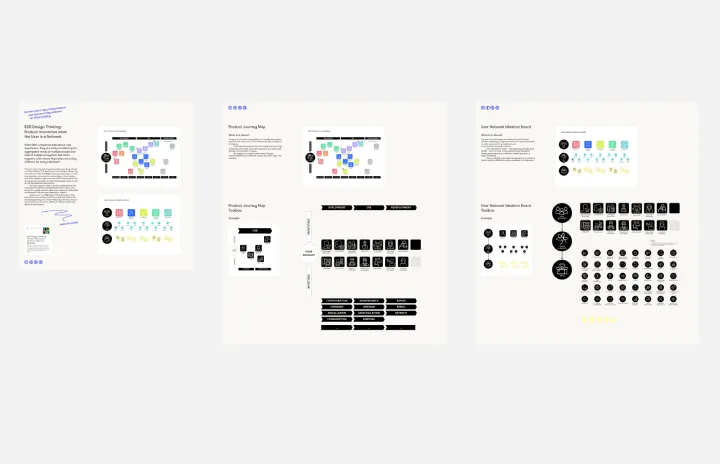
B2B – Product Journey Map & User Network
Works best for:
Planning, Product Management
The B2B Product Journey Map & User Network template helps product teams visualize and understand the complex journey of B2B customers. By mapping user interactions, pain points, and touchpoints across the buyer's journey, this template provides insights into user behavior and preferences. With sections for analyzing user needs, identifying opportunities, and optimizing user experiences, it enables teams to design tailored solutions and drive customer satisfaction. This template serves as a strategic tool for enhancing B2B product offerings and maximizing customer value.
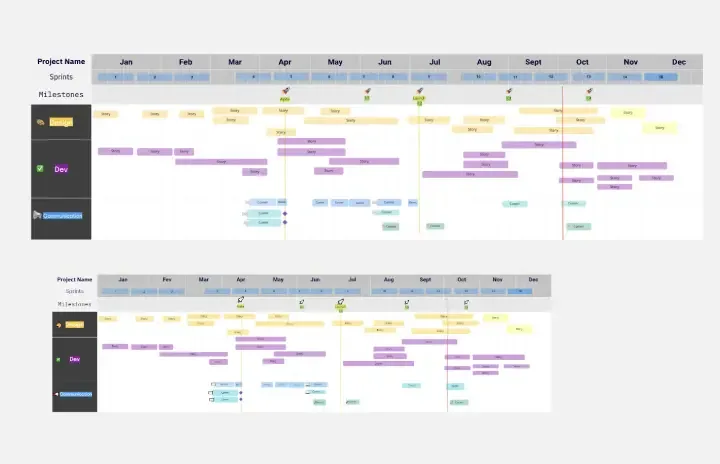
Project - Timeline & Key Infos
Works best for:
Agile, Project Management
The Project - Timeline & Key Infos template provides a visual framework for planning and tracking project timelines, milestones, and key information. It enables teams to align on project objectives, allocate resources, and monitor progress effectively. With customizable timelines and informative dashboards, this template empowers project managers and stakeholders to stay organized and informed throughout the project lifecycle, ensuring successful delivery within scope, time, and budget constraints.
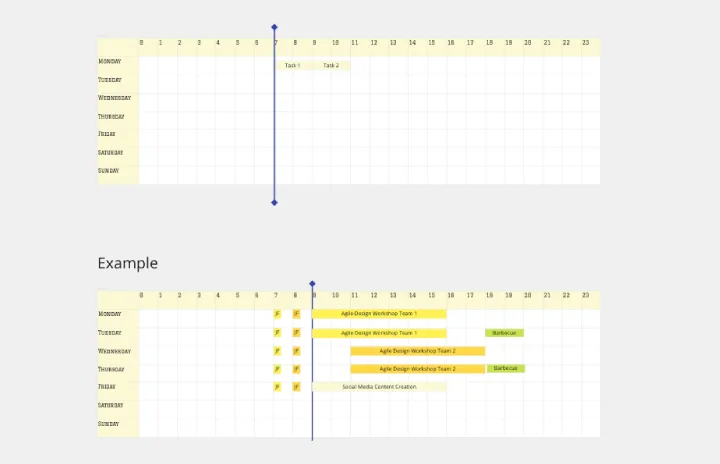
Weekly Planner by Elina Schäfer
Weekly Planner template is perfect for organizing your weekly tasks and schedules. It helps you prioritize activities, set deadlines, and manage your time effectively, ensuring you stay productive and on track throughout the week.
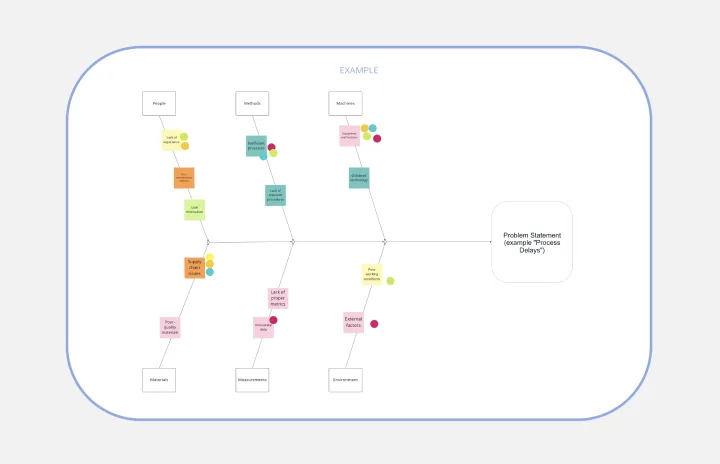
Fishbone Diagram for Process Improvement
Works best for:
Planning, Strategy
Process improvement is key to enhancing efficiency and productivity. The Fishbone Diagram for Process Improvement template helps you identify the root causes of process inefficiencies. Categorize potential causes into areas such as workflow, resources, technology, and personnel. This structured analysis enables your team to systematically explore and address issues, streamlining processes and boosting overall productivity.