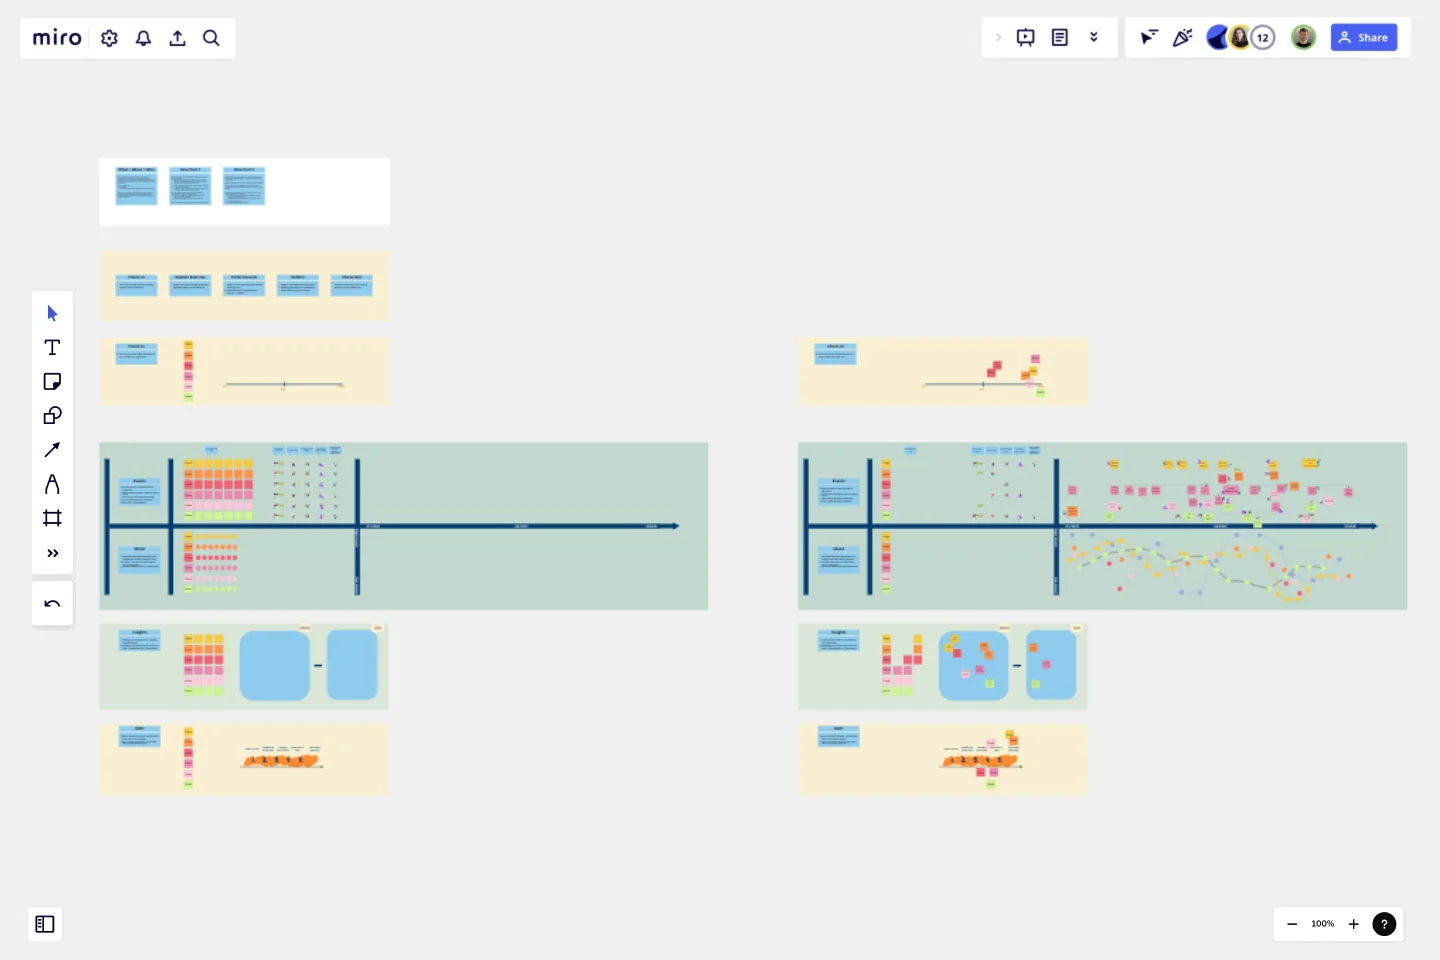
Timeline-Retrospective
This template is for a team situation, where you as a moderator/coach want to reflect on how things have developed over time.
WHAT / WHEN / WHO
A typical example would be to have this special retrospective with a team at the end of a year in order to look back:
what went well
what not?
how do we look at our last months with some distance?
The main goal of this format is to celebrate what has been achieved; but also that we appreciate and reflect on the things that did not go so well (and by that find improvements or finish with them).
HOW
Most instructions can be found on the board directly. But a few hints and tips:The main exercise is about collecting the most interesting, exciting, impactful events of a given period (e.g. at the end of a year looking back until January).So ask the participants/team to come up with ideas and to write them on stickies.In order to support the process certain event types (and matching symbols for those) are prepared
Who left the team during that time; who joined?
Did we have some team events?
Kudos to colleagues for highlights during the year.
What did not go well at all?
Achievements, or milestones we want to point out?
Feel free to adjust the given types according to your situation
Also, ask the team to "feel back": can they remember when they were in a good/bad mood? → indicate that with a dot on the timelineAfter the participants have written down their ideas and used the symbols and dots to highlight their stickies: let each participant briefly explain, and describe their contributions to the timeline.This exercise of reflecting is in itself already valuable - but in a second step the team can reflect:
Any takeaways from the exercise/anything we want to do differently in the future?
Let the participants think about some insights, create ideas, and discuss them.
Close the session with a check-out
This template was created by Christian Ross.
Get started with this template right now.
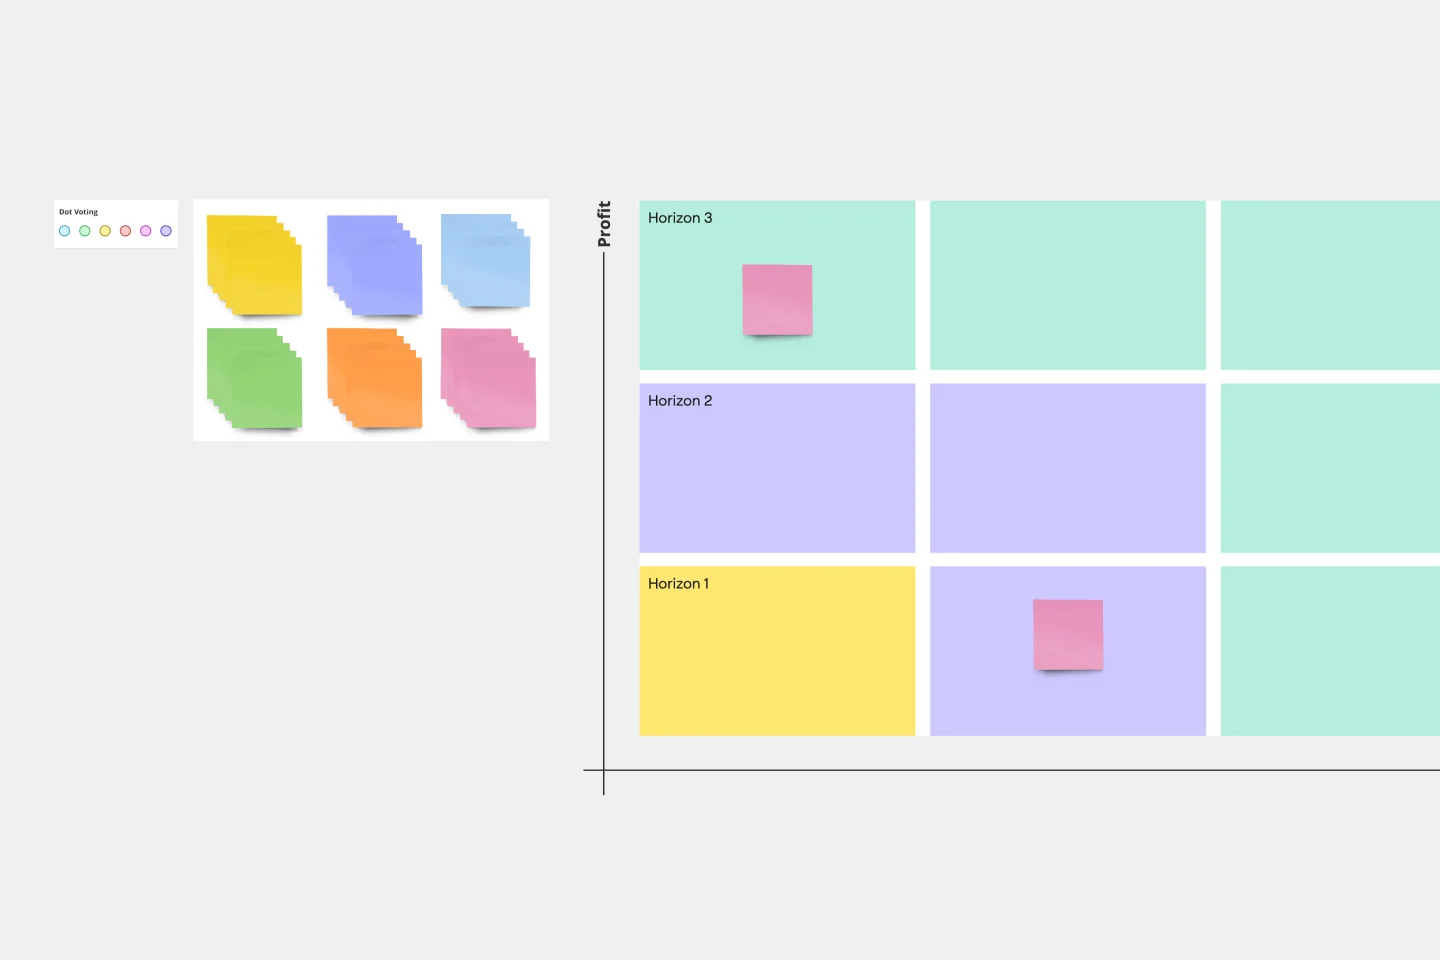
3 Horizons of Growth Template
Works best for:
Leadership, Strategic Planning, Project Planning
Featured in The Alchemy of Growth, this model gives ambitious companies a way to balance the present and the future—in other words, what’s working in the existing business and what emerging, possibly-profitable growth opportunities lie ahead. Then teams across the organization can make sure that their projects map to and support the organization’s goals. The 3 Horizons of Growth model is also a powerful way to foster a culture of innovation—one that values and depends on experimentation and iteration—and to identify opportunities for new business.
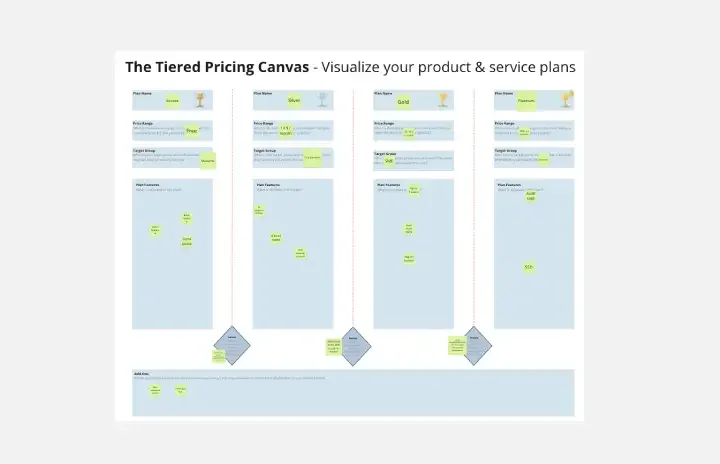
The Tiered Pricing Canvas - Product Plans
Works best for:
Product Management, Planning
The Tiered Pricing Canvas - Product Plans template helps product managers design tiered pricing strategies effectively. By mapping out pricing tiers, features, and value propositions, this template enables teams to optimize pricing models and maximize revenue. With sections for analyzing customer segments and competitive pricing, it supports data-driven pricing decisions. This template serves as a guide for crafting compelling pricing plans that align with customer needs and market dynamics, driving profitability and customer satisfaction.
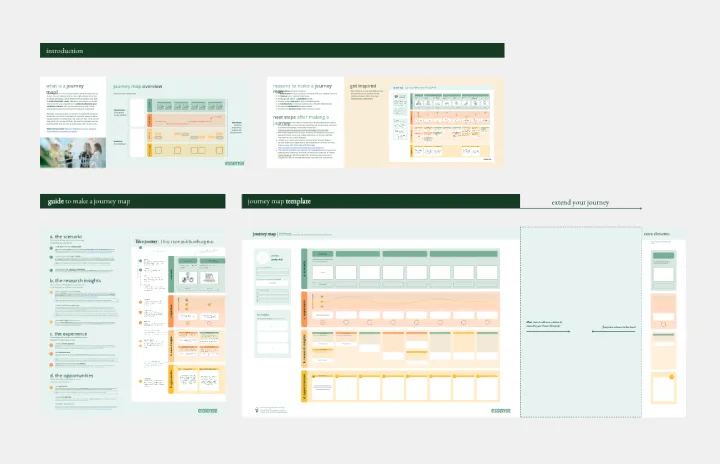
Journey Map To Plot the Customer Experience
Works best for:
Customer Journey Map
A journey is a tool to map out the customer experience of (a part of) your product/service in a visual way.
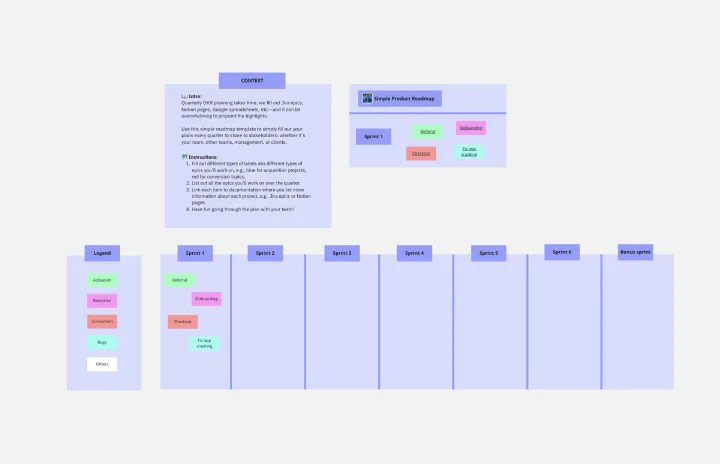
Simple Quarterly Product Roadmap
Works best for:
Roadmap, Planning, Mapping
Plan your product development with the Quarterly Product Roadmap template. This tool helps you outline key objectives and tasks for each quarter. Use it to set clear priorities, align your team, and track progress over time. Ideal for product managers and teams aiming to maintain focus and achieve quarterly goals. Simplify your planning process and ensure everyone is on the same page with this easy-to-use roadmap template.
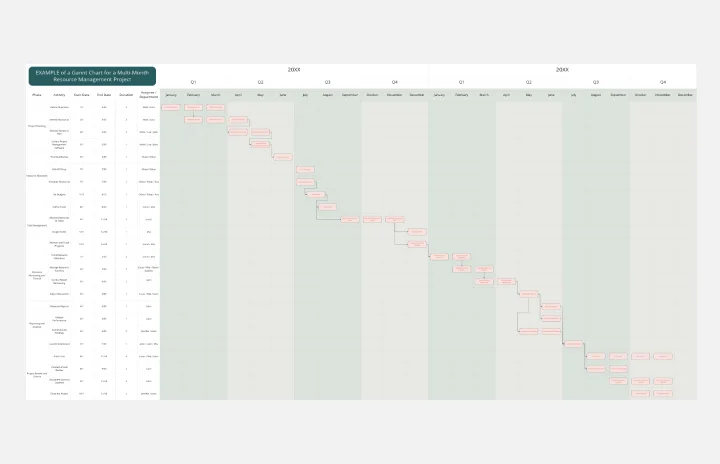
Resource Management Gantt Chart
Works best for:
Strategy, Planning
Efficient resource allocation is crucial for project success. The Resource Management Gantt Chart template helps you plan and manage your resources effectively. Use it to track the availability and allocation of personnel, equipment, and materials throughout your project. This template ensures resources are optimally utilized, reducing waste and avoiding delays, providing a clear overview of assignments and workload balance.
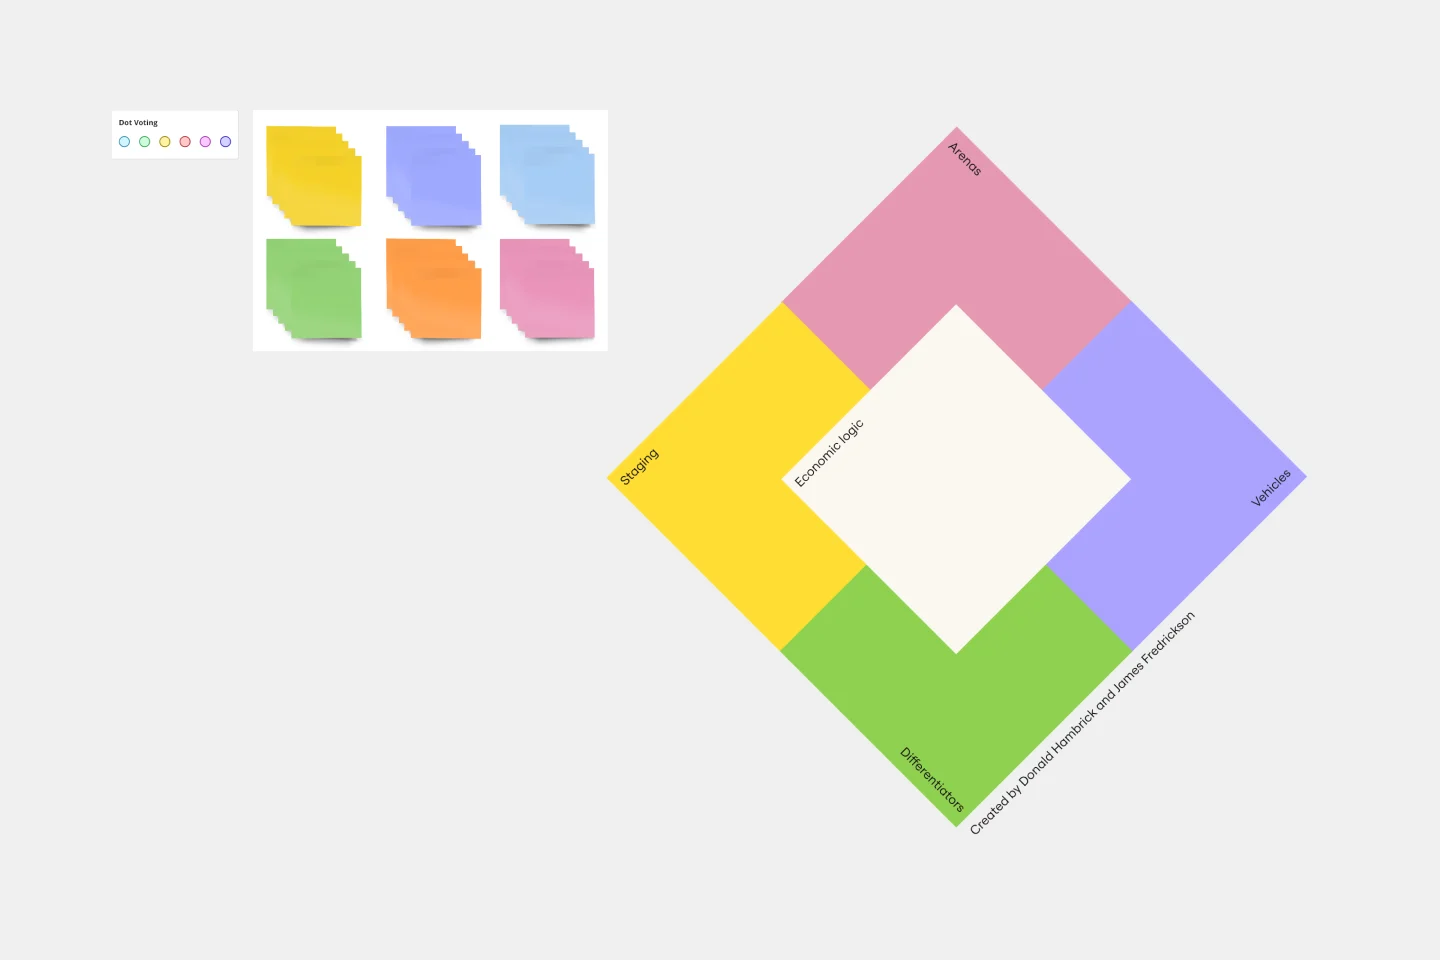
Strategy Diamond Template
Works best for:
Leadership, Operations, Strategic Planning
To achieve key objectives, every business assembles a series of strategies. But what elements should you consider when building a strategy? A strategy diamond is a collection of elements forming a coherent business strategy. These elements include: Arenas, Differentiators, Vehicles, Staging, and Economic Logic. Most strategic plans focus on just one or two of these elements, creating gaps that might cause problems for your business later on. A strategy diamond can help you stay focused and ensure you’re fulfilling all of your business’s needs rather than one or two.