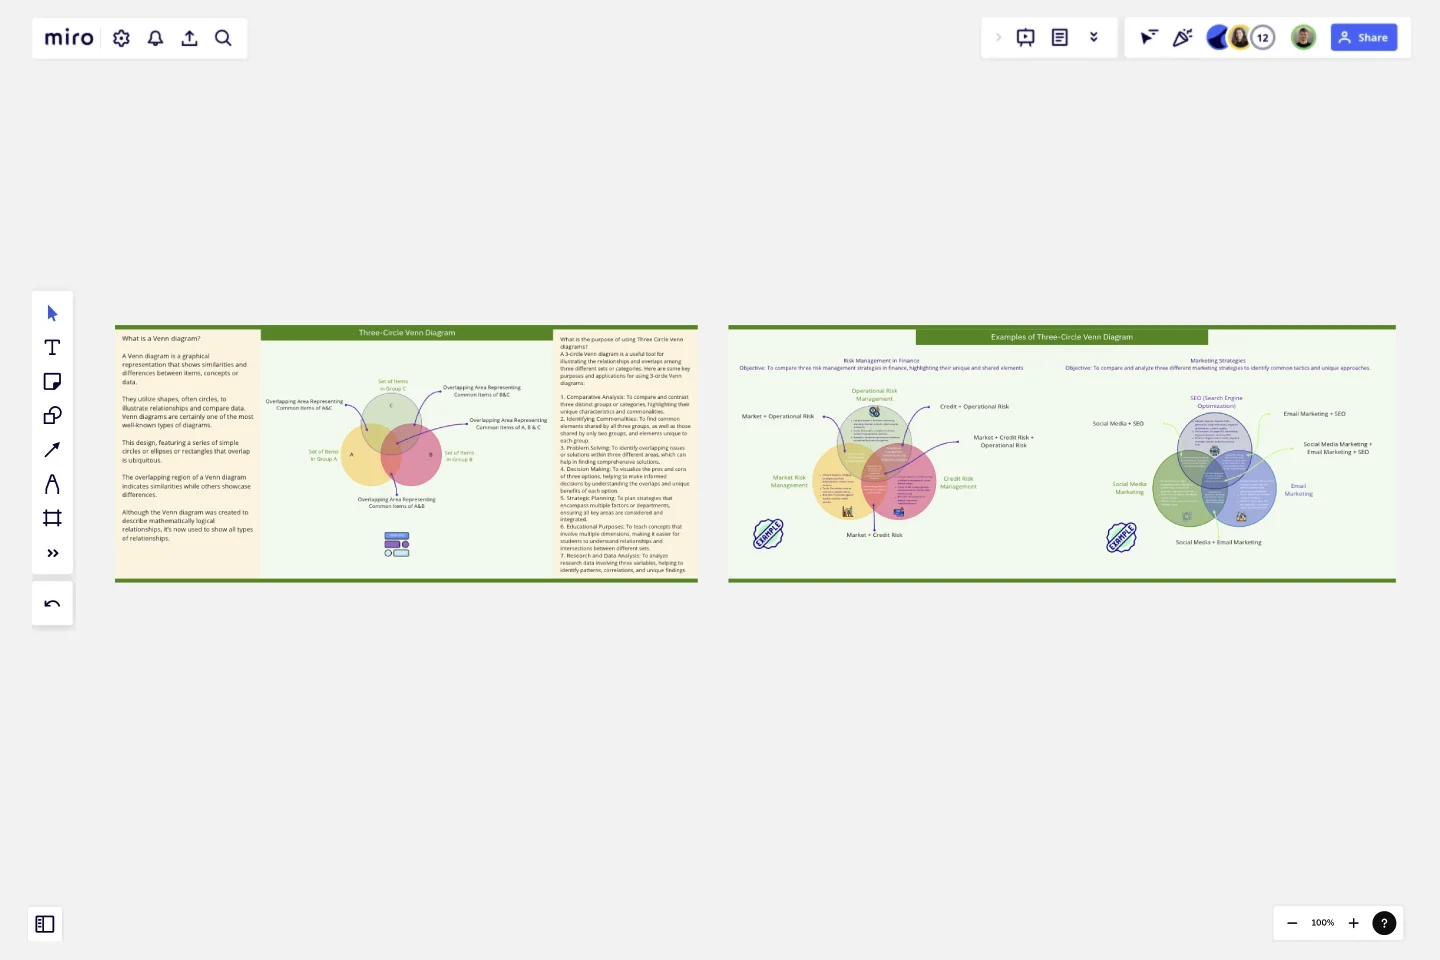
Three-Circle Venn Diagram
A Venn diagram is a graphical representation that shows similarities and differences between items, concepts or data.
They utilize shapes, often circles, to illustrate relationships and compare data.
Venn diagrams are certainly one of the most well-known types of diagrams. This design, featuring a series of simple circles or ellipses or rectangles that overlap is ubiquitous. The overlapping region of a Venn diagram indicates similarities while others showcase differences. Although the Venn diagram was created to describe mathematically logical relationships, it’s now used to show all types of relationships.
Purpose of using Three Circle Venn diagrams
A 3-circle Venn diagram is a useful tool for illustrating the relationships and overlaps among three different sets or categories. Here are some key purposes and applications for using 3-circle Venn diagrams:
1. Comparative Analysis: To compare and contrast three distinct groups or categories, highlighting their unique characteristics and commonalities.
2. Identifying Commonalities: To find common elements shared by all three groups, as well as those shared by only two groups, and elements unique to each group.
3. Problem Solving: To identify overlapping issues or solutions within three different areas, which can help in finding comprehensive solutions.
4. Decision Making: To visualize the pros and cons of three options, helping to make informed decisions by understanding the overlaps and unique benefits of each option.
5. Strategic Planning: To plan strategies that encompass multiple factors or departments, ensuring all key areas are considered and integrated.
6. Educational Purposes: To teach concepts that involve multiple dimensions, making it easier for students to understand relationships and intersections between different sets.
7. Research and Data Analysis: To analyze research data involving three variables, helping to identify patterns, correlations, and unique findings.
Along with step by step guide, two examples have also been provided to help you understand the concept of using 3-circle venn diagram. These can just be copy/paste to your own board.
This template was created by Khawaja Rizwan.
Get started with this template right now.
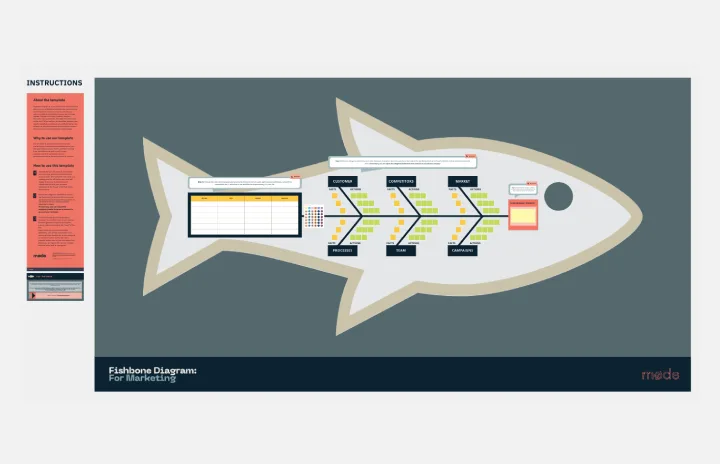
Fishbone Diagram for Marketing
Works best for:
Fishbone Diagram
Optimizing marketing strategies requires identifying underlying issues. The Fishbone Diagram Marketing template helps you systematically explore factors affecting your campaigns. Categorize potential causes into areas such as market research, product positioning, promotional strategies, and distribution channels. This structured analysis enables your team to pinpoint and address issues, enhancing marketing effectiveness and achieving better results.
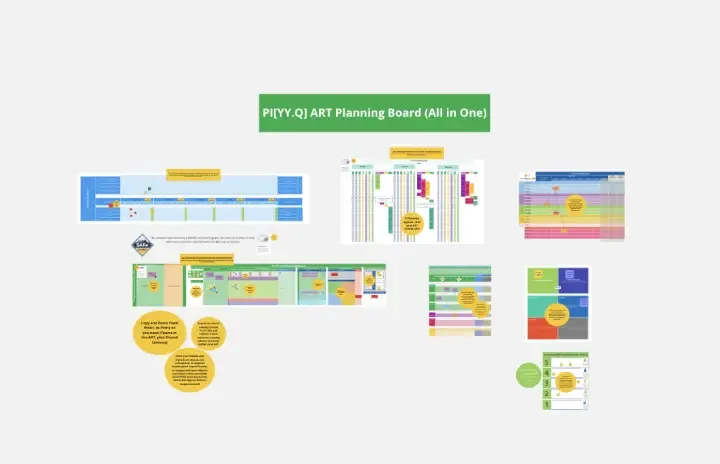
All-in-one PI Planning
Works best for:
Agile
The All-in-one PI Planning template streamlines the SAFe Program Increment (PI) Planning process by providing a comprehensive framework for teams to collaboratively plan and align on objectives and dependencies. It integrates essential elements such as PI Objectives, Team Breakouts, and Program Board, enabling teams to visualize, prioritize, and coordinate work effectively. This template empowers Agile Release Trains to deliver value predictably and efficiently, driving alignment and synchronization across the organization.
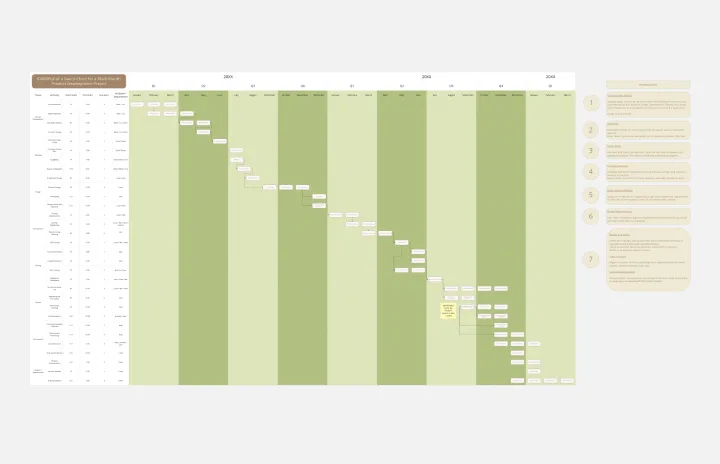
Product Development Gantt Chart
Works best for:
Gantt Chart, Planning
Developing a new product involves many steps and stakeholders. The Product Development Gantt Chart template helps you manage this complex process efficiently. Use it to outline each phase of development, set timelines, and assign responsibilities. Track progress and make adjustments as needed to stay on schedule. This template provides a clear visual representation, coordinating tasks for a successful product launch.
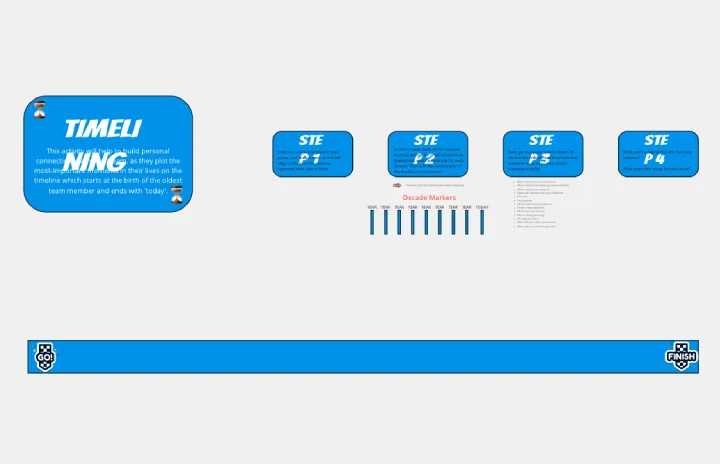
Timelining
Works best for:
Planning, Timeline
Timelining is a versatile template designed for creating detailed project timelines. It allows you to outline tasks, milestones, and deadlines, helping you manage projects efficiently. Whether for business or personal use, this template ensures you stay organized and on schedule.
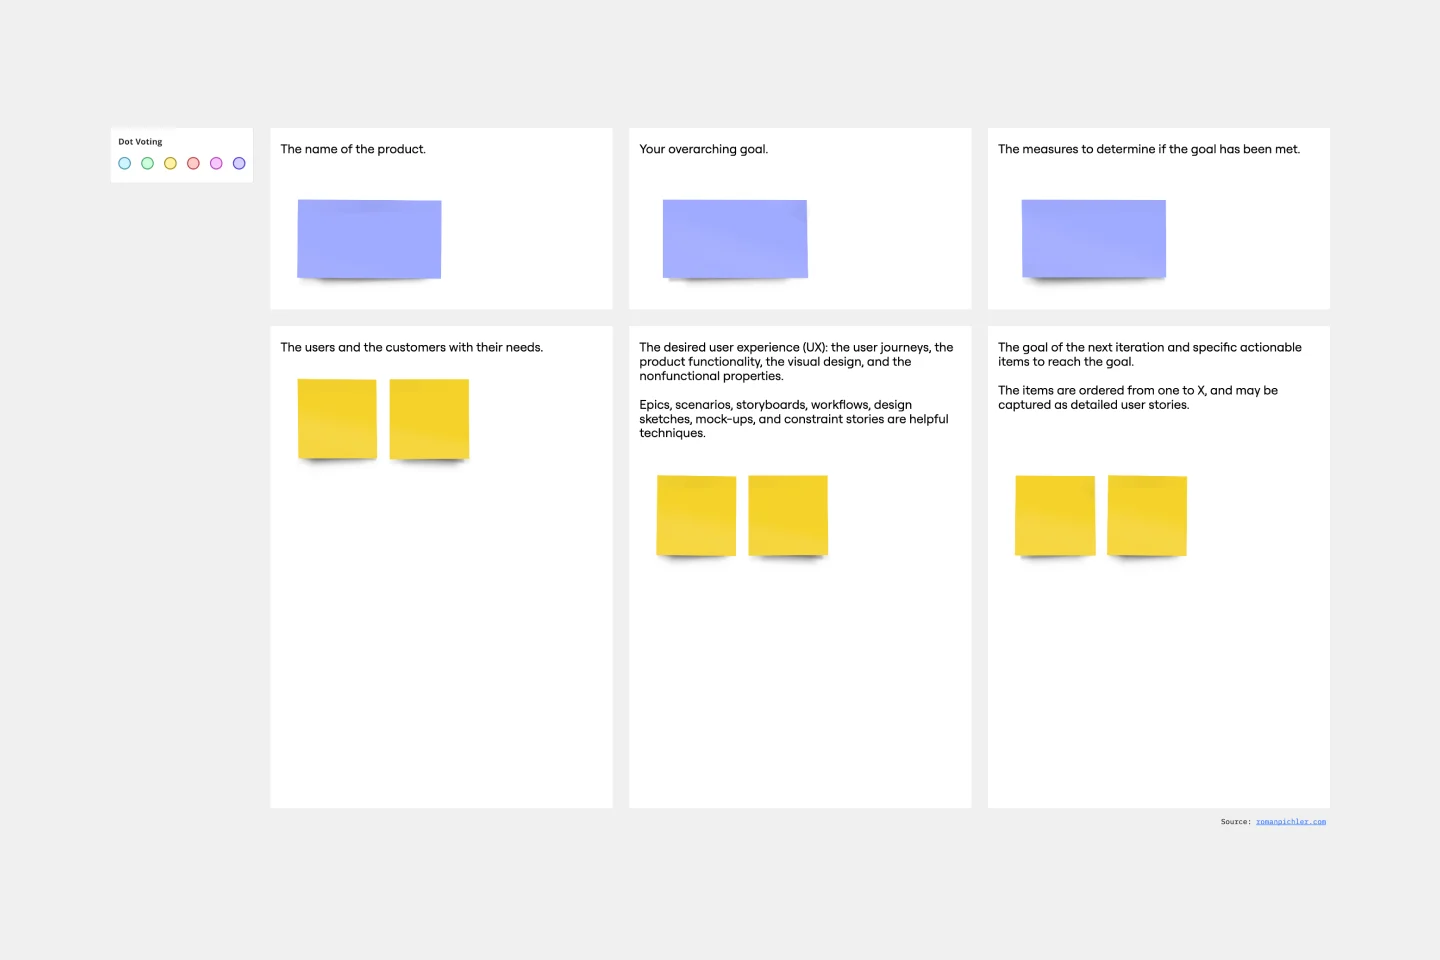
Product Canvas Template
Works best for:
Desk Research, UX Design
Product canvases are a concise yet content-rich tool that conveys what your product is and how it is strategically positioned. Combining Agile and UX, a project canvas complements user stories with personas, storyboards, scenarios, design sketches, and other UX artefacts. Product canvases are useful because they help product managers define a prototype. Creating a product canvas is an important first step in deciding who potential users may be, the problem to be solved, basic product functionality, advanced functionalities worth exploring, competitive advantage, and customers’ potential gain from the product.
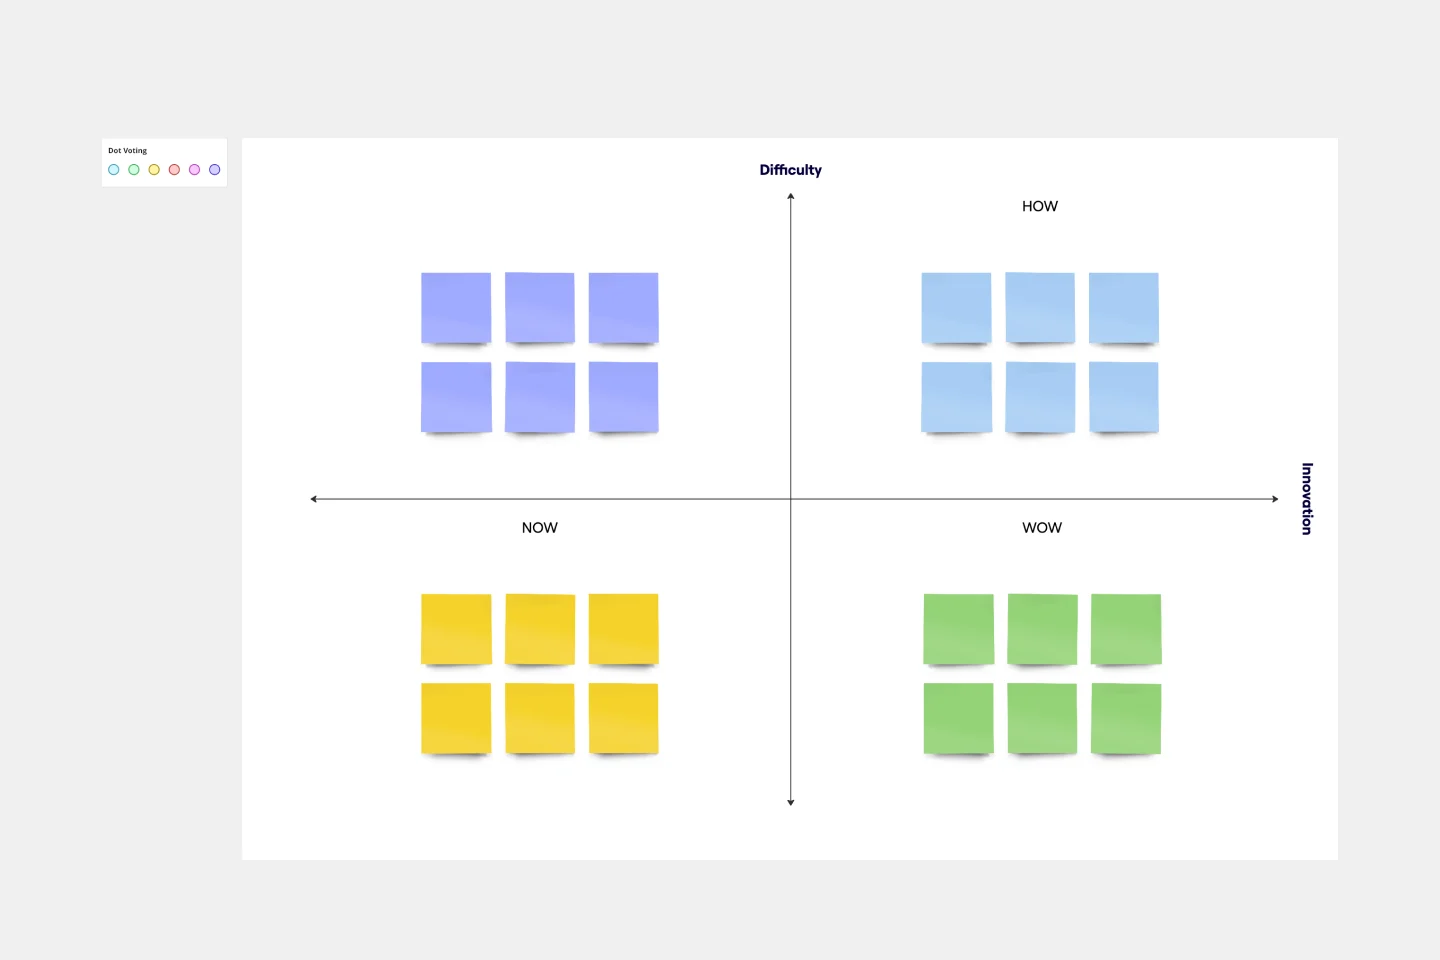
How Now Wow Matrix Template
Works best for:
Ideation, Product Management, Prioritization
There are no bad ideas in a brainstorm — but some are more original and easier to implement. The How Now Wow matrix is a tool that helps you identify and organize those great ideas, as well as reinvigorates your team to think creatively and take risks (a taller order as you scale). Grab this template to create your own matrix, then rank the ideas you generated in a brainstorm as “How” (difficult to implement), “Now” (easy to implement), or “Wow” (both original and easy to implement).