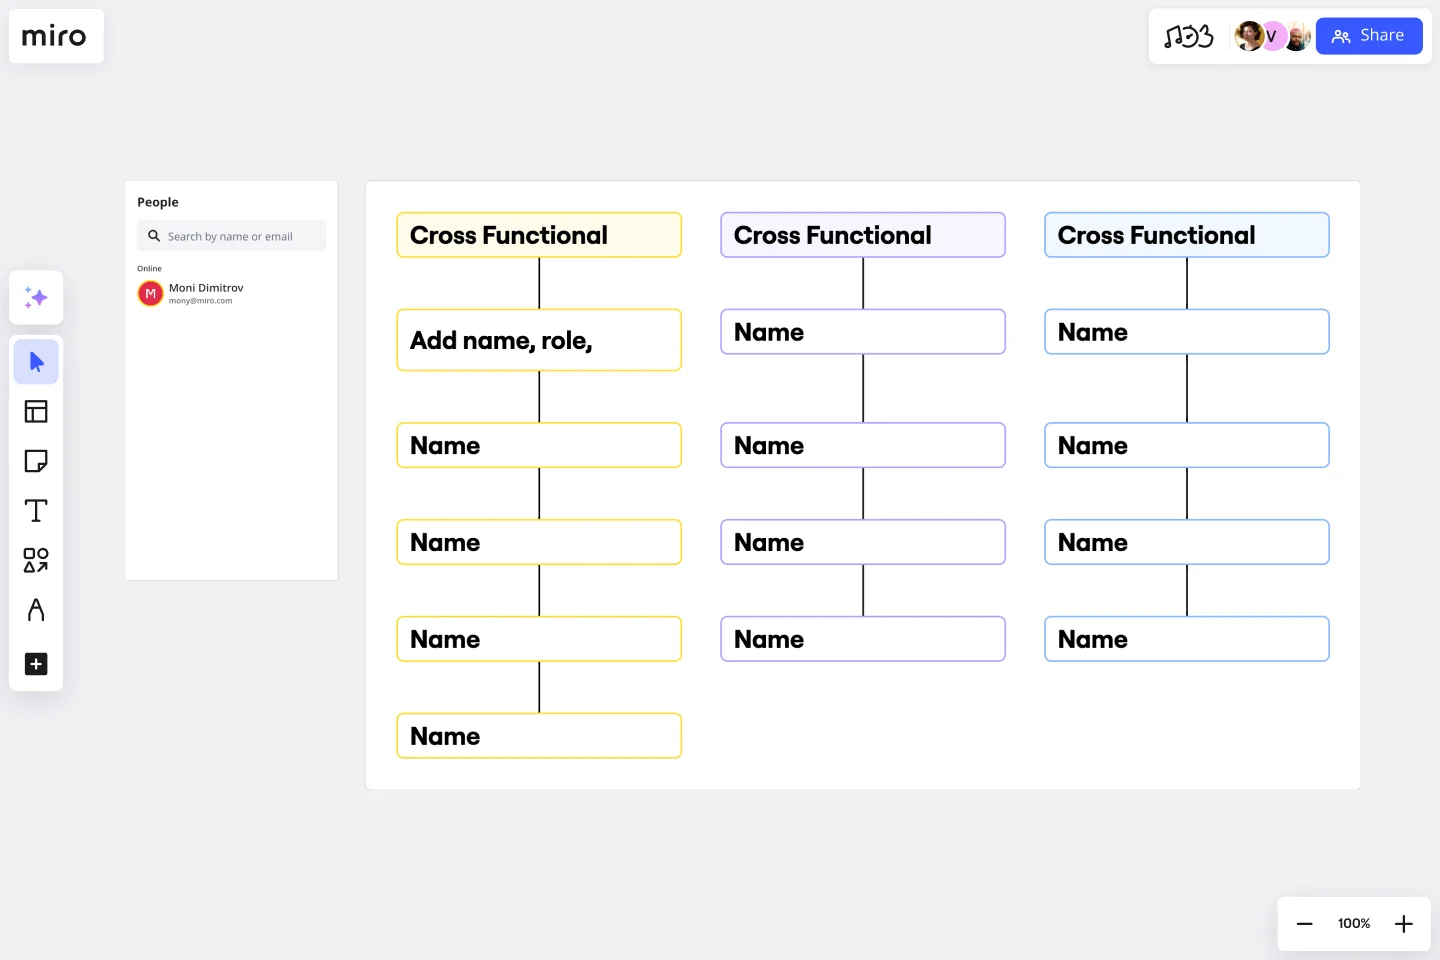
Team (XFN) Chart Template
Illustrate the structure of three cross-functional teams within an organization with the team (XFN) chart template.
About the Team (XFN) Chart Template
The Team (XFN) Chart Template is a tool designed to enhance visibility and streamline the planning and execution processes within cross-functional teams. This template allows for a comprehensive view of team structures, responsibilities, and interdependencies, making it easier to identify each team member's roles and contributions. By using this template, teams can foster a more collaborative environment, ensuring that everyone is aligned with the project's goals and timelines.
How to use the team (XFN) chart template
Start with the basics: Outline your team's core structure. Use the template to map out your project's different roles and departments.
Define relationships and dependencies: Use the chart to illustrate the relationships between different team members and departments. Highlight any dependencies that might impact project execution, ensuring clarity on who relies on whom for information, resources, or decision-making.
Customize for clarity: The template is designed to be flexible. Add additional layers of information, such as project timelines, specific tasks, or key milestones, to provide a comprehensive overview of the project's scope and responsibilities.
Iterate and update: As projects evolve, so do team dynamics and requirements. Regularly revisit and update the team (XFN) chart to reflect any changes, ensuring that the chart remains a reliable source of truth for the entire team.
Why use a team (XFN) chart template
Maintaining clarity and alignment within cross-functional teams is more important than ever in today's fast-paced and interconnected work environments. The team (XFN) chart template serves as a foundational tool for achieving these objectives, offering several key benefits:
Enhanced visibility: The team (XFN) chart provides a bird's-eye view of the entire project team, making it easier to understand how different parts of the team fit together and contribute to the project's success.
Improved collaboration: By clearly defining roles, responsibilities, and dependencies, the chart encourages open communication and collaboration among team members, helping to break down silos and foster a more inclusive working environment.
Streamlined planning and execution: With a clear understanding of the team's structure and interdependencies, planning and execution become more efficient. Teams can anticipate potential bottlenecks or conflicts and address them proactively, leading to smoother project delivery.
Adaptability: The team (XFN) chart is adaptable to various project sizes and complexities. Whether you're working on a small initiative or a large-scale project, the chart can be customized to meet your team's specific needs.
Get started with this template right now.
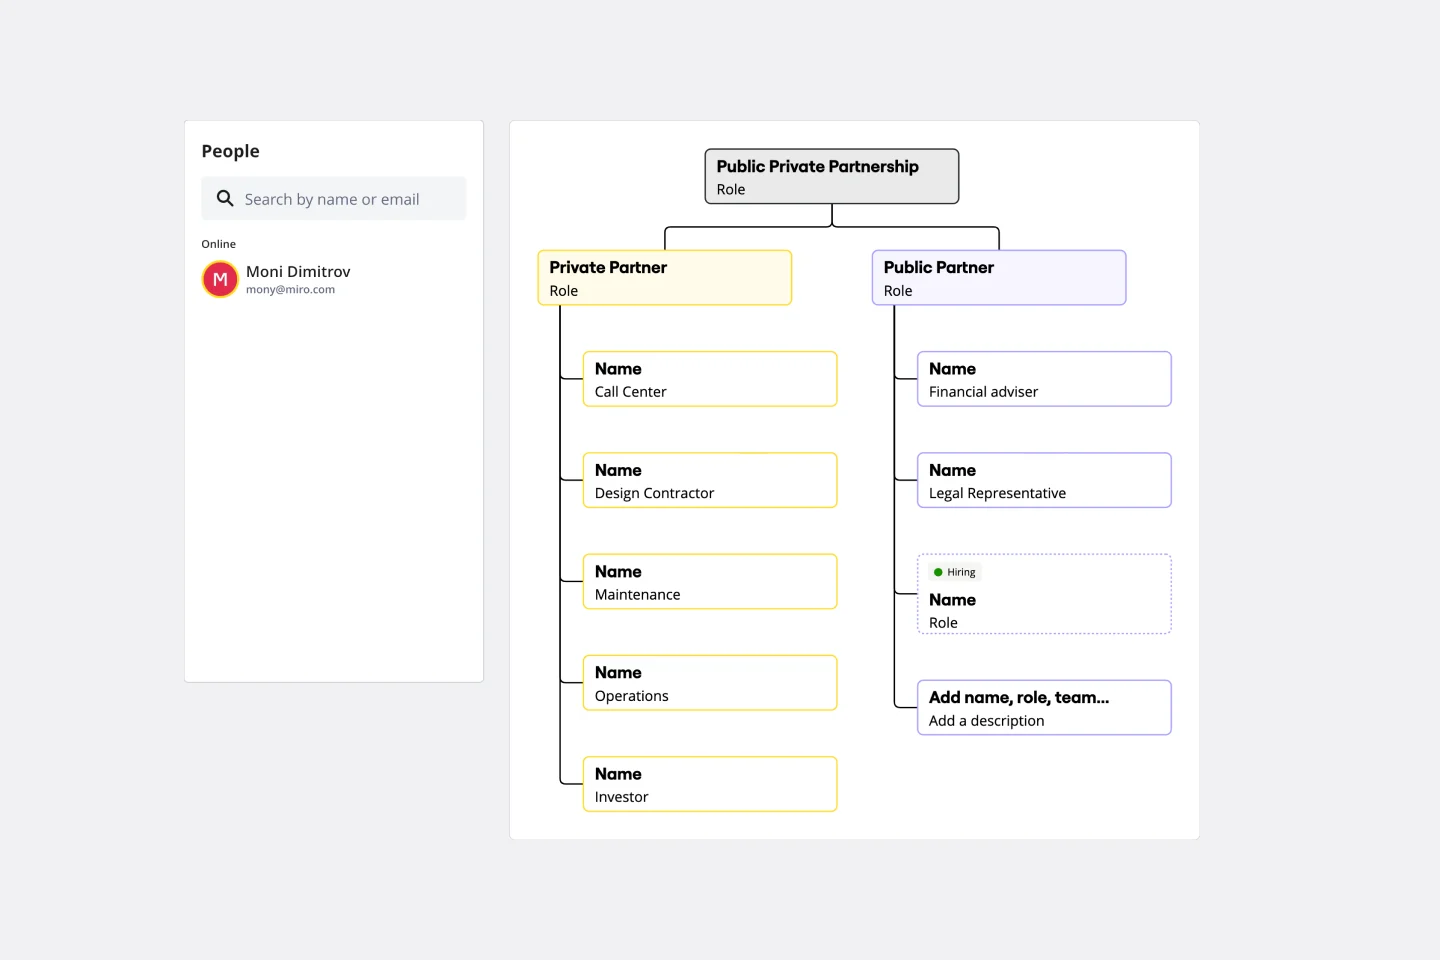
Partnership Org Chart Template
Works best for:
Org Charts, Organizational Design
The Partnership Org Chart Template is an interactive tool that visually represents the intricate network of relationships between business partners. It provides a clear and structured layout that helps users grasp how different entities align and interact within a collaborative ecosystem. One of its standout benefits is the clarity it offers. In the often complex world of inter-organizational relationships, having a straightforward, visual representation of partnerships eliminates ambiguities and ensures all stakeholders are on the same page. This fosters more effective collaboration and strategic planning, making it an essential business tool.
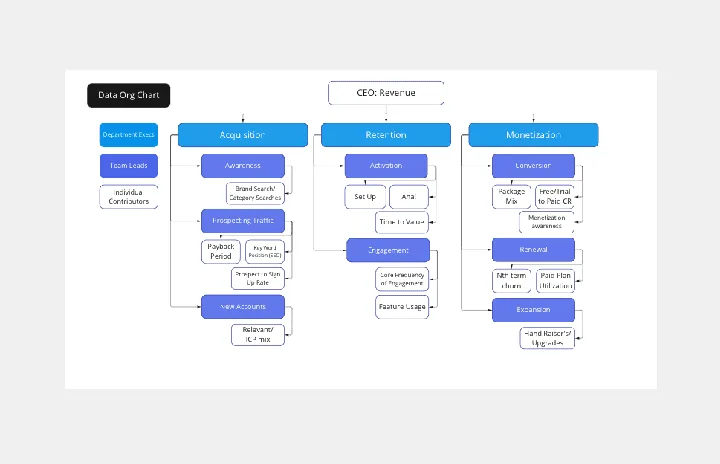
Data Org Chart
Works best for:
Org Charts, Operations, Mapping
The Data Org Chart template provides a visual representation of data-related roles and relationships within an organization. By mapping out data management responsibilities and dependencies, teams can enhance data governance and improve collaboration. With features for customizing data roles and connections, this template empowers teams to optimize data processes and ensure data integrity and compliance.
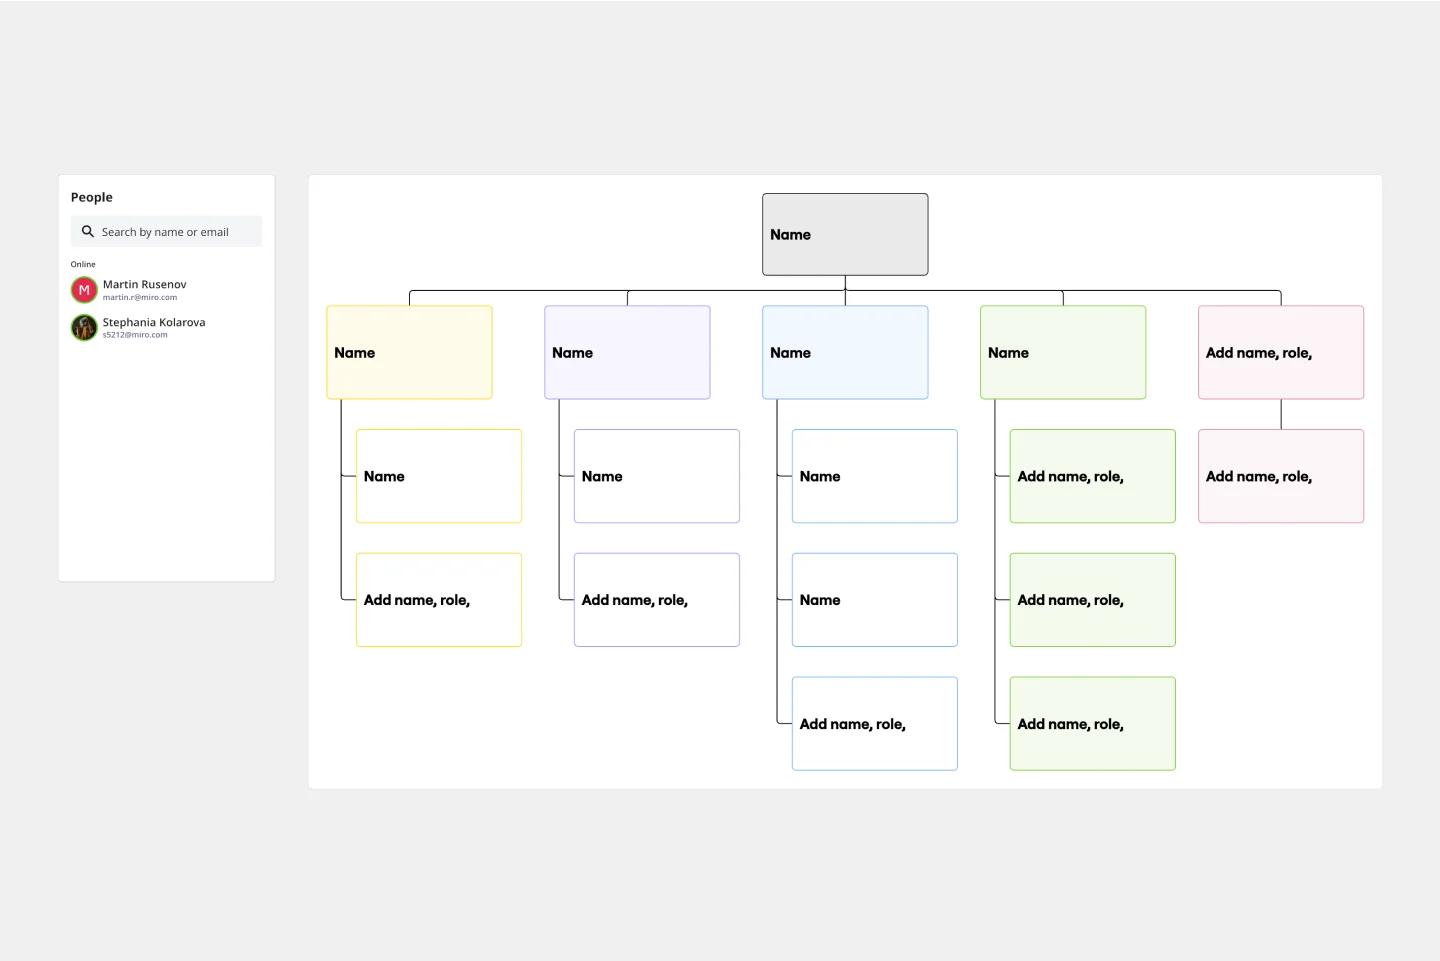
Organizational Chart Template
Works best for:
Org Charts, Operations, Mapping
Who makes up the team? What roles do they play? Who does each member report to? An organizational chart, or org chart, can answer it all at a glance. Ideal for onboarding new employees, these visual diagrams plot out company structure and the chain of command to help your team members understand reporting relationships, their role, and how they fit into the broader organization. Our template lets you choose your own chart structure and easily plot the connections between employees, roles, and departments.
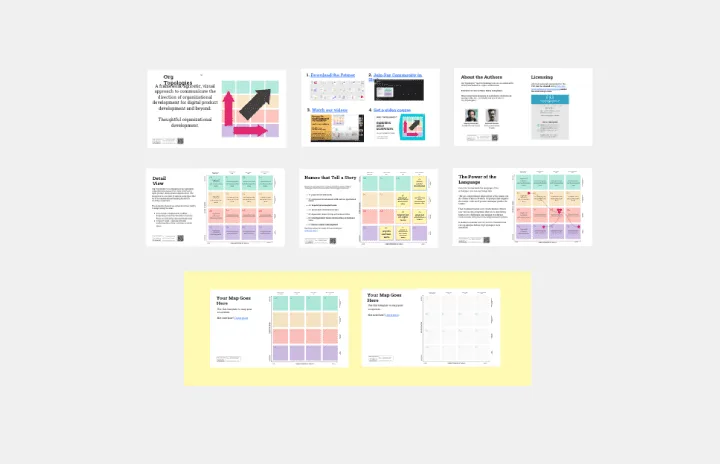
Org Topologies
Works best for:
Org Charts, Operations, Mapping
The Org Topologies™ template provides a comprehensive overview of organizational structures. By visualizing different topology models, such as hierarchical, matrix, or network structures, this template helps teams understand organizational dynamics and design effective structures. With examples and explanations of each topology, this template supports informed decision-making in organizational design.
Partnership Org Chart Template
Works best for:
Org Charts, Organizational Design
The Partnership Org Chart Template is an interactive tool that visually represents the intricate network of relationships between business partners. It provides a clear and structured layout that helps users grasp how different entities align and interact within a collaborative ecosystem. One of its standout benefits is the clarity it offers. In the often complex world of inter-organizational relationships, having a straightforward, visual representation of partnerships eliminates ambiguities and ensures all stakeholders are on the same page. This fosters more effective collaboration and strategic planning, making it an essential business tool.
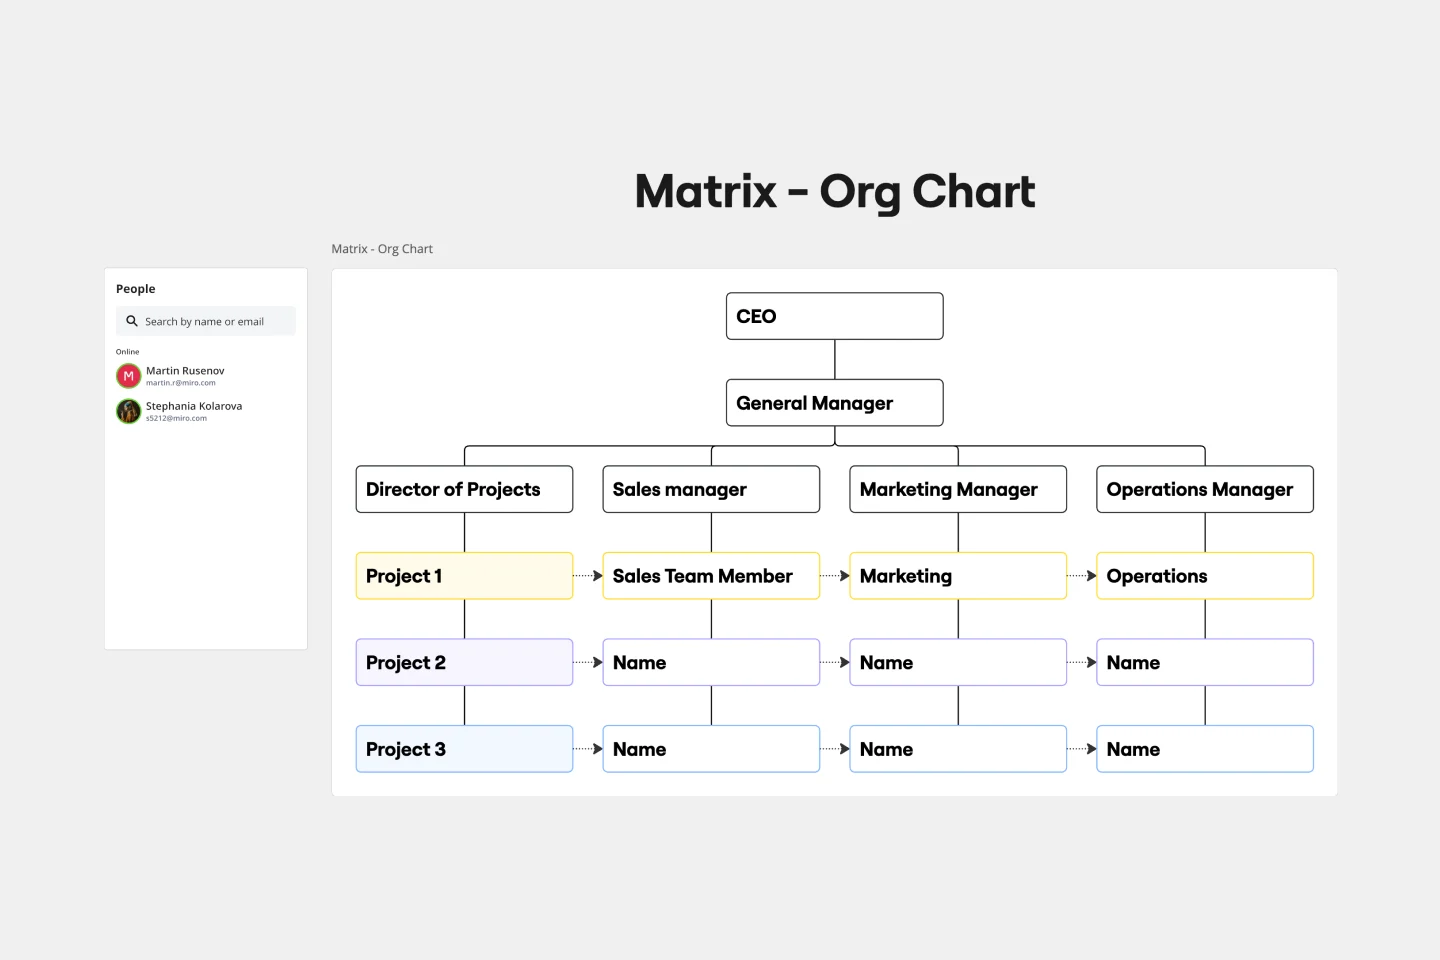
Matrix Org Chart
Works best for:
Organizational Charts, Diagramming
The matrix org chart template organizes teams efficiently and promotes effective communication. It is an essential tool for businesses that require complex decision-making capabilities and rapid response times. With this template, people can easily visualize their roles, responsibilities, and relationships within the organization, leading to improved alignment and performance.