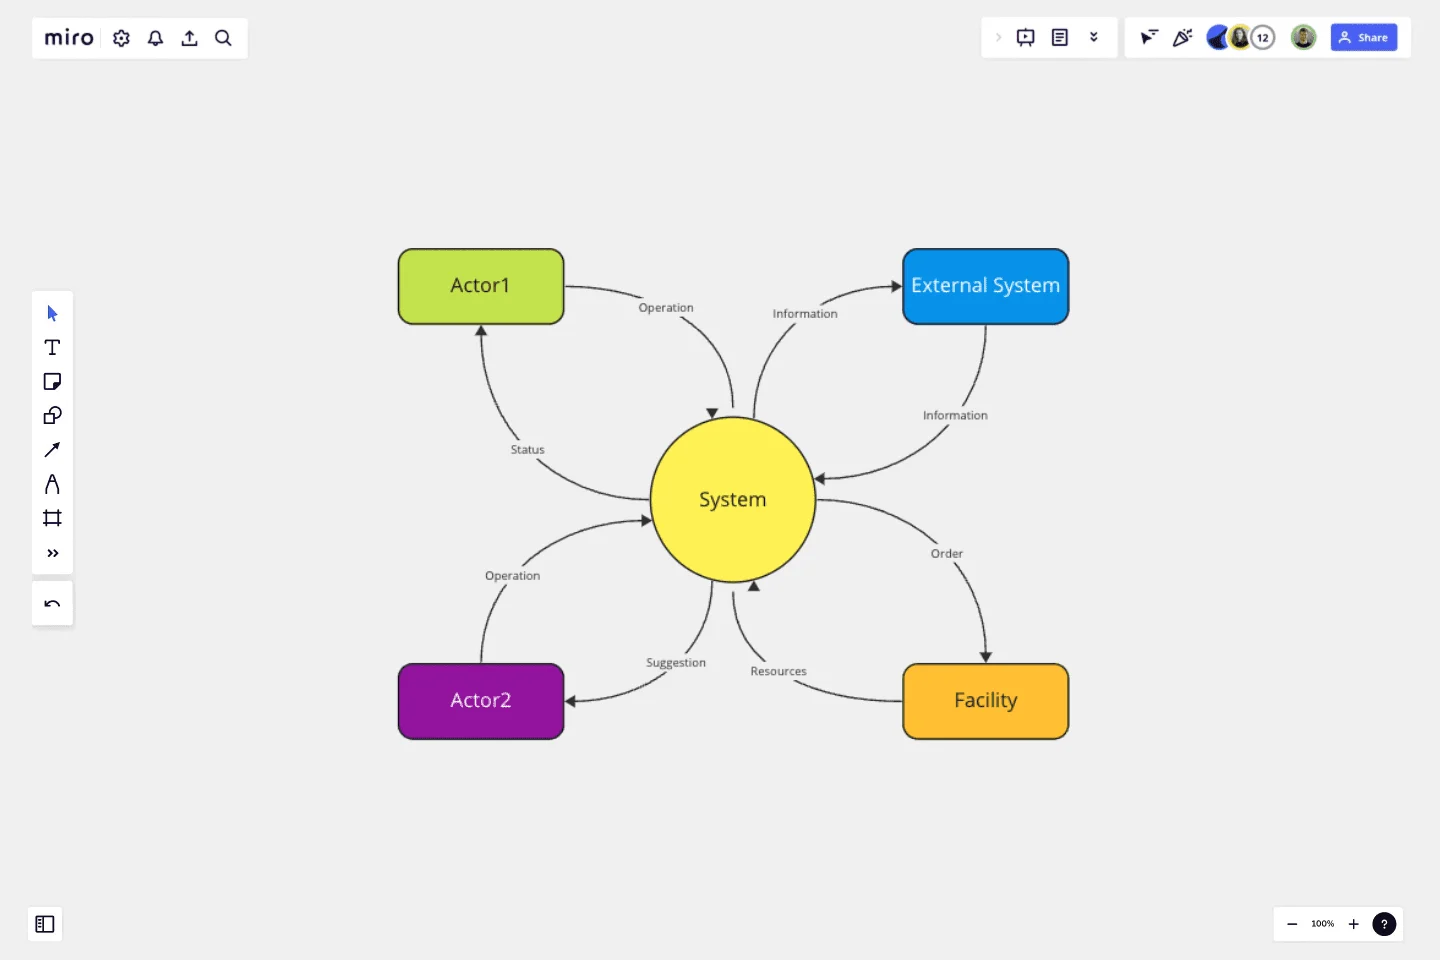
System Context Diagram
System Context Diagram often used as part of "design doc".
For Product Managers, Engineers and Stakeholders, this template is useful to figure out elements surrounding your system/product.
This template was created by Takagi Kensuke.
Get started with this template right now.
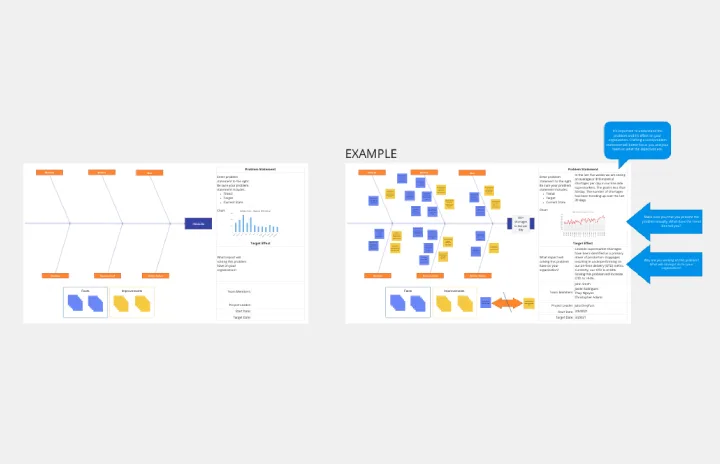
Crowd Sourced Cause and Effect
Works best for:
Fishbone Diagram, Problem solving
The Crowd Sourced Cause and Effect template leverages collective intelligence to identify root causes of problems. By involving multiple team members, you can gather diverse perspectives and uncover insights that might be overlooked. This collaborative approach ensures a comprehensive analysis and fosters team engagement.
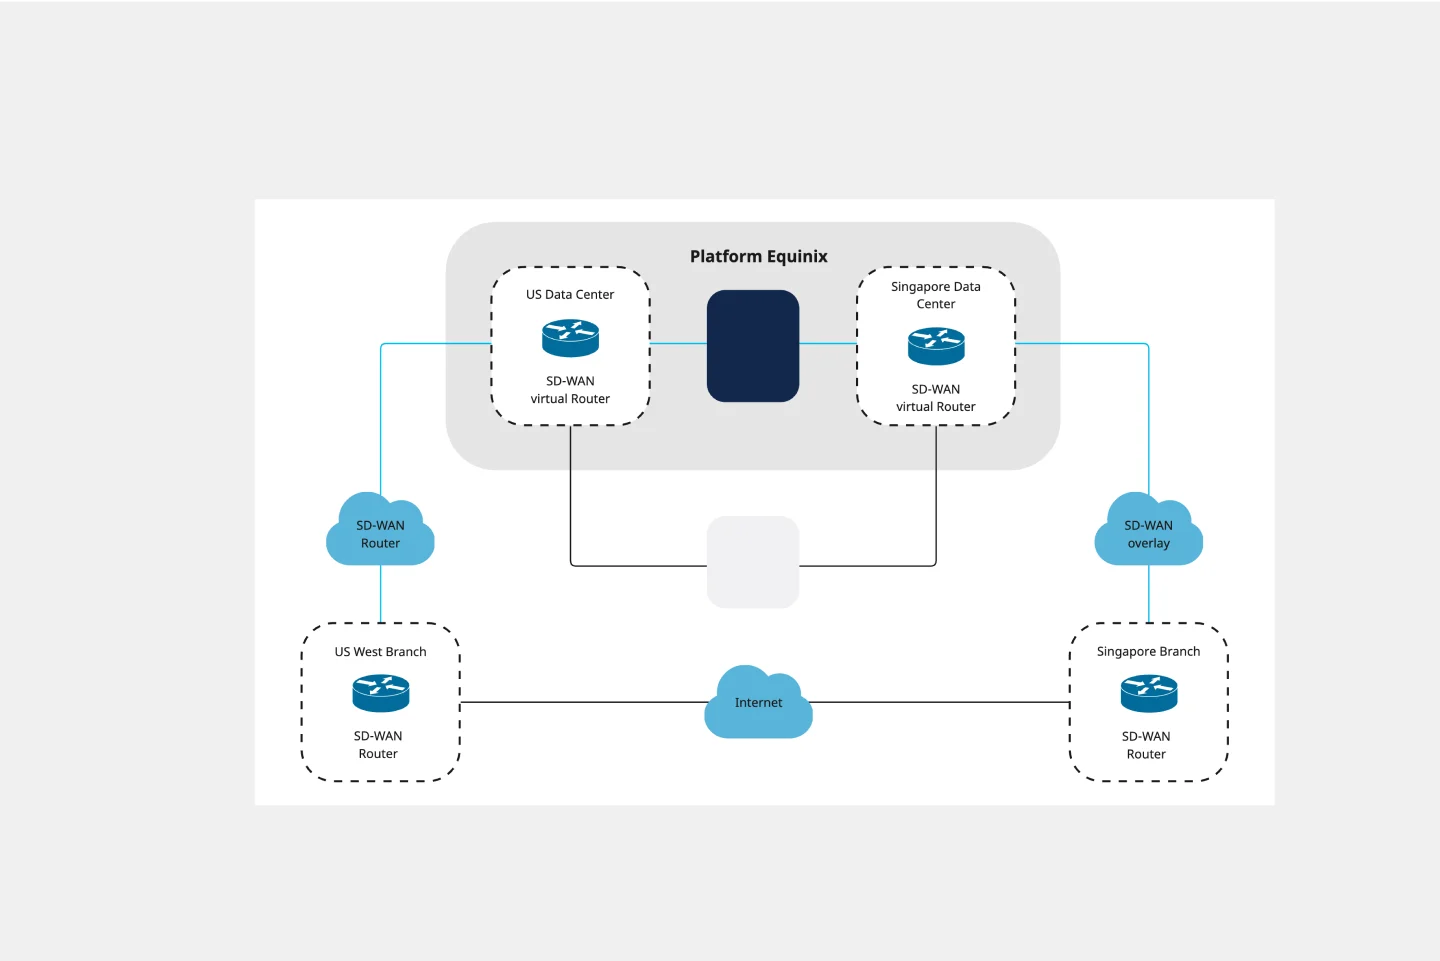
Cisco Data Network Diagram Template
Works best for:
Software Development
Cisco offers data center and access networking solutions built for scale with industry-leading automation, programmability, and real-time visibility. The Cisco Data Network Diagram uses Cisco elements to show the network design of Cisco Data Networks visually.
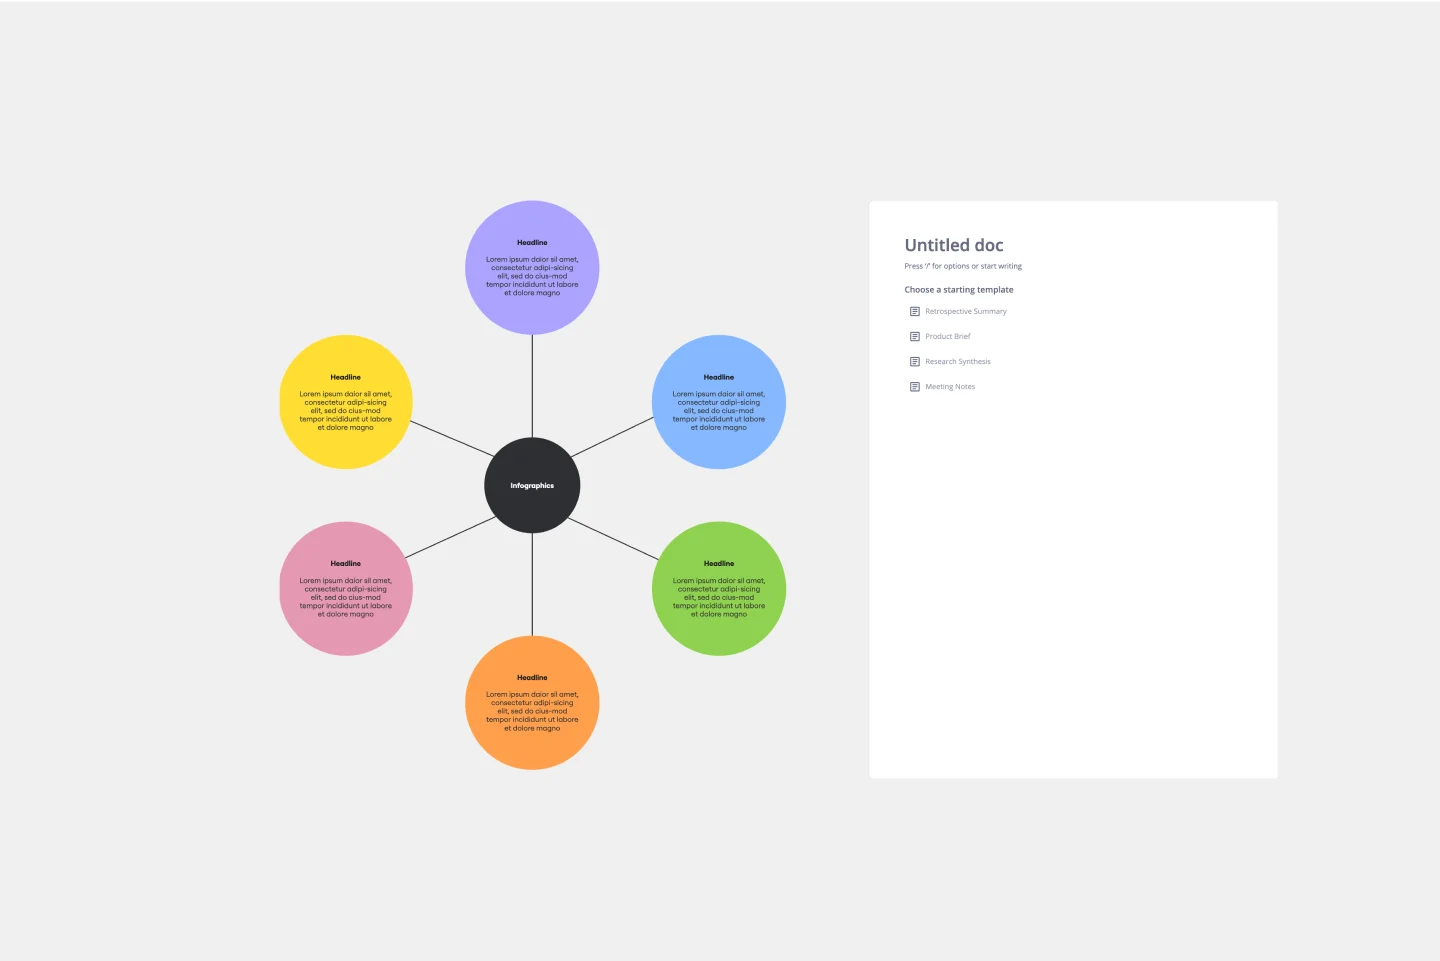
Web Diagram Template
Miro's Web Diagram Template simplifies complex project organization and promotes effective communication. It allows users to easily connect elements and gain a comprehensive understanding of complex relationships, making it a versatile and invaluable asset for diverse projects.
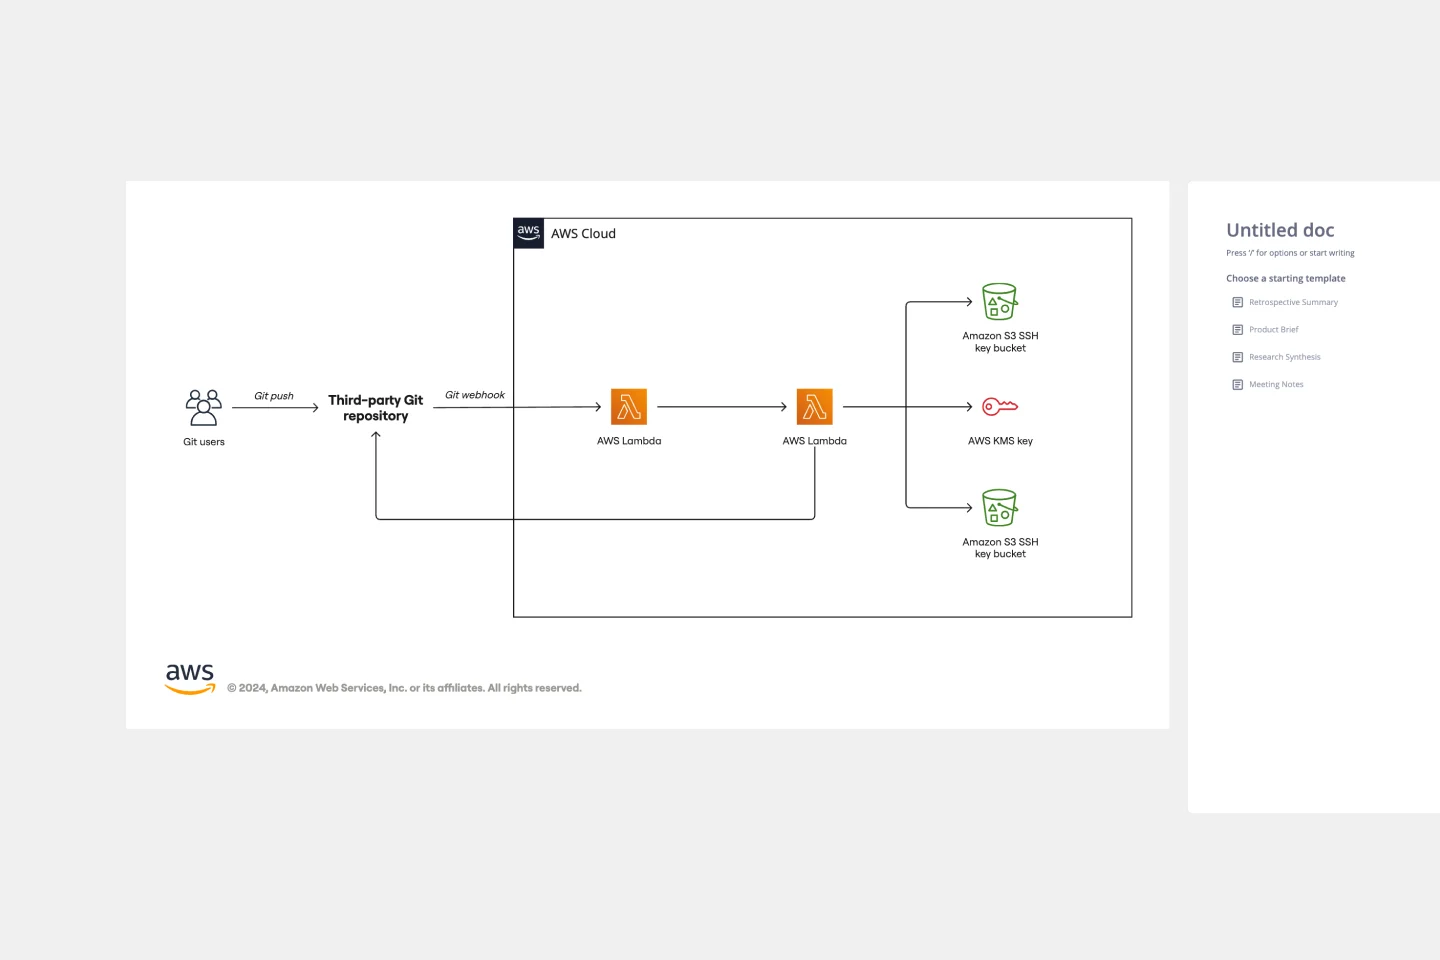
AWS Git to S3 Webhooks Template
Works best for:
Software Development, Diagrams
The AWS Git to S3 Webhooks Template is a visual representation of Git webhooks with AWS services Quick Start architecture. You can now have an overview of your AWS architecture with Miro’s AWS Git to S3 Webhooks Template, track your cloud solutions easily, and optimize processes like never before.
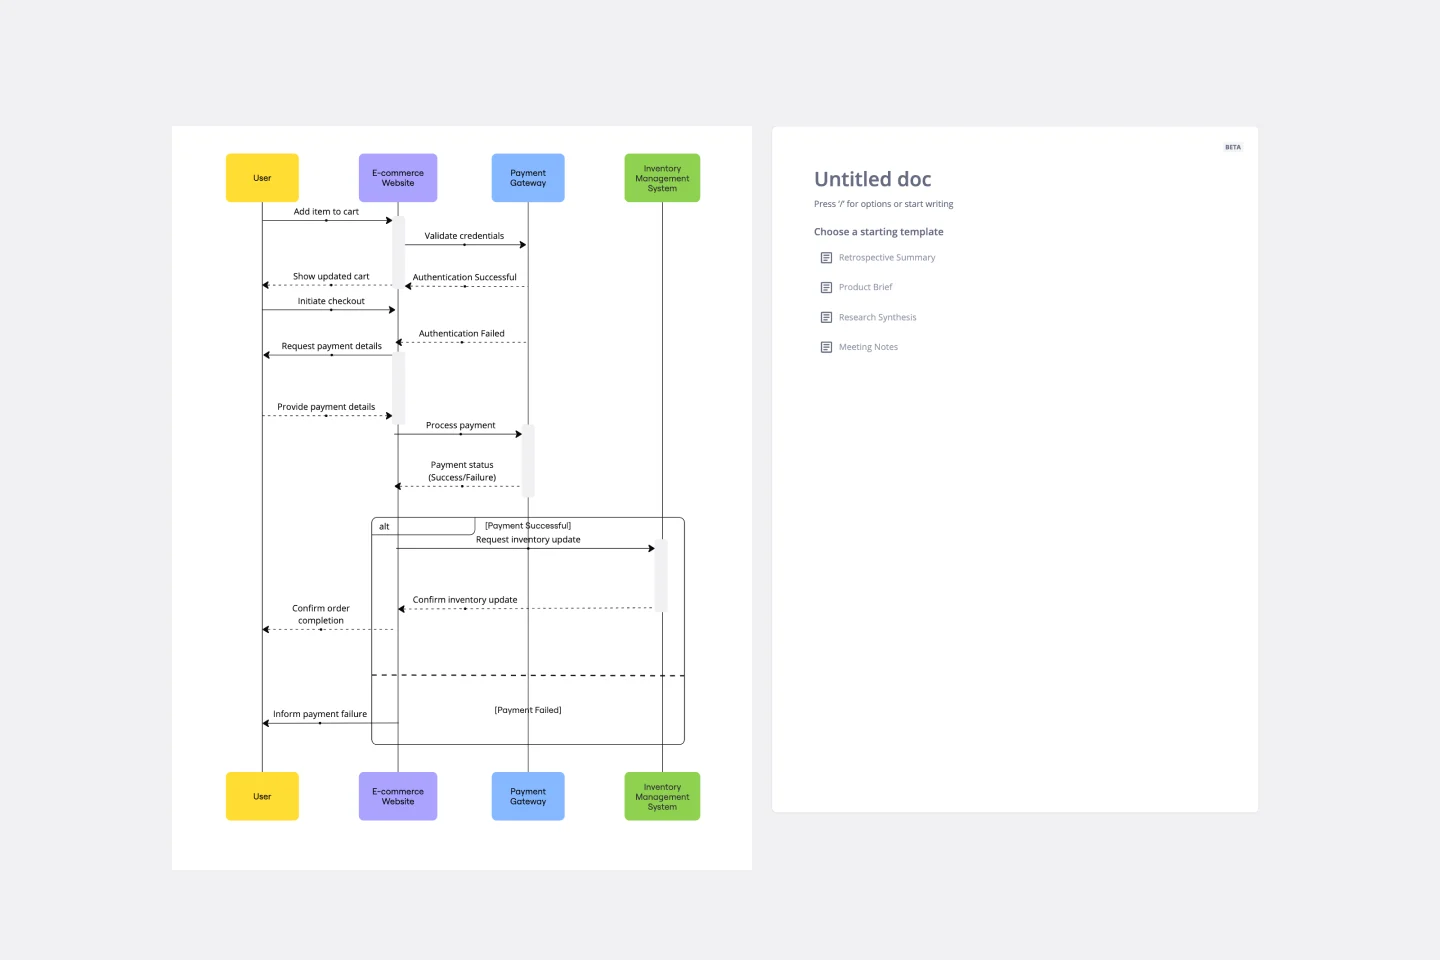
UML Sequence E-commerce Checkout Template
Works best for:
UML
The UML Sequence E-commerce Checkout Template in Miro is a versatile tool for visualizing and analyzing e-commerce checkout processes. It provides a step-by-step visual representation of system interactions, is highly customizable, supports real-time collaboration, and is suitable for various e-commerce platforms. It serves as an efficient documentation tool, fosters team collaboration, and contributes to a more streamlined checkout experience for customers.
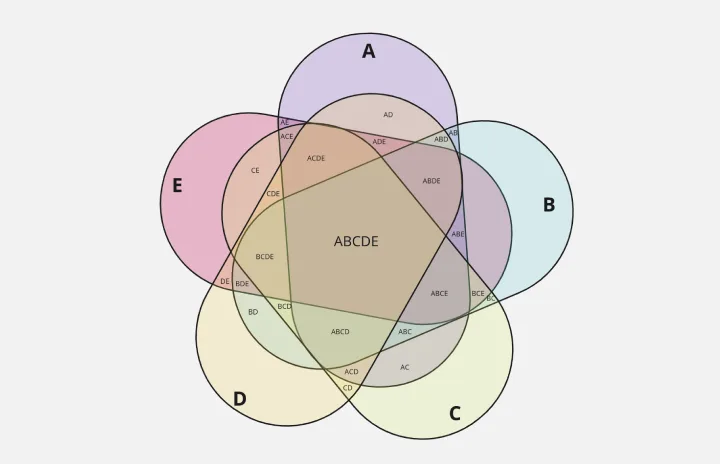
5-Set Venn Diagram
Works best for:
Venn Diagram
Analyze complex data with the 5 Set Venn Diagram template. This tool allows you to compare and contrast five different sets of data, highlighting intersections and unique elements. Perfect for in-depth data analysis, research, and strategic planning. Ideal for analysts, researchers, and educators looking to present comprehensive data insights in a clear and visual manner.