Stakeholder Mapping Template
Identify and map out the people involved in a project with the stakeholder map template. Easily get buy-in and accomplish your goals.
About the Stakeholder Mapping Template
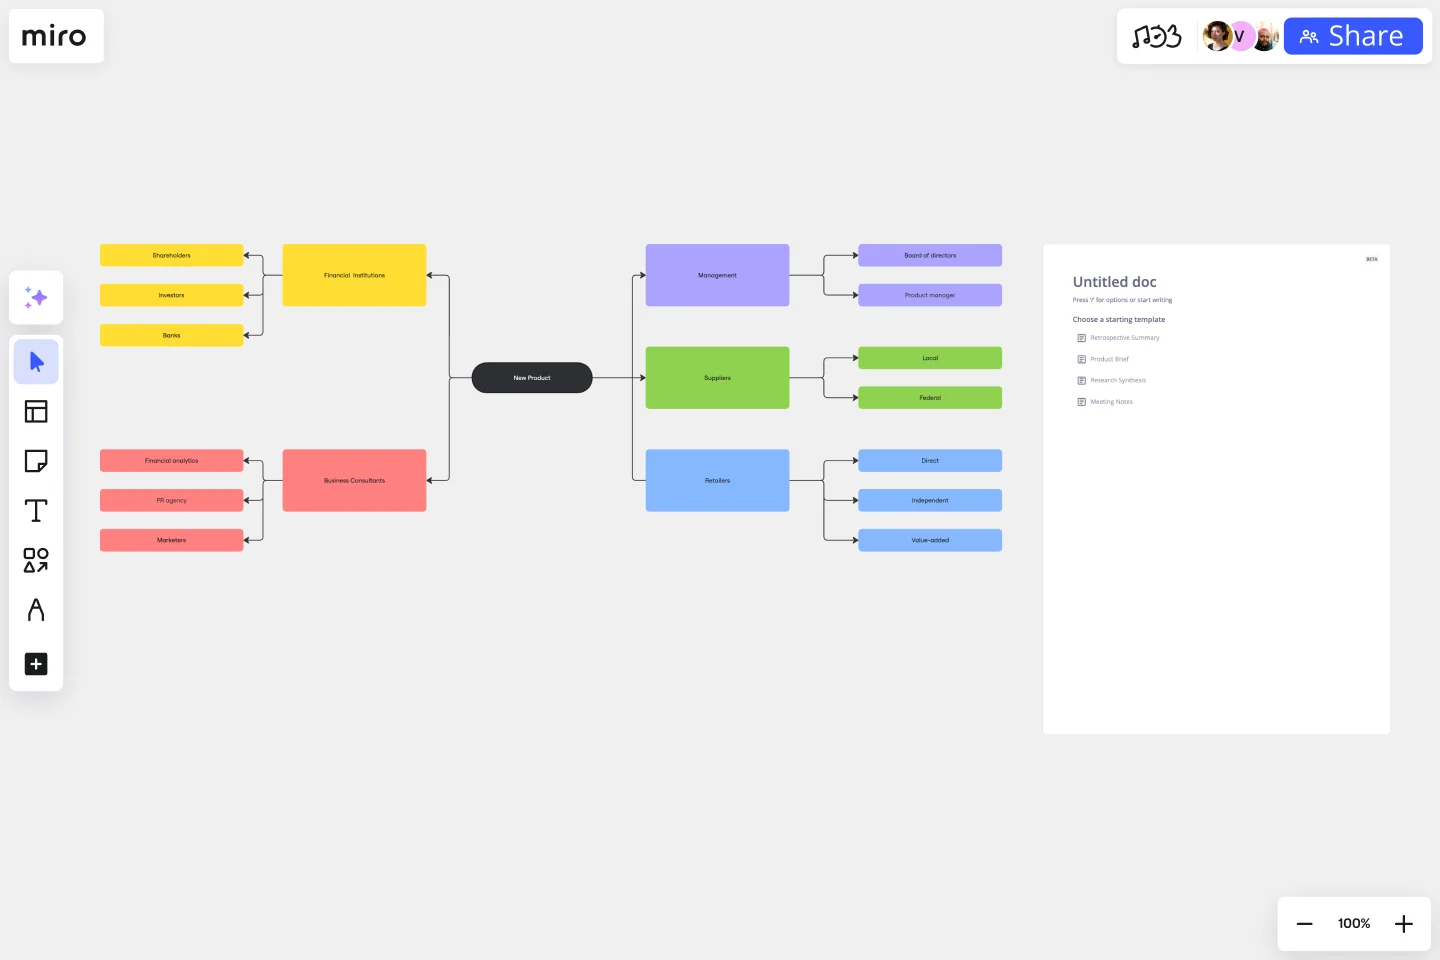
A stakeholder map is a visual tool that helps you categorize people based on their power and interests. This enables you to understand how they may influence your project or have an interest in your product or idea.
However, it is important to note that stakeholder mapping only focuses on the hierarchies within your organization, and it's a widely used project management tool at the beginning of a project. Doing it early can prevent miscommunication, ensure all groups are aligned on objectives, and set expectations about outcomes and results.
How to use the stakeholder map template in Miro
Here are the steps to follow when creating a stakeholder map:
Identify stakeholders: Begin by identifying the stakeholders relevant to your project or scenario. These could be people, groups, or organizations interested in your initiative.
Easy edititing: Double-click on each shape to add or edit content. Here, you can add details such as the stakeholder's name, role, relationship to the project, and any other relevant information.
Make it your own: Use Miro's automated diagramming features to expand your stakeholder map and categorize them accordingly.
Invite everyone to join you: If you're working with a team, use Miro's collaboration features to invite team members to the board. This enables real-time collaboration and input.
Comments and annotations: Encourage team members to add comments or annotations to the Stakeholder Map. This helps capture additional insights and perspectives.
By following these steps, you can create a comprehensive stakeholder map that includes all relevant people and groups and captures different perspectives and insights.
Why should you use a stakeholder mapping template?
Imagine starting a new project and wanting it to be as successful as possible. You should start asking these questions: Who should you involve? Who should you keep updated? Who is likely to have questions or objections?
That’s when the stakeholder mapping template comes in quite handy from the start, so you can manage stakeholders and assertively communicate with them to move your project forward.
Here are three benefits of stakeholder mapping:
Define your projects well
Stakeholders aren’t just your allies – they can also deliver insights and advice that help you shape your project. When you involve a diverse group of stakeholders from the start, they will help you create the best outline and plan for your project that will set it up for success.
Create a shared understanding from early on
Once you understand your stakeholders and who they are, you can communicate early and often develop a shared understanding of your project. If they grasp the benefits, they are more likely to support you down the line.
Secure resources
Often, stakeholders are the ones who hold the purse strings or have the necessary influence for getting you the resources you need. A stakeholder map will help you identify these individuals more quickly.
With Miro's easy-to-use strategic group mapping tools it's easy to visualize your competitive scenario.
What should a stakeholder map include?
Stakeholder maps include primarily a diagram of the people involved, interested, or signing off on your project. It can contain internal or external stakeholders and people who should be informed or consulted about your project’s development.
How can I ensure that the stakeholder map remains relevant and up-to-date?
It's important to regularly review and update the stakeholder map, especially when there are changes in organizational strategy, goals, or stakeholder relationships. This will help ensure that the map remains accurate and effective.
Get started with this template right now.
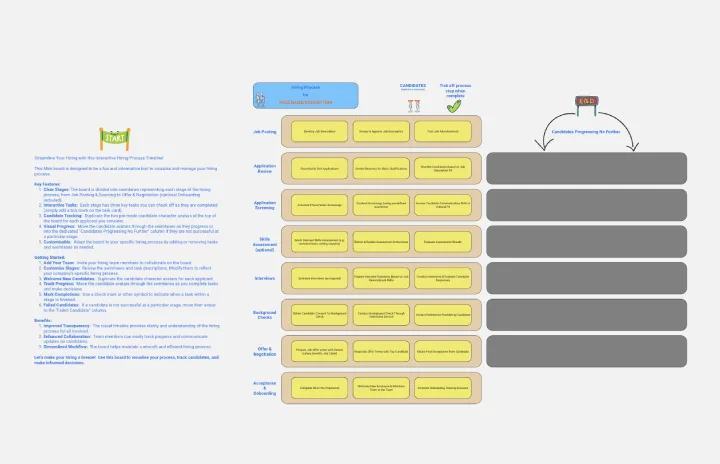
Hiring Process Timeline
Works best for:
Timeline, Planning
Simplify your hiring process with the Hiring Process Timeline template. This tool helps you map out each step of your recruitment process, from job posting to onboarding. Visualize deadlines, track candidate progress, and ensure a smooth and efficient hiring experience. Perfect for HR teams looking to streamline and enhance their recruitment strategy.
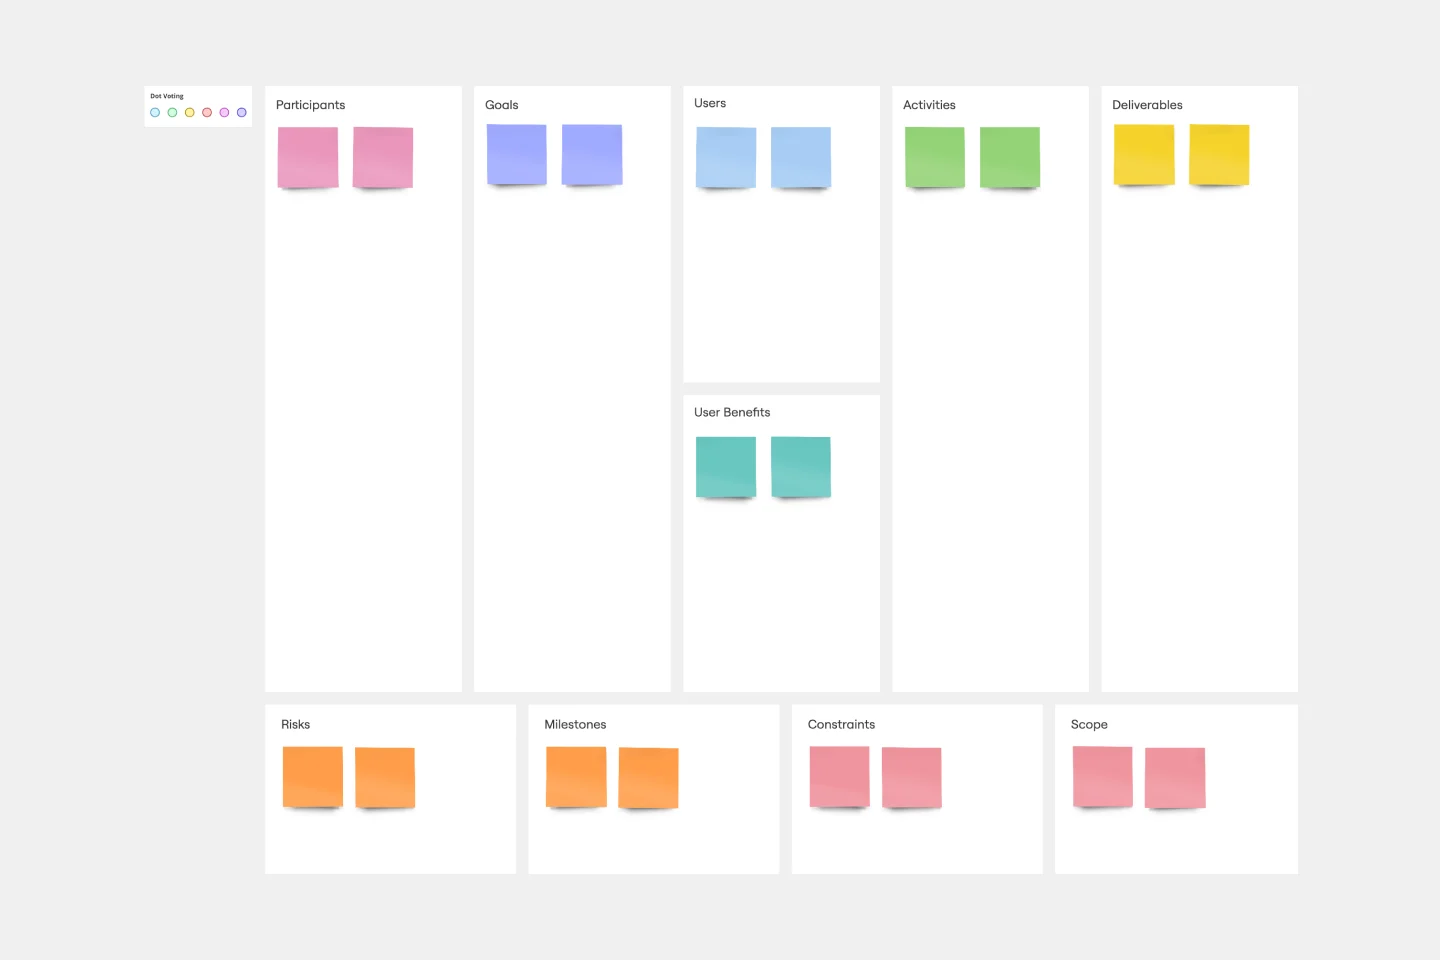
UX Project Canvas Template
Works best for:
User Experience, UX Design, Market Research
Inspired by Alexander Osterwalder's 2005 business model canvas, the project canvas will help your team visualize the big picture of your UX and design projects, providing a convenient structure that holds all of your important data. This innovative tool enables you to transform an idea into a project plan, stimulating collaboration and communication between collaborators. Unlike alternative models, the project canvas is a simple interface. There are few startup costs, and employees can easily be brought up to speed to start using the canvas quickly.
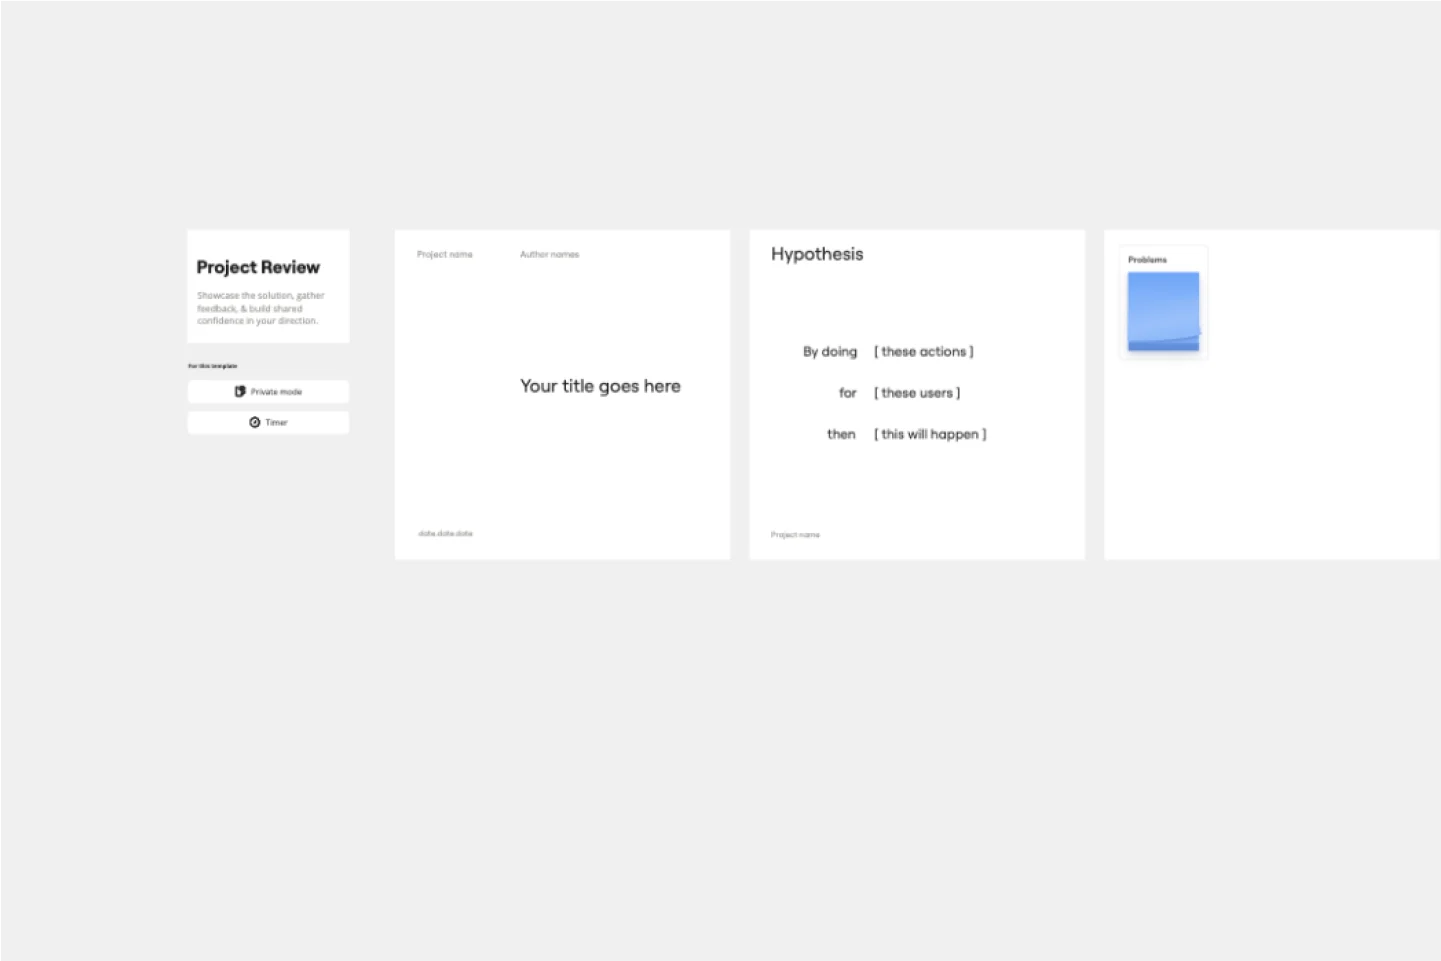
Project Review Template
Works best for:
Project Management, Project Review
The Intelligent Project Review Template in Miro is a game-changer for project management. It combines AI-driven insights with interactive features to streamline the review process, making it more efficient and collaborative. One key benefit of this template is its ability to enhance team alignment. By providing a structured format for documenting timelines, hypotheses, target audiences, success metrics, and potential blockers, it ensures that all stakeholders are on the same page, fostering a shared understanding and confidence in the project's direction.
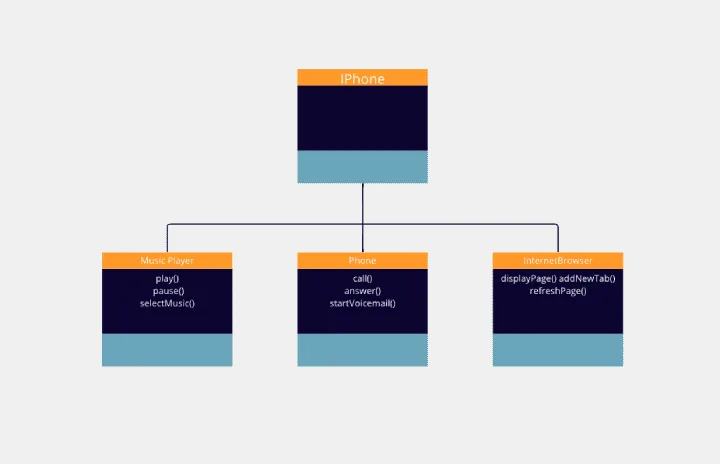
Challenge - UML Iphone
Works best for:
Diagramming
The Challenge UML Iphone template offers a visual framework for designing and modeling iPhone app challenges and solutions using UML (Unified Modeling Language). It provides elements for defining app functionalities, user interactions, and system architecture. This template enables teams to brainstorm ideas, document requirements, and visualize app designs, facilitating collaboration and innovation. By promoting clarity and alignment, the Challenge - UML Iphone template empowers teams to design iPhone apps that meet user needs and deliver exceptional user experiences.
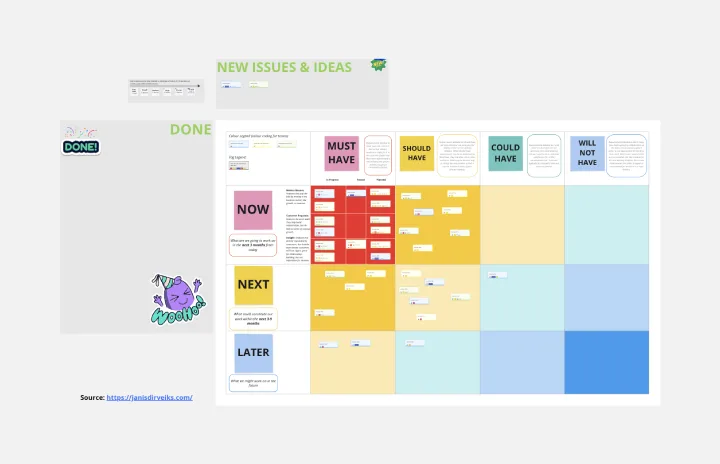
Prioritized Product Roadmap
Works best for:
Roadmap, Mapping, Planning
The Prioritized Product Roadmap template enables teams to focus on delivering the most valuable features to customers. By prioritizing initiatives based on impact and effort, teams can maximize the return on investment and drive business value. This template fosters collaboration and alignment, ensuring that development efforts are aligned with strategic objectives and customer needs.
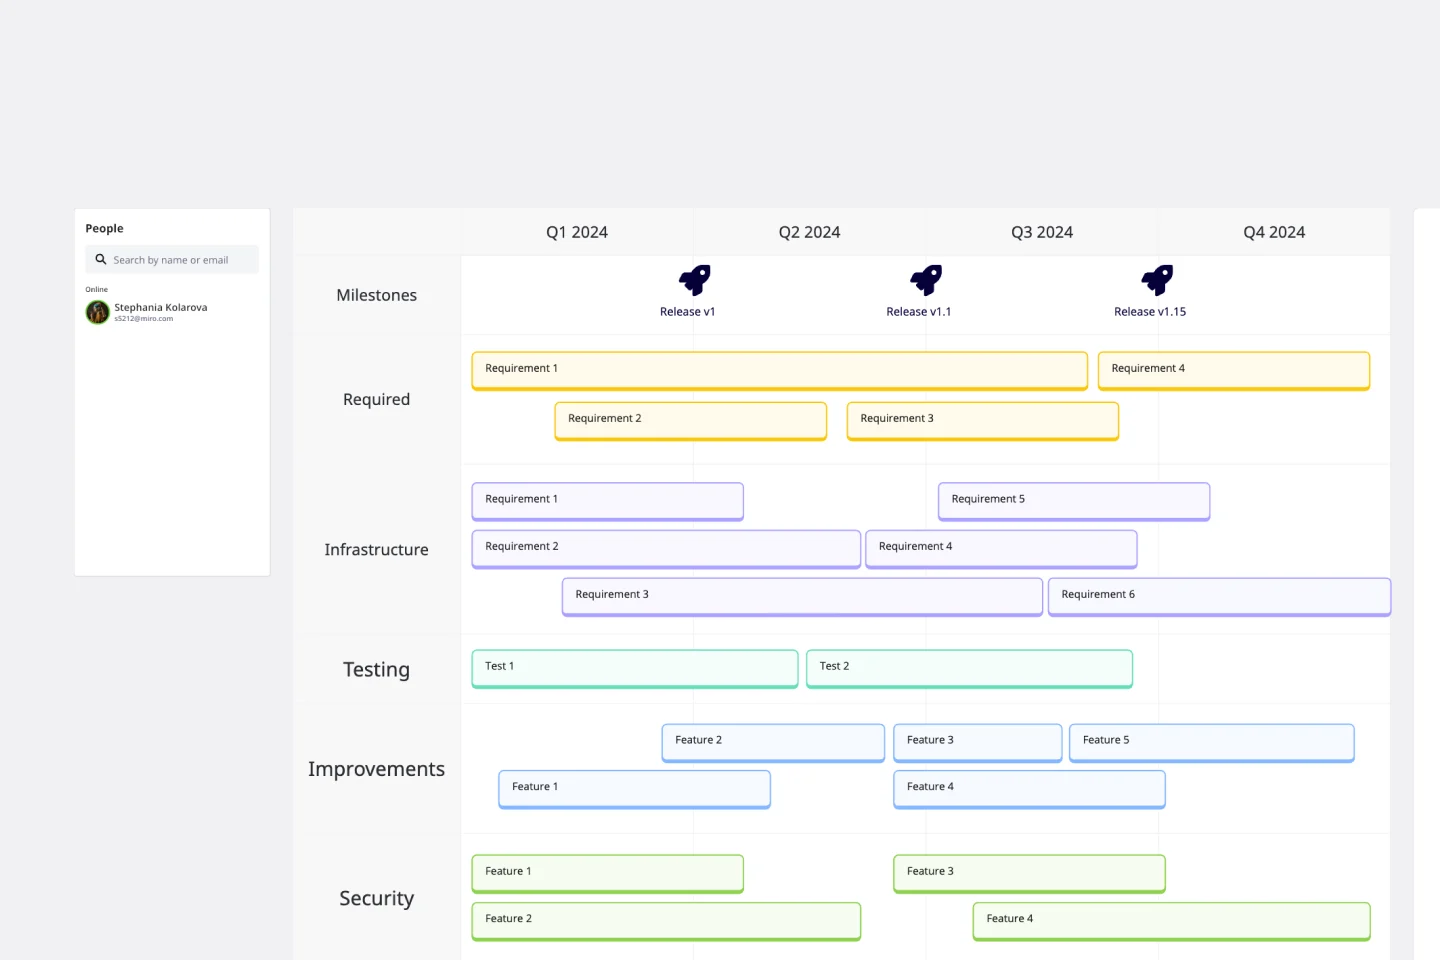
Technology Roadmap Template
Works best for:
Agile Methodology, Roadmaps, Agile Workflows
A technology roadmap helps teams document the rationale of when, why, how, and what tech-related solutions can help the company move forward. Also known as IT roadmaps, technology roadmaps show teams what technology is available to them, focusing on to-be-scheduled improvements. They allow you to identify gaps or overlap between phased-out tech tools, as well as software or programs soon to be installed. From a practical point of view, the roadmap should also outline what kinds of tools are best to spend money on, and the most effective way to introduce new systems and processes.