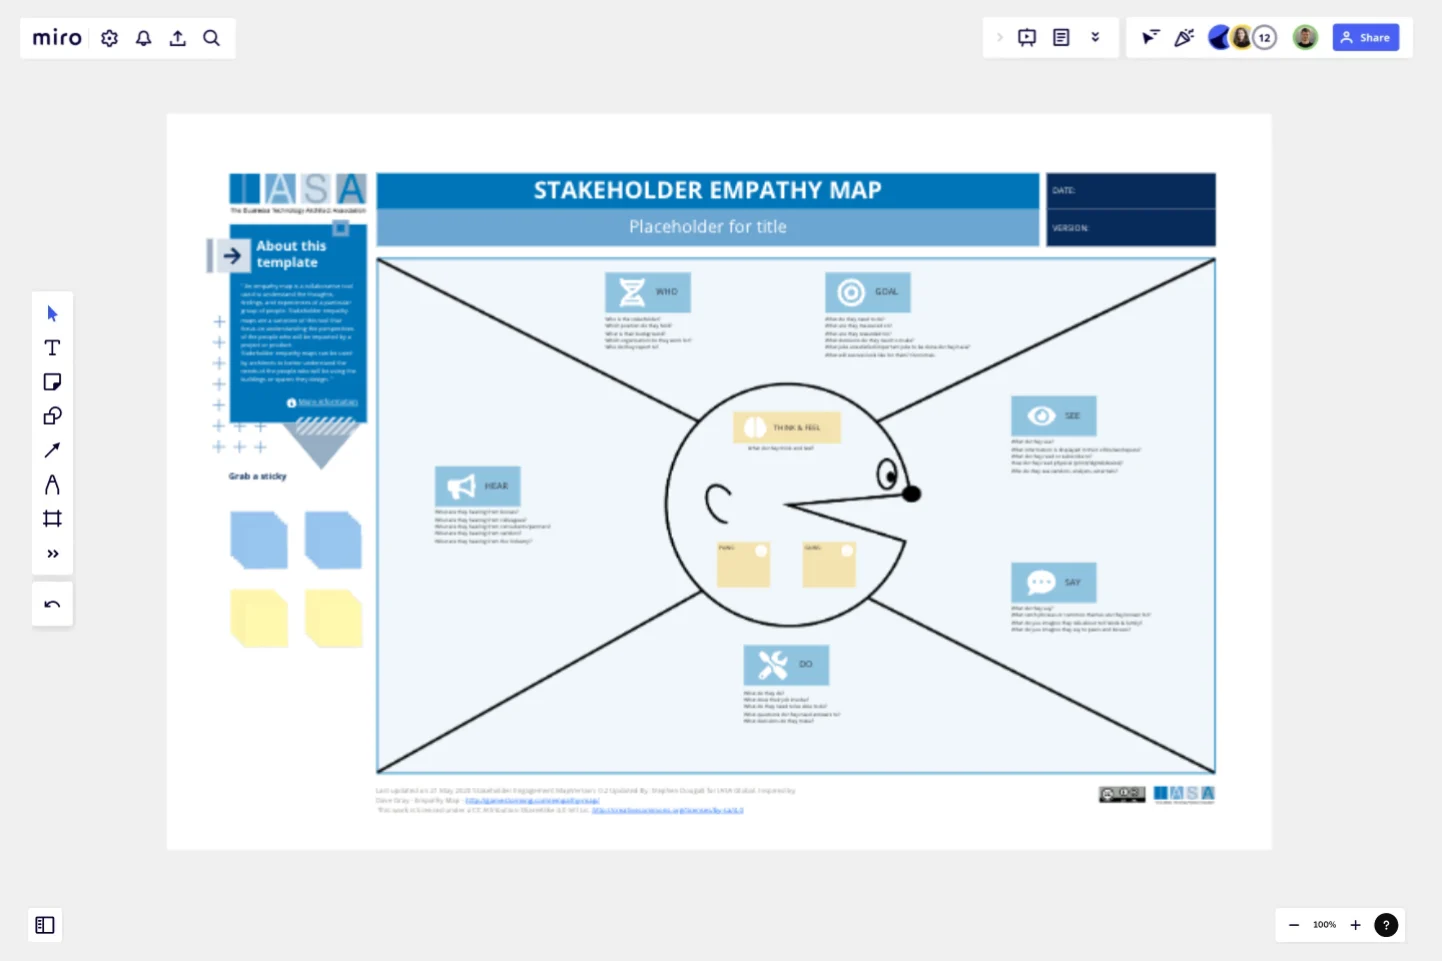
Stakeholder Empathy Map by IASA
An empathy map is a collaborative tool used to understand the thoughts, feelings, and experiences of a particular group of people.
Stakeholder empathy maps are a variation of this tool that focus on understanding the perspectives of the people who will be impacted by a project or product.
Stakeholder empathy maps can be used by architects to better understand the needs of the people who will be using the buildings or spaces they design. This can help them to create designs that are more functional, user-friendly, and meet the needs of all stakeholders.
How to use this canvas
Identify your stakeholders. The first step is to identify all of the people who will be impacted by your project. This could include clients, users, employees, regulators, and the community.
Fill out the map. The stakeholder empathy map is typically divided into four quadrants: See, Hear, Say, and Do. In each quadrant, you should brainstorm what your stakeholders see, hear, say, and do in relation to your project. For example, in the See quadrant, you might list things like the project plans, the construction site, and the finished building. In the Hear quadrant, you might list things like conversations with the architect, presentations about the project, and feedback from the community.
Analyze the data. Once you have filled out the map, take some time to analyze the data. What are the common themes? What are the key needs and concerns of your stakeholders?
Use the insights to inform your design. The insights from your stakeholder empathy map can be used to inform your design decisions. For example, if you learn that your stakeholders are concerned about the amount of traffic that the project will generate, you may need to design a plan to mitigate that impact.
This template was created by IASA.
Get started with this template right now.
Empathy Map Pro
Works best for:
Market Research, Research & Design
Empathy Map Pro helps you dive deeper into understanding your users. By exploring their thoughts, feelings, and experiences, you can create more effective solutions tailored to their needs. This advanced template is perfect for product development teams aiming to enhance user satisfaction and drive innovation.
Empathy Map by Invoke
Works best for:
Market Research, Research & Design
The Empathy Map template is perfect for understanding user behavior and motivations. It helps teams capture insights into what users think, feel, and do, ensuring your designs meet their needs. Ideal for UX and product teams.
Service Blueprint to the Metaverse
Works best for:
Research & Design
Explore the future of service design with the Service Blueprint to the Metaverse. This template helps you map out service experiences within virtual environments. Use it to visualize interactions, identify opportunities, and plan seamless service delivery in the metaverse. Ideal for teams looking to innovate and expand their services into virtual and augmented reality spaces, enhancing customer engagement and satisfaction.
5E Service Blueprint
Works best for:
Research & Design
Enhance your service design with the 5E Service Blueprint template. This tool helps you visualize the five key stages of the customer journey: Entice, Enter, Engage, Exit, and Extend. Use it to map out touchpoints, identify pain points, and optimize the overall service experience. Ideal for creating a comprehensive view of customer interactions and improving service delivery at every stage.
Example Mapping Template
Works best for:
Product Management, Mapping, Diagrams
To update your product in valuable ways—to recognize problem areas, add features, and make needed improvements—you have to walk in your users’ shoes. Example mapping (or user story mapping) can give you that perspective by helping cross-functional teams identify how users behave in different situations. These user stories are ideal for helping organizations form a development plan for Sprint planning or define the minimum amount of features needed to be valuable to customers.
iPhone App Template
Works best for:
UX Design, Desk Research, Wireframes
Incredible percentages of smartphone users worldwide have chosen iPhones (including some of your existing and potential customers), and those users simply love their apps. But designing and creating an iPhone app from scratch can be one seriously daunting, effort-intensive task. Not here — this template makes it easy. You’ll be able to customize designs, create interactive protocols, share with your collaborators, iterate as a team, and ultimately develop an iPhone app your customers will love.
