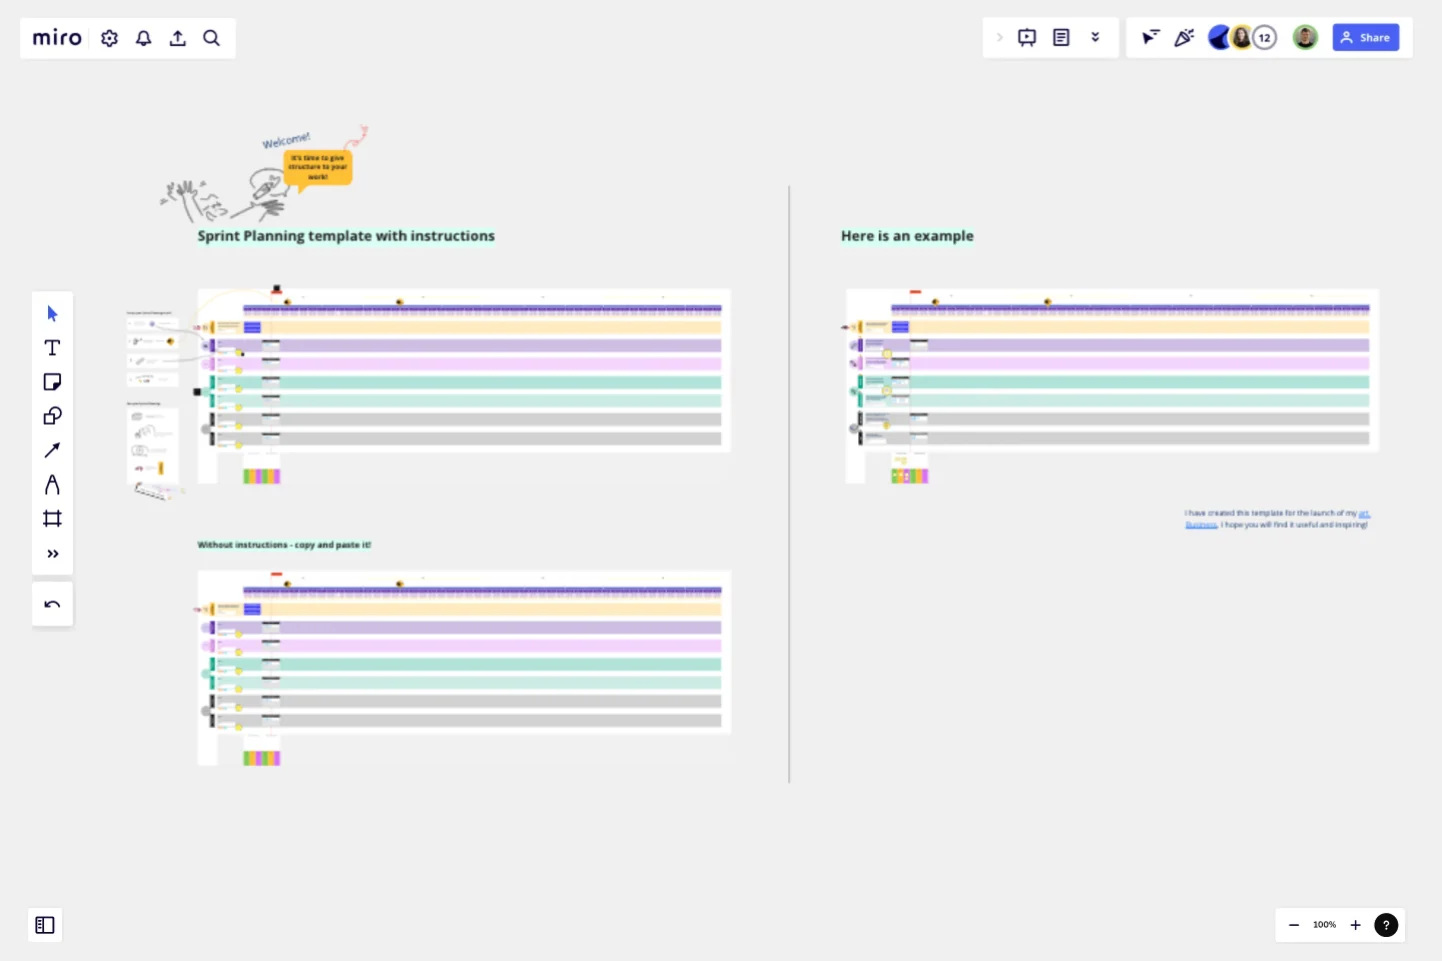
Sprint Planning by Piera Mattioli
The Sprint Planning board has been designed to enable every person or team to have a structured way of working and to achieve specific goals by defining weekly/ biweekly/ monthly tasks, and by creating moments of reflections.
How to set up the Sprint Planning board:
1. Define your workstreams/ projects, make it visual and select an icon to easily recognize it!
2. For each workstream/ project write down the goal you are trying to achieve;
3. How will you measure success? Define key results for each workstream/ project;
4. If needed prioritize workstreams/ projects.
How to run your Sprint Planning meeting:
1. Define your cadence, you might have Sprint Planning weekly, biweekly or monthly. If in a team, assign a team member to facilitate the meeting;
2. Always take the time to reflect on the previous Sprint, only by cultivating this habit you can improve your way of working!
3. Design your agenda and make it fun for the people to participate by adding an ice breaker that can foster connection!
This template was created by Piera Mattioli.
Get started with this template right now.
Corrective Action Plan Template
Works best for:
Project Management, Operations, Strategic Planning
For a manager or HR leader, it’s the least fun part of the job: Documenting an employee’s performance issues and talking about them directly to that employee. A corrective action plan makes that tough task a little easier by putting issues into a professional, written framework. That way the process, next steps, and details of the conversations are all clearly documented. This template will enable you to eliminate murky communication, align on expectations, and provide step-by-step instructions for your employee.
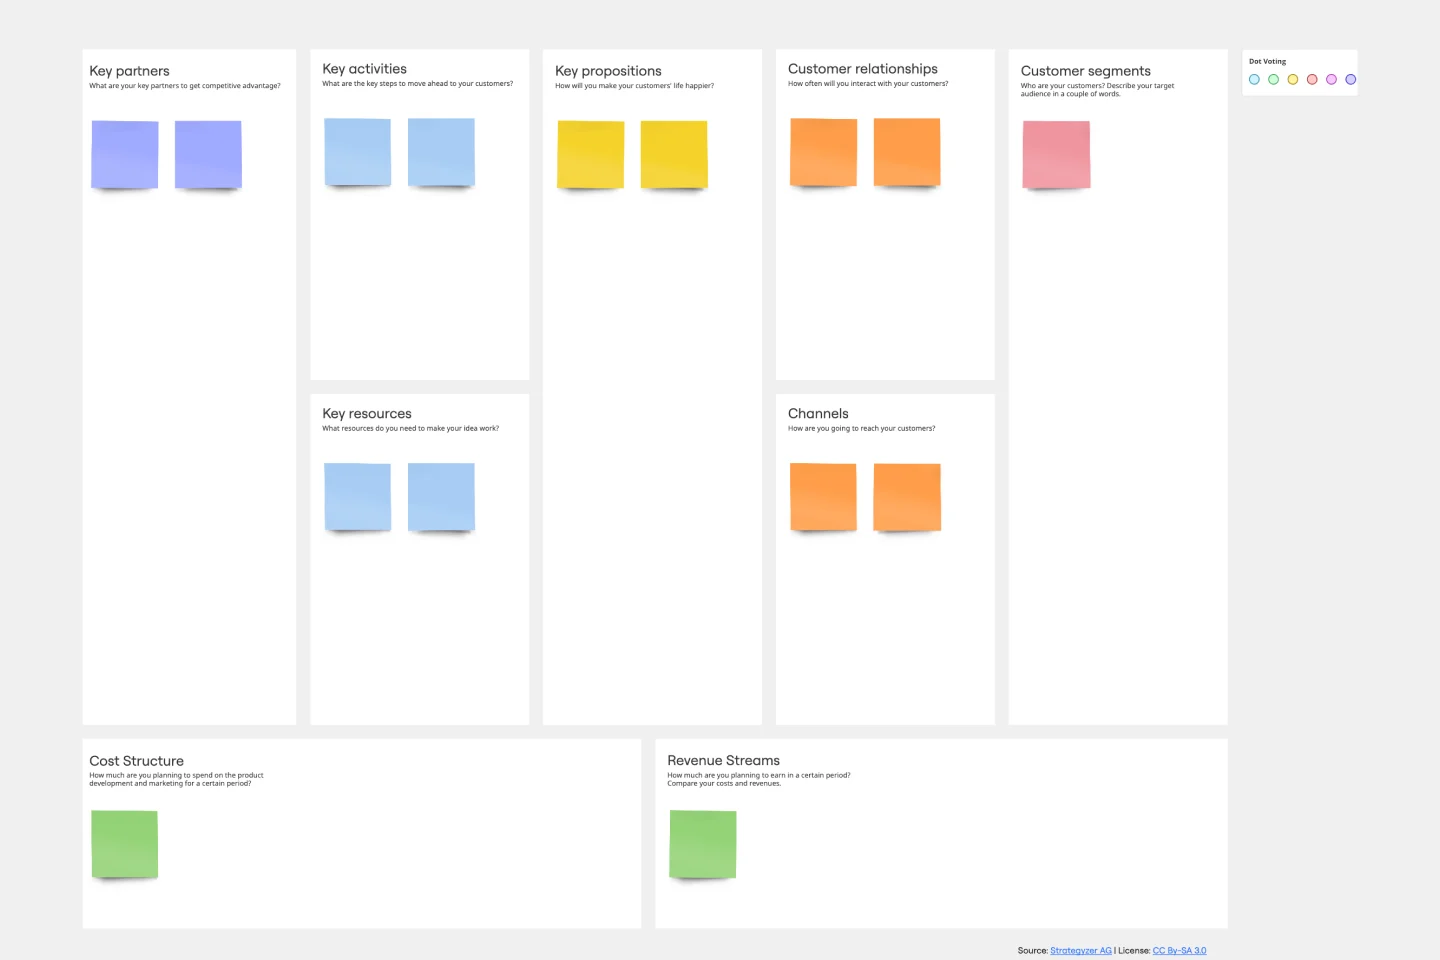
Business Model Canvas Template
Works best for:
Leadership, Agile Methodology, Strategic Planning
Your business model: Nothing is more fundamental to who you are, what you create and sell, or ultimately whether or not you succeed. Using nine key building blocks (representing nine core business elements), a BMC gives you a highly usable strategic tool to develop and display your business model. What makes this template great for your team? It’s quick and easy to use, it keeps your value proposition front and center, and it creates a space to inspire ideation.
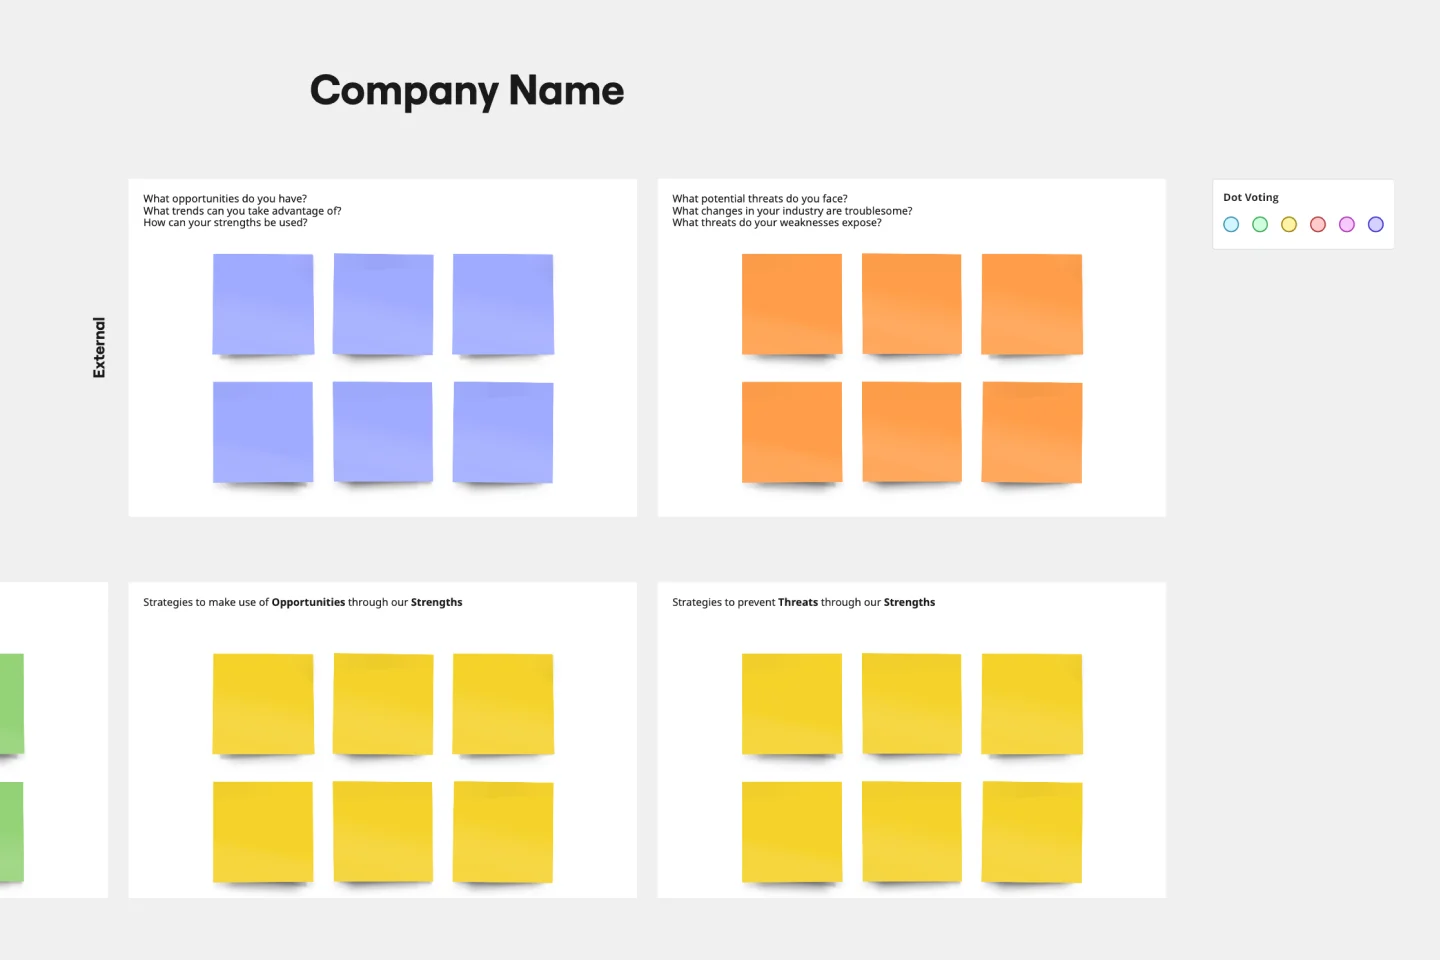
SWOT Analysis Template
Works best for:
Decision Making, Strategic Planning, Prioritization
When you’re developing a business strategy, it can be hard to figure out what to focus on. A SWOT analysis helps you hone in on key factors. SWOT stands for Strengths, Weaknesses, Opportunities, and Threats. Strengths and weaknesses are internal factors, like your employees, intellectual property, marketing strategy, and location. Opportunities and threats are usually external factors, like market fluctuations, competition, prices of raw materials, and consumer trends. Conduct a SWOT analysis whenever you want to explore opportunities for new businesses and products, decide the best way to launch a product, unlock your company’s potential, or use your strengths to develop opportunities.
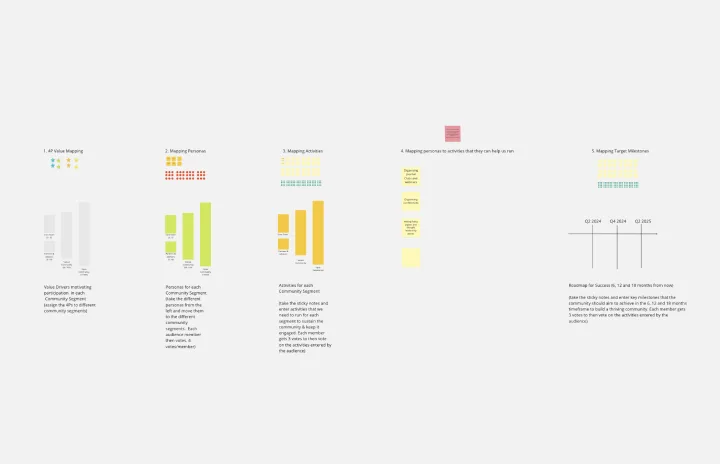
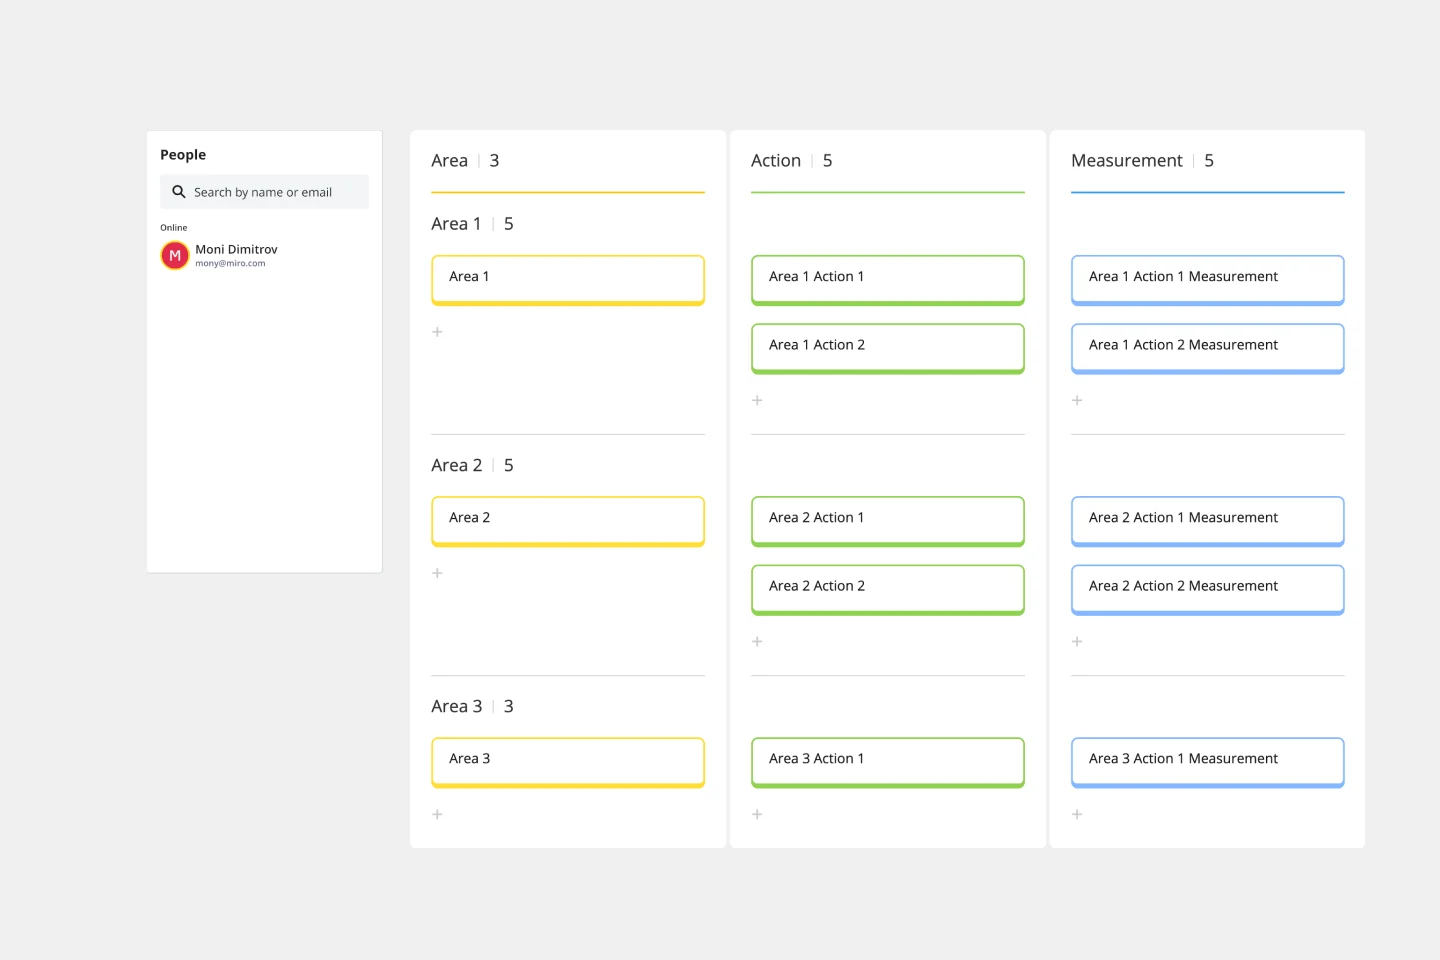
Community Building: A 5 Step Roadmap
Works best for:
Roadmap, Planning, Mapping
Use this five step process for building a community development roadmap.
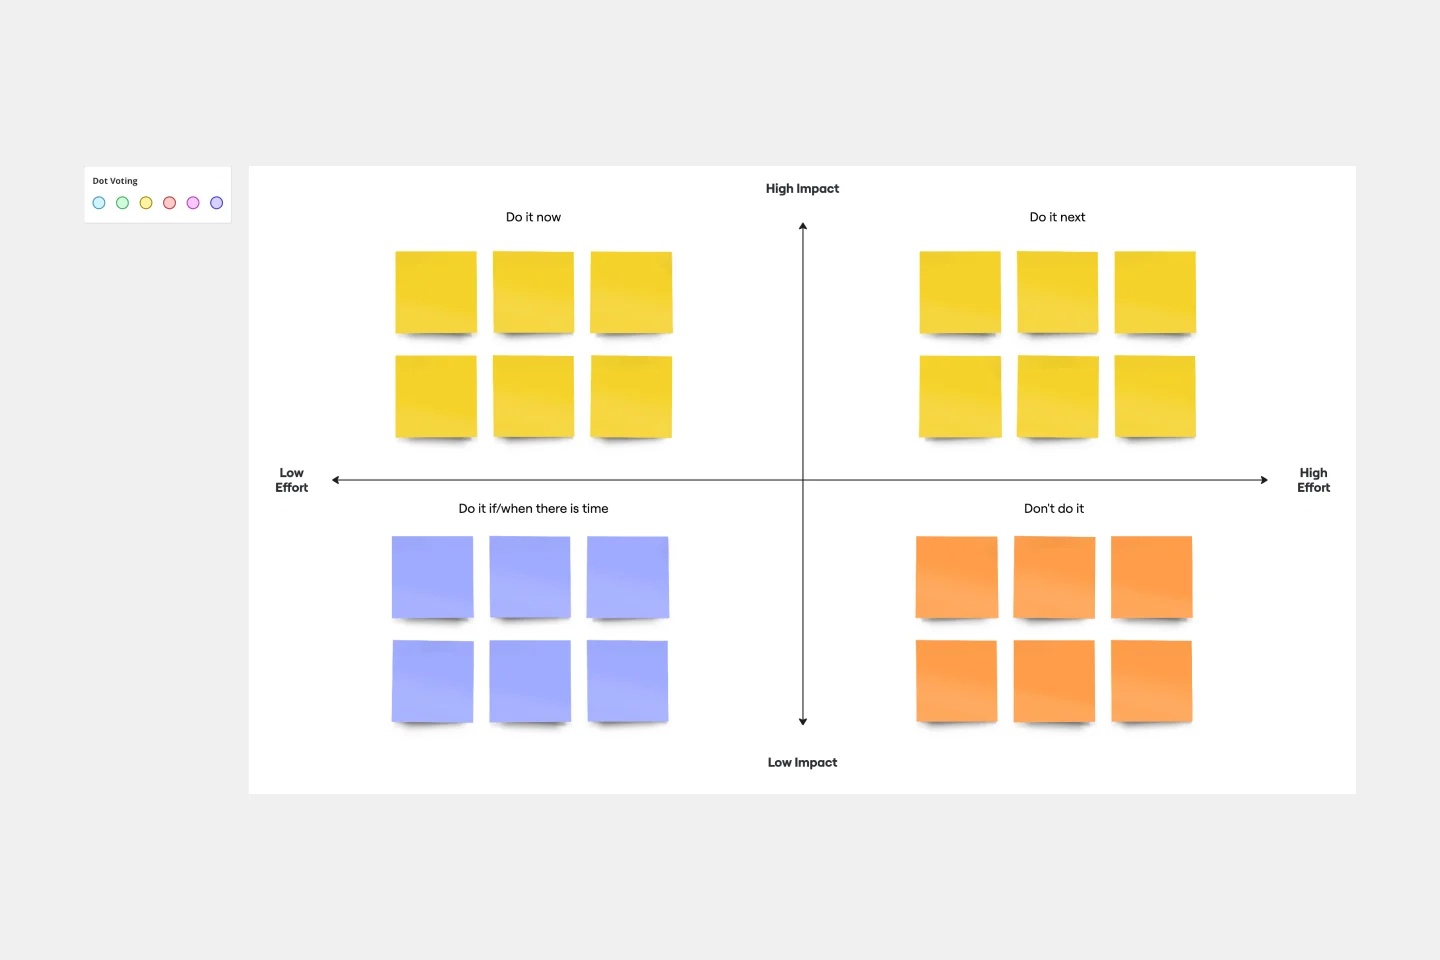
Impact/Effort Matrix Template
Works best for:
Project Management, Strategic Planning, Prioritization
Growing organizations have countless to-do’s and only so many hours in a day (or weeks before a big launch) to get them done. That’s where an impact effort matrix comes in. It gives you a quick visual guide to help prioritize your tasks and know exactly what’s worth doing. Using our template, you can create a matrix that organizes your activities into four main categories: quick wins that are low effort, effort-intensive projects that provide long-term returns, fill-ins that are low effort but low value, and time-wasters.
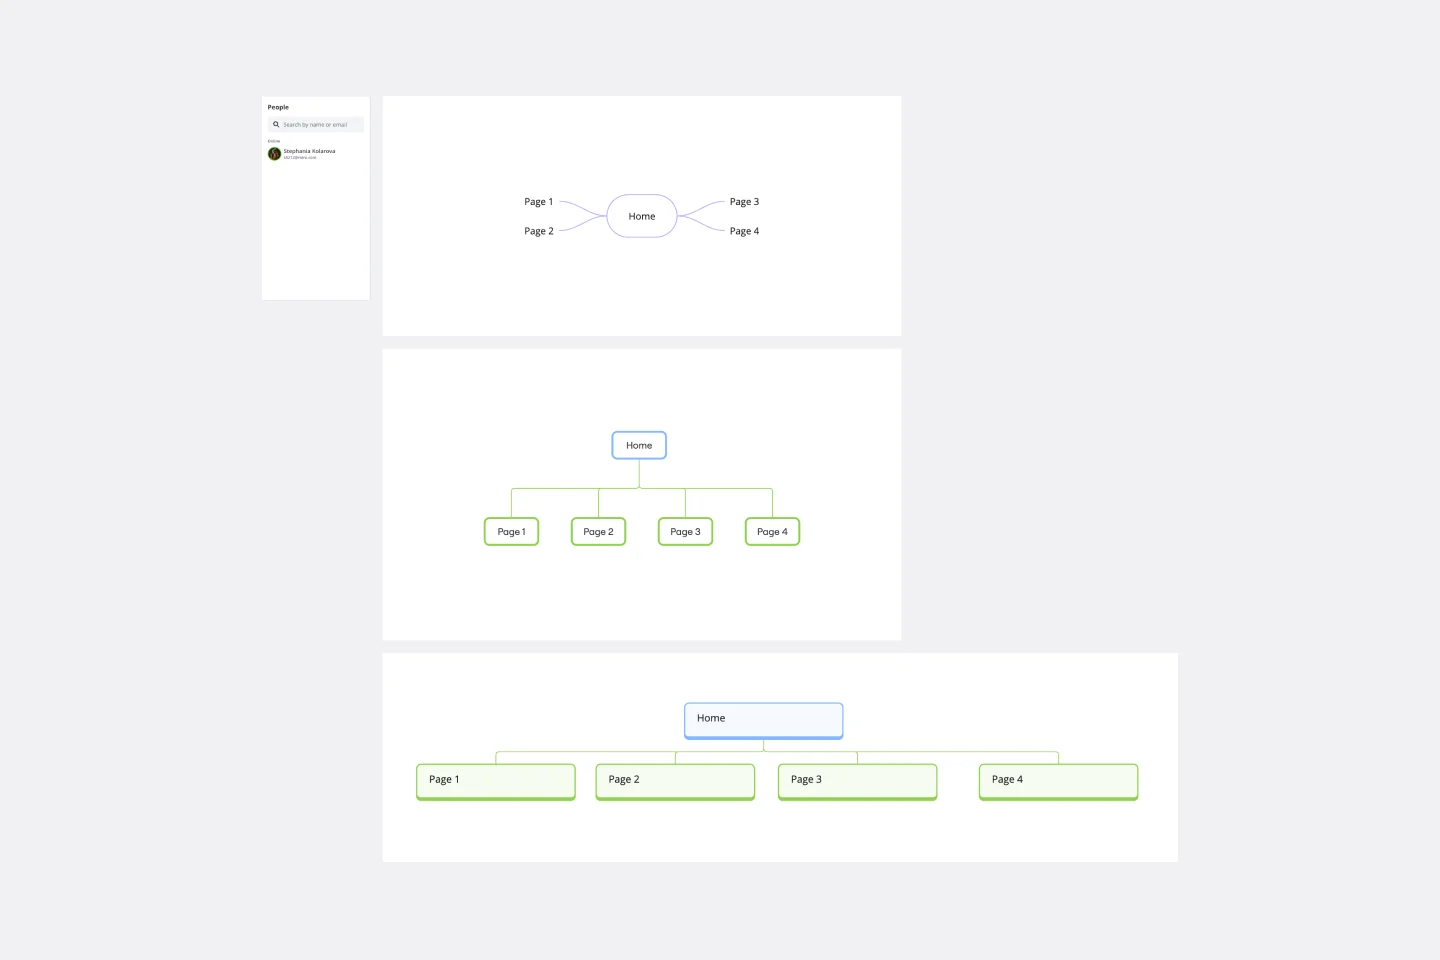
Sitemap Template
Works best for:
Mapping, Software Development, Diagrams
Building a website is a complex task. Numerous stakeholders come together to create pages, write content, design elements, and build a website architecture that serves a target audience. A sitemap is an effective tool for simplifying the website design process. It allows you to take stock of the content and design elements you plan to include on your site. By visualizing your site, you can structure and build each component in a way that makes sense for your audience.