T-Chart Template
Make better, faster decisions by organizing and comparing your ideas.
About the T-Chart Template
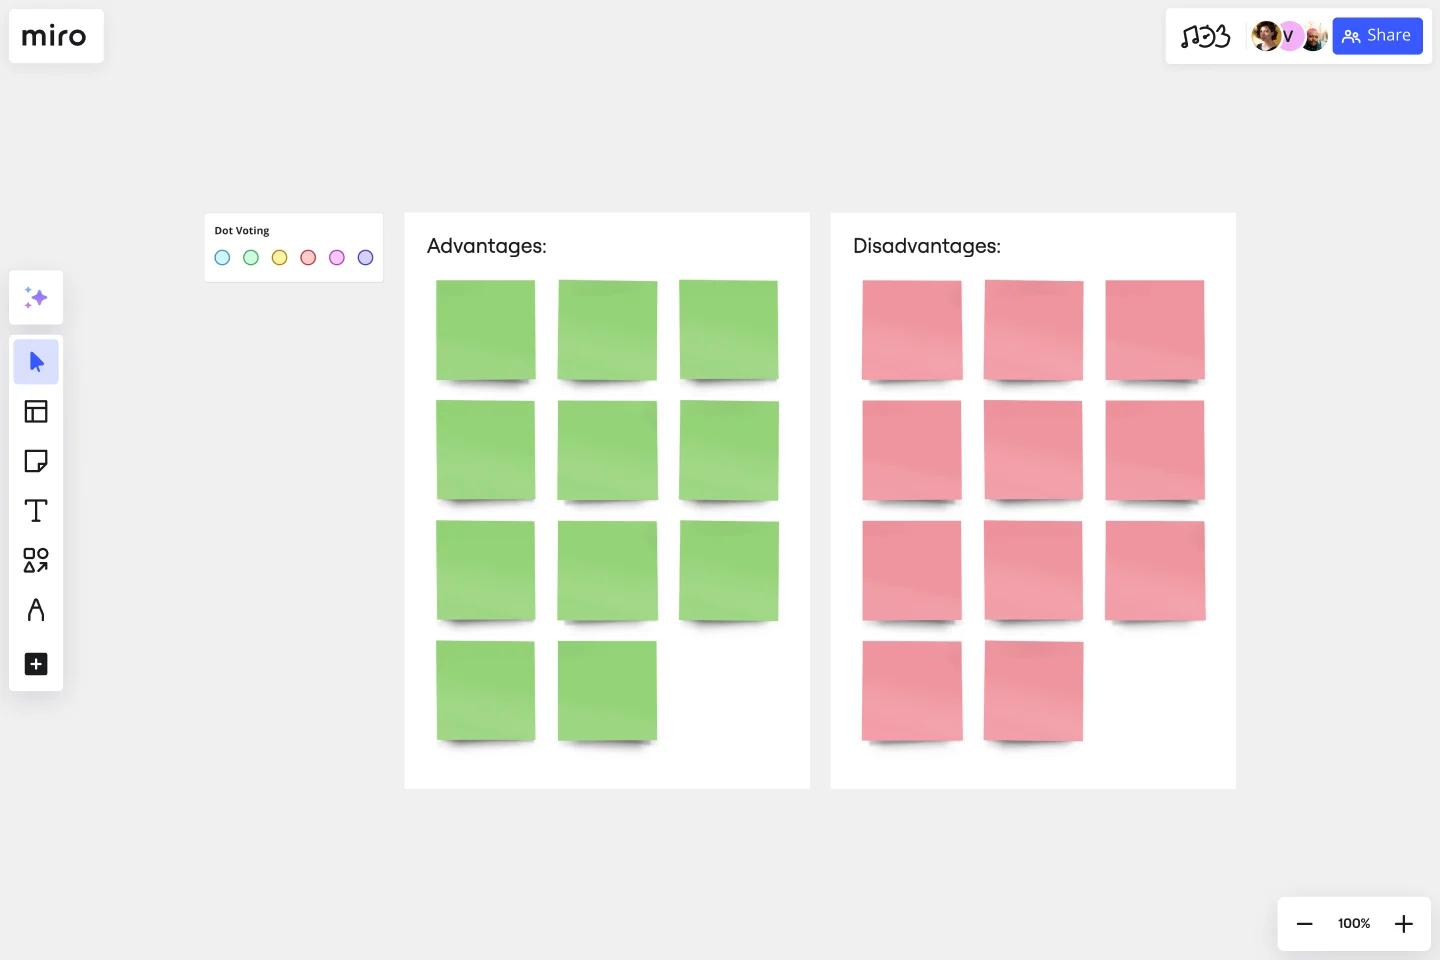
T-Charts can help you compare and contrast two different ideas, group information into different categories, and prove a change through “before” and “after” analysis. Designers and content creators can use T-Charts to turn possibilities into actionable ideas.
What is a T-Chart
T-Charts are a visual organizational tool that can help problem solve and compare aspects of two ideas. You can make comparisons such as pros and cons, facts and opinions, strengths and weaknesses, or big-picture views versus specific details.
When to use a T-Chart
T-Charts are useful for discussing differences and similarities with your team or clients and can help you to reach a decision together. Try testing out different headings or themes depending on the kind of problem you’d like to solve. This can include:
Compare pros and cons
Analyze personality traits
Contrast before and after states
Define cause and effect
Compare then and now states
Build a glossary to keep track of words and definitions
Outline hypothetical solutions and their potential outcomes
T-Charts allow your team to record new insights, spot patterns, and share knowledge. T- Charts often complement statistical data and graphs that can be presented with a formed narrative.
Create your own T-Chart
Making your own T-Charts is easy. Miro is the perfect canvas to create a T-chart and share them. Get started by selecting the T-Chart Template, then take the following steps to make one of your own:
Decide why you need a T-Chart. Are you comparing and contrasting design or content-related ideas to make a decision? Or outlining situations to plan ahead of important events? Either way, thinking ahead can create a strong foundation for your chart.
Invite your team or clients to fill in the blanks. Up to 300 people can collaborate seamlessly on your Miro board. If you need input or feedback to narrow down your ideas, invite others to participate.
Add visuals to strengthen your text, or make a final decision. Adding emojis or photos will bring an emotional layer or more context for your team. You can use imagery as a tool to vote for a preferred option. Imagery can also help bring the chart to life with real-life references.
Get started with this template right now.
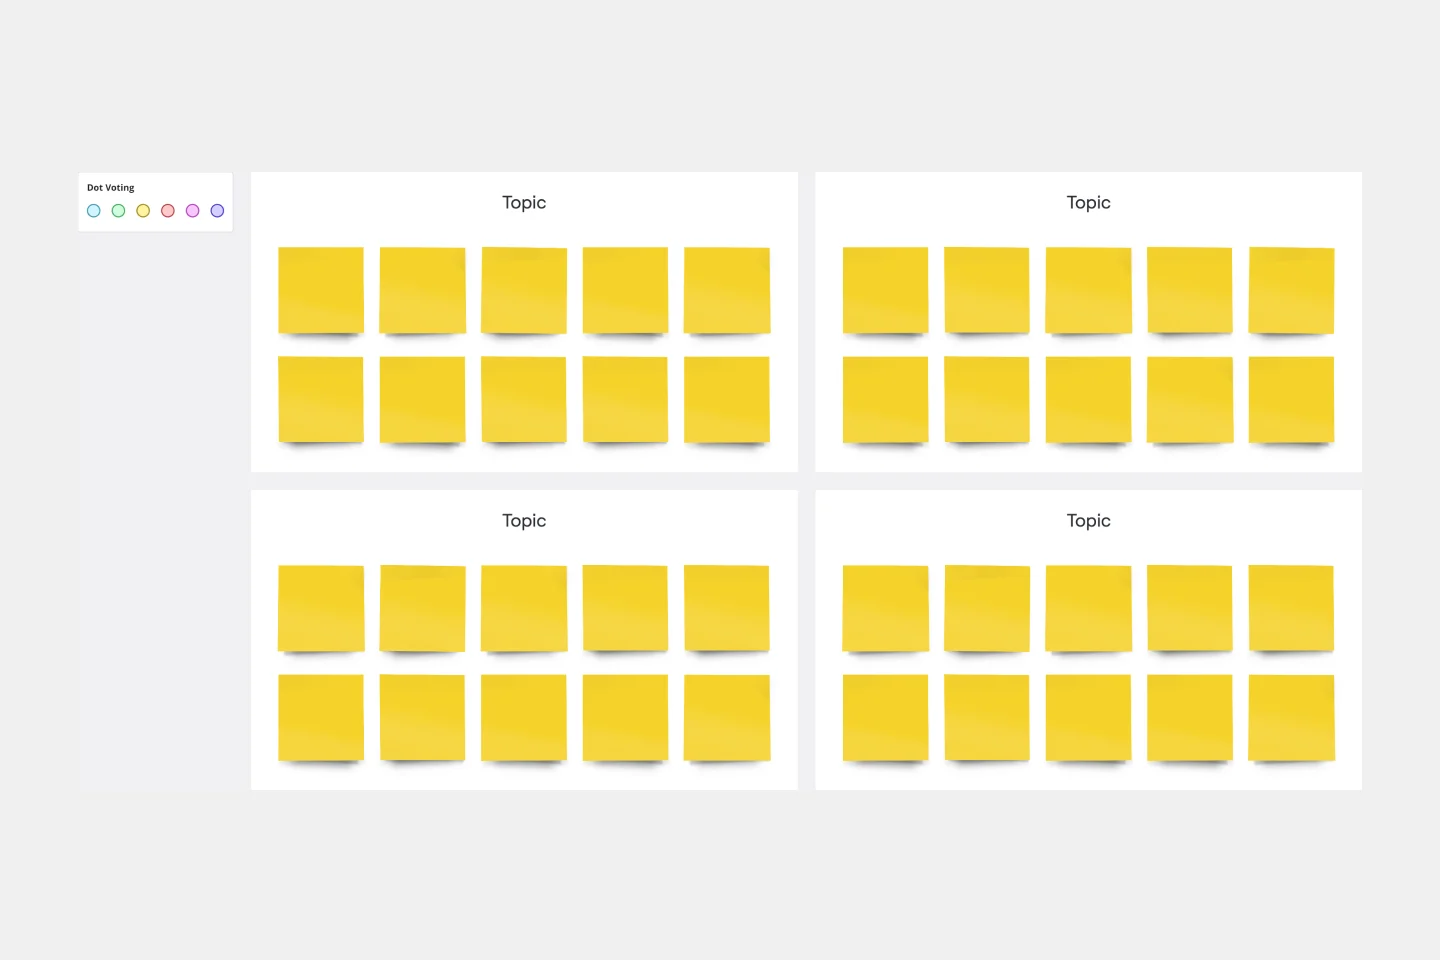
MoSCoW Matrix Template
Works best for:
Ideation, Operations, Prioritization
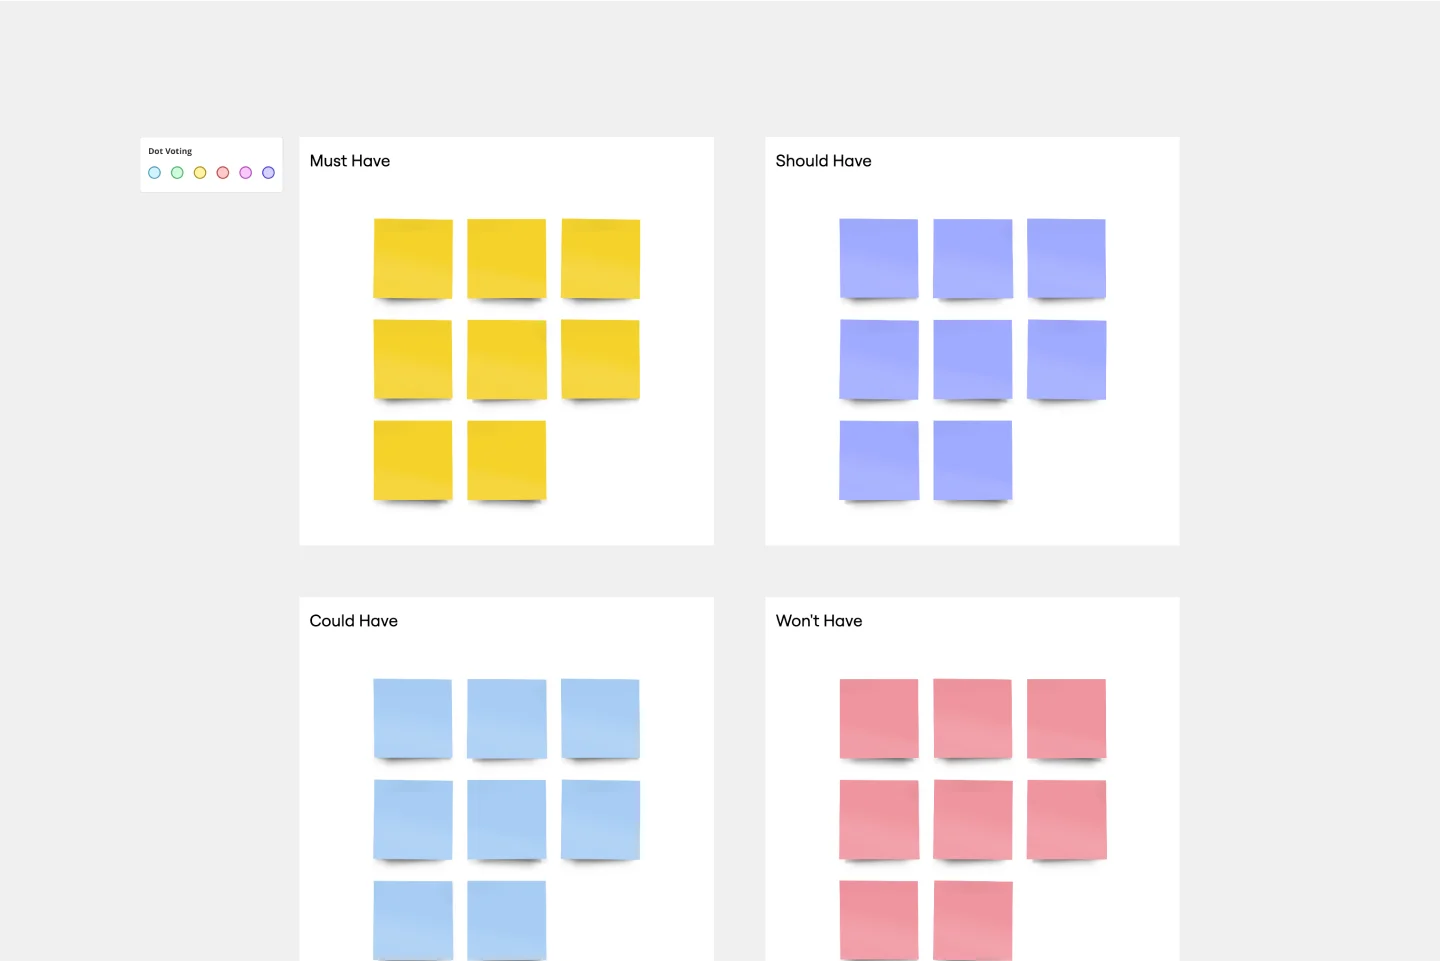
Keeping track of your priorities is a big challenge on big projects, especially when there are lots of deliverables. The MoSCoW method is designed to help you do it. This powerful technique is built on a matrix model divided into four segments: Must Have, Should Have, Could Have, and Won’t Have (which together give MoSCoW its name). Beyond helping you assess and track your priorities, this approach is also helpful for presenting business needs to an audience and collaborating on deliverables with a group of stakeholders.
Fishbone Diagram for Service Improvement
Works best for:
Fishbone diagram
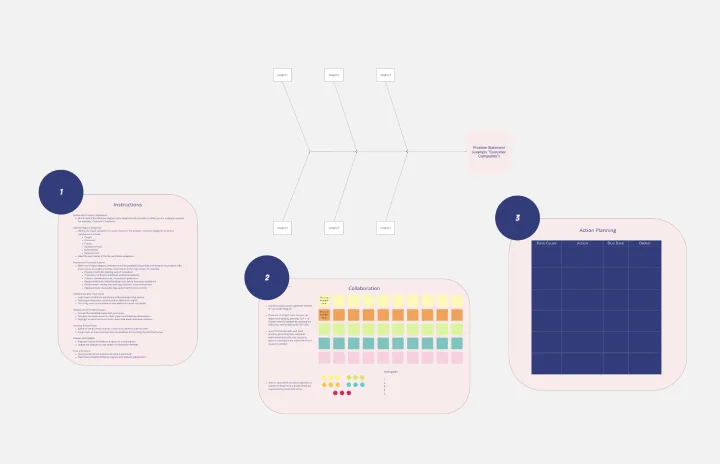
The Basic Fishbone Diagram, also known as the Ishikawa or cause-and-effect diagram, is a powerful tool for identifying the root causes of problems. Use this template to systematically explore and document potential causes of an issue, categorizing them into key areas such as people, processes, equipment, and materials. This visual approach helps teams collaborate on problem-solving, ensuring all factors are considered and addressed effectively.
Gantt Chart Project
Works best for:
Strategy, Planning
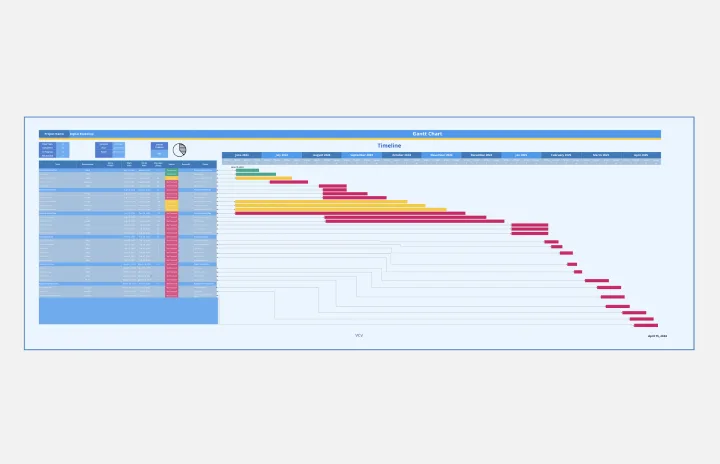
The Gantt Chart Project template is a versatile tool for managing various types of projects. It provides a clear visual timeline of your project's tasks, deadlines, and dependencies. Use it to plan, execute, and monitor your project's progress, ensuring all activities are aligned and on track. This template enhances team collaboration, improves time management, and helps address potential bottlenecks for successful outcomes.
Research Topic Brainstorm Template
Works best for:
Desk Research, Brainstorming, Ideation
Coming up with a topic for a research project can be a daunting task. Use the Research Topic Brainstorm template to take a general idea and transform it into something concrete. With the Research Topic Brainstorm template, you can compile a list of general ideas that interest you and then break them into component parts. You can then turn those parts into questions that might be the focus for a research project.
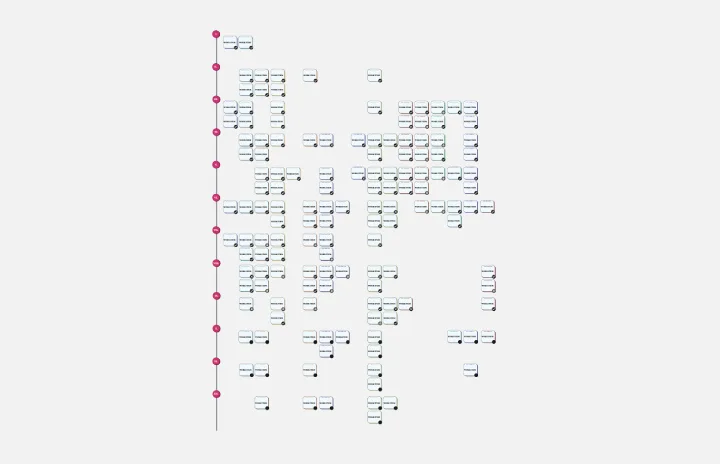
Multiple-Product Roadmap
Works best for:
Planning, Mapping
The Multiple Product Roadmap template empowers product managers to visualize and manage multiple product initiatives effectively. By providing a centralized view of project timelines, dependencies, and milestones, this template fosters alignment and transparency across teams. With sections for prioritizing initiatives, tracking progress, and communicating updates, it enables teams to coordinate efforts and drive collective success. This template serves as a strategic tool for planning and executing product roadmaps that align with organizational goals and drive business growth.
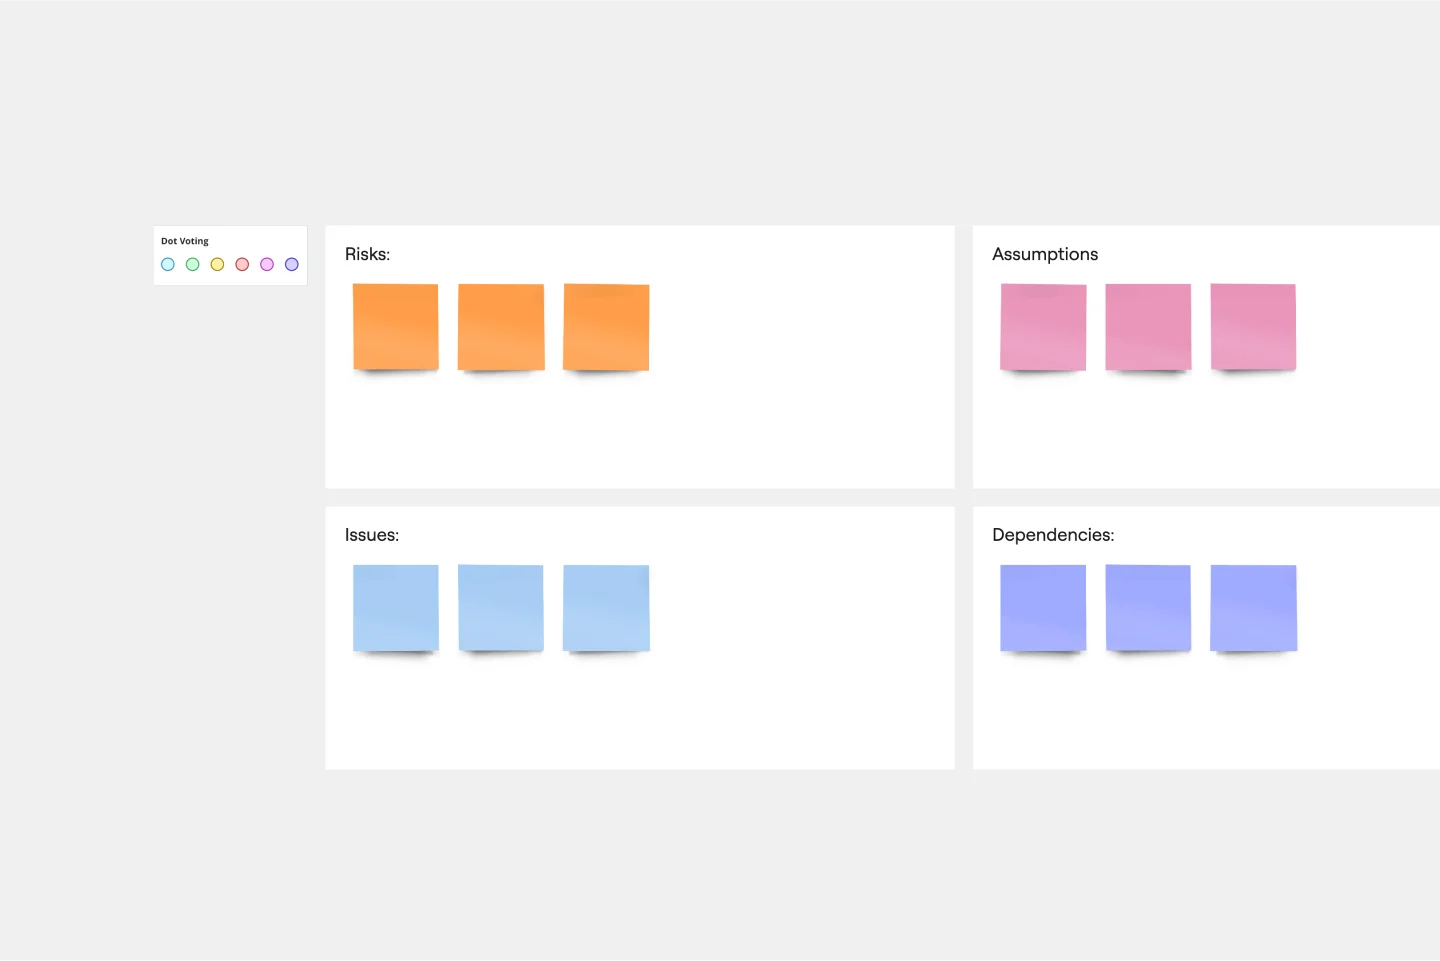
RAID Log Template
Works best for:
Agile Methodology, Project Management, Agile Workflows
Use the RAID Log template to better understand potential risks, assumptions, issues, and dependencies relating to an upcoming project. With this information, you can make effective contingency plans and prepare your resources accordingly. You’ll know what could go wrong throughout the project and how to fix the problem.