Algorithm Flowchart Template
Simplify the process of creating complex algorithms with the algorithm flowchart template.
About the Algorithm Flowchart Template
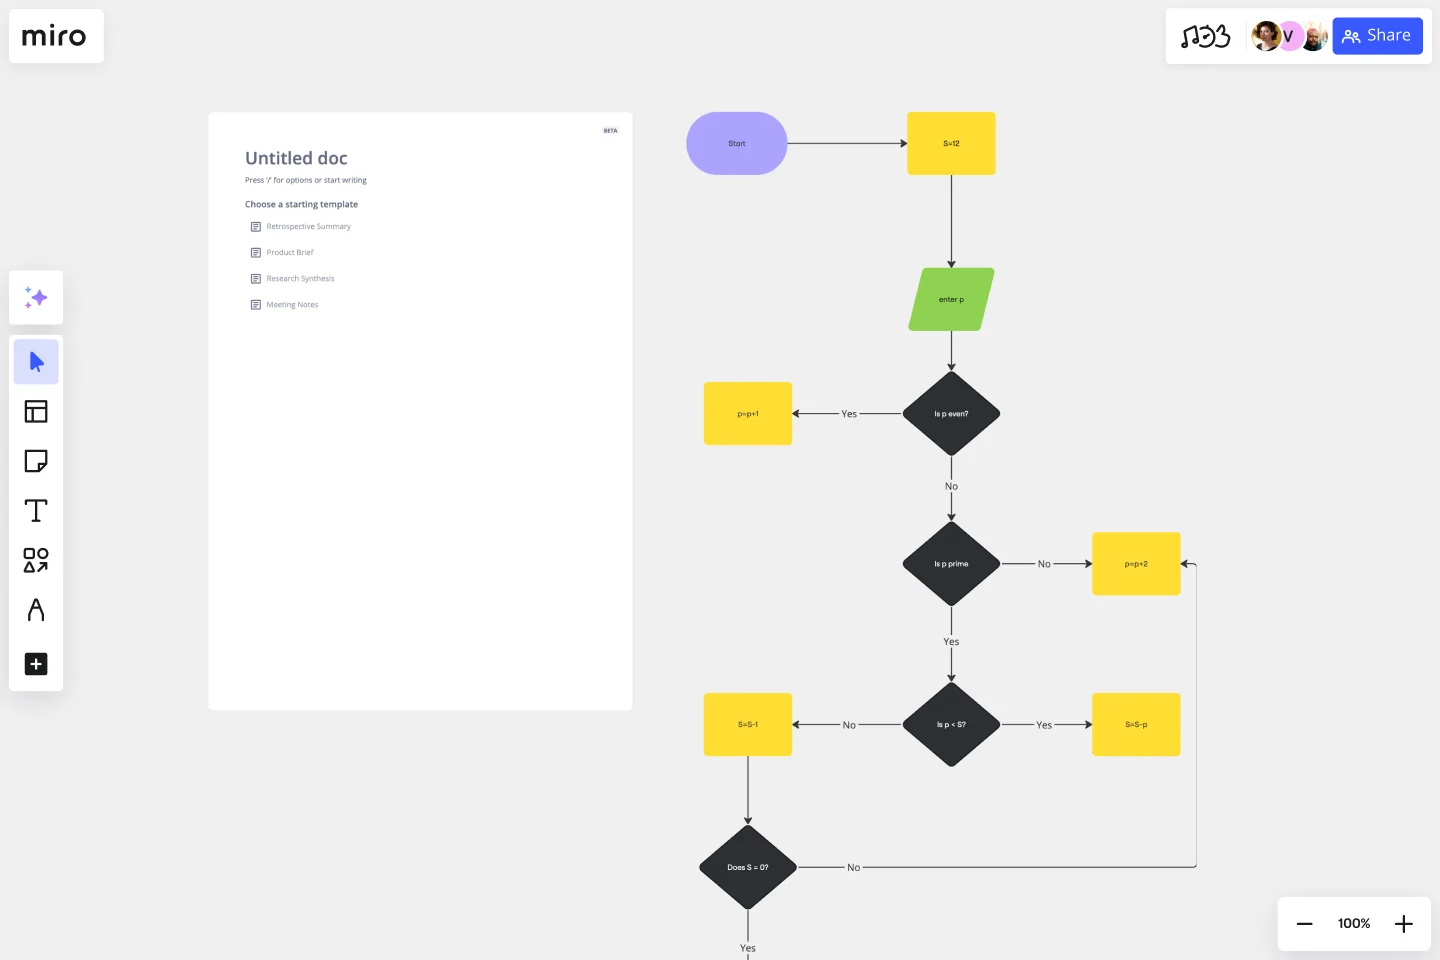
An algorithm flowchart is a graphical representation of a sequence of actions that make up an algorithm. It helps to streamline complex processes and make them easy to understand. Think of it as a blueprint that guides you through the logic of your algorithm, making it easier to go from problem to solution.
The algorithm flowchart template is a pre-designed framework that makes it easy to map out the process flow of an algorithm. It simplifies each step by breaking it down into individual components, represented by different shapes such as rectangles, diamonds, and ovals. Each shape represents a type of action or decision. By using clearly defined areas for input, operations, decisions, and outputs, users can methodically plot the course of their algorithm's logic. This tool is helpful for both beginners and experienced professionals.
How to use the algorithm flowchart template in Miro
Customize the flowchart: Double-click shapes to add your specific algorithm steps. The template is user-friendly, enabling you to edit text and shapes with just a few clicks.
Expand the diagram: Use automated diagramming features to drag and drop more shapes and connector lines, seamlessly expanding your flowchart.
Add context: Integrate any artifact on your board, such as notes, images, or links, to provide deeper insight into your algorithm.
The entire process is designed for efficiency and adaptability, ensuring your algorithm flowchart can grow and evolve as your project does.
Why use an algorithm flowchart template?
Clarity of complex processes: It transforms intricate algorithms into clear, visual steps, enhancing understanding for all stakeholders.
Efficiency in design: Saves time by providing a ready-made structure, which can be easily adjusted to fit various algorithms.
Collaboration: Fosters teamwork by allowing multiple contributors to view and edit the flowchart in real-time.
Reduce error: By laying out each step visually in a flowchart, potential issues can be identified and corrected early in the development process.
Documentation: The template acts as a dynamic document that can be referenced throughout the algorithm's lifecycle, from development to maintenance.
If you'd prefer to create an algorithm flowchart from scratch, Miro's flowchart tool is easy and intuitive to use.
Can the algorithm flowchart template handle complex algorithms with multiple conditions?
Absolutely. The template is designed to accommodate a variety of complexities, including algorithms with numerous conditions and branches.
Is it possible to export the flowchart for use in presentations or documents?
Yes, flowcharts created with the template can be exported and included in various document formats, making them suitable for presentations and reporting.
How does collaboration work with this template?
The template supports real-time collaboration. Multiple people can work on the flowchart simultaneously, making it perfect for team projects.
Are there any limits to how much I can customize the template?
There are no inherent limits. The template is fully customizable, allowing users to expand and change to meet their needs without restriction.
Get started with this template right now.
Cluster Diagram Template
Works best for:
Diagramming
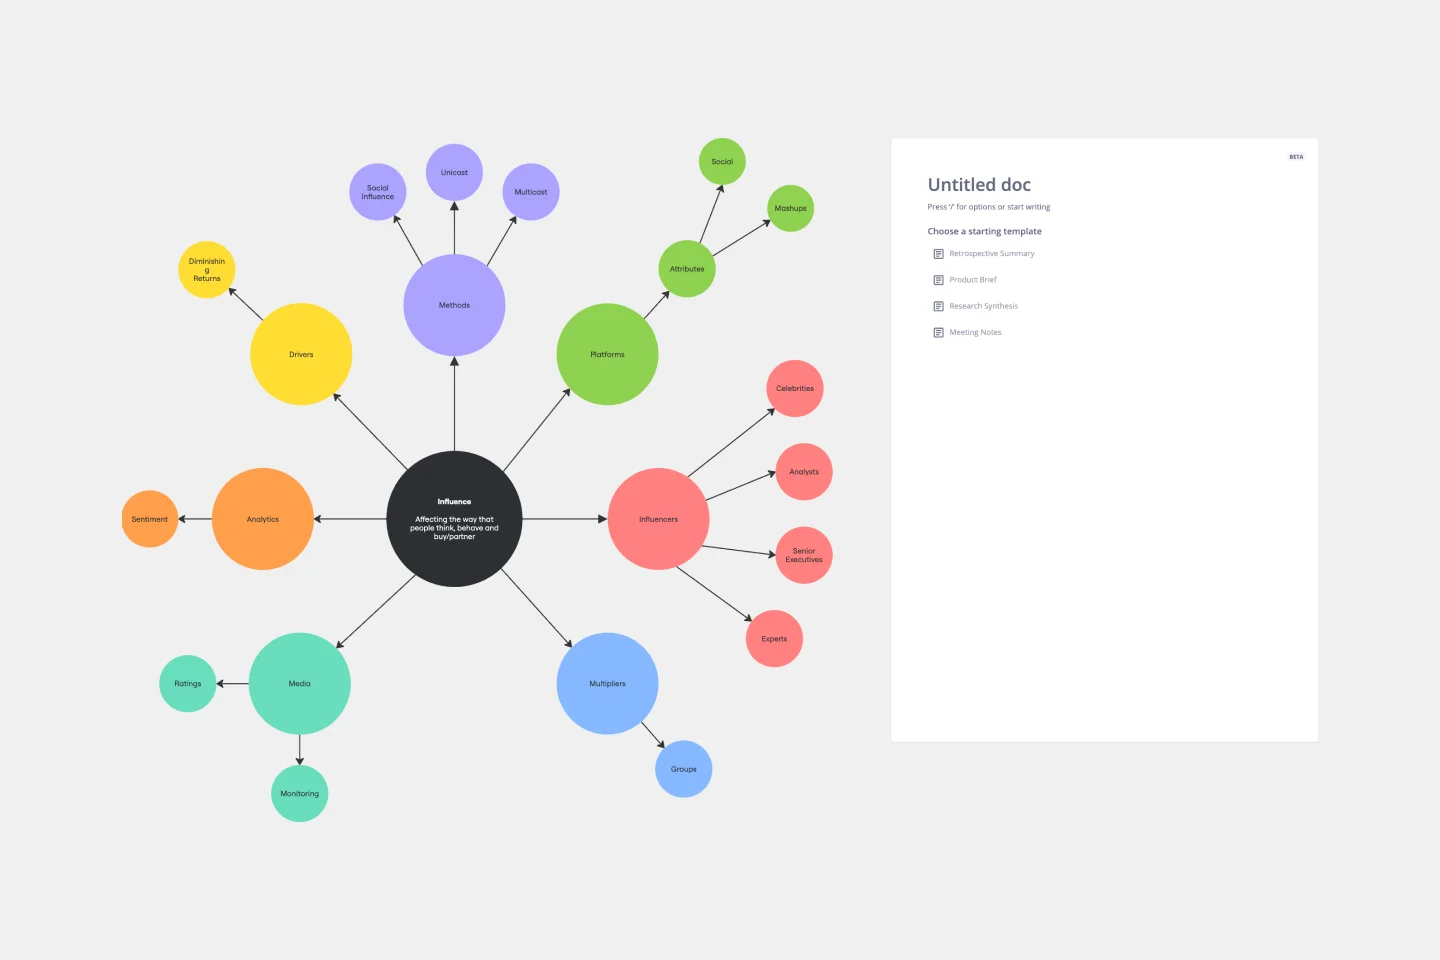
The Cluster Diagram Template is a valuable tool for organizing and connecting ideas, concepts, and information in a visually compelling and coherent manner. The template's design centers on grouping related ideas around a core concept, creating a transparent and hierarchical structure. This clustering not only aids in breaking down complex information into manageable segments but also significantly enhances the process of idea generation and brainstorming. A structured yet flexible visual framework encourages deeper engagement and more precise understanding, making it an essential asset for teams and people looking to bring order to their creative and analytical processes.
Website Flowchart Template
Works best for:
Flowcharts, Mapping, User Experience
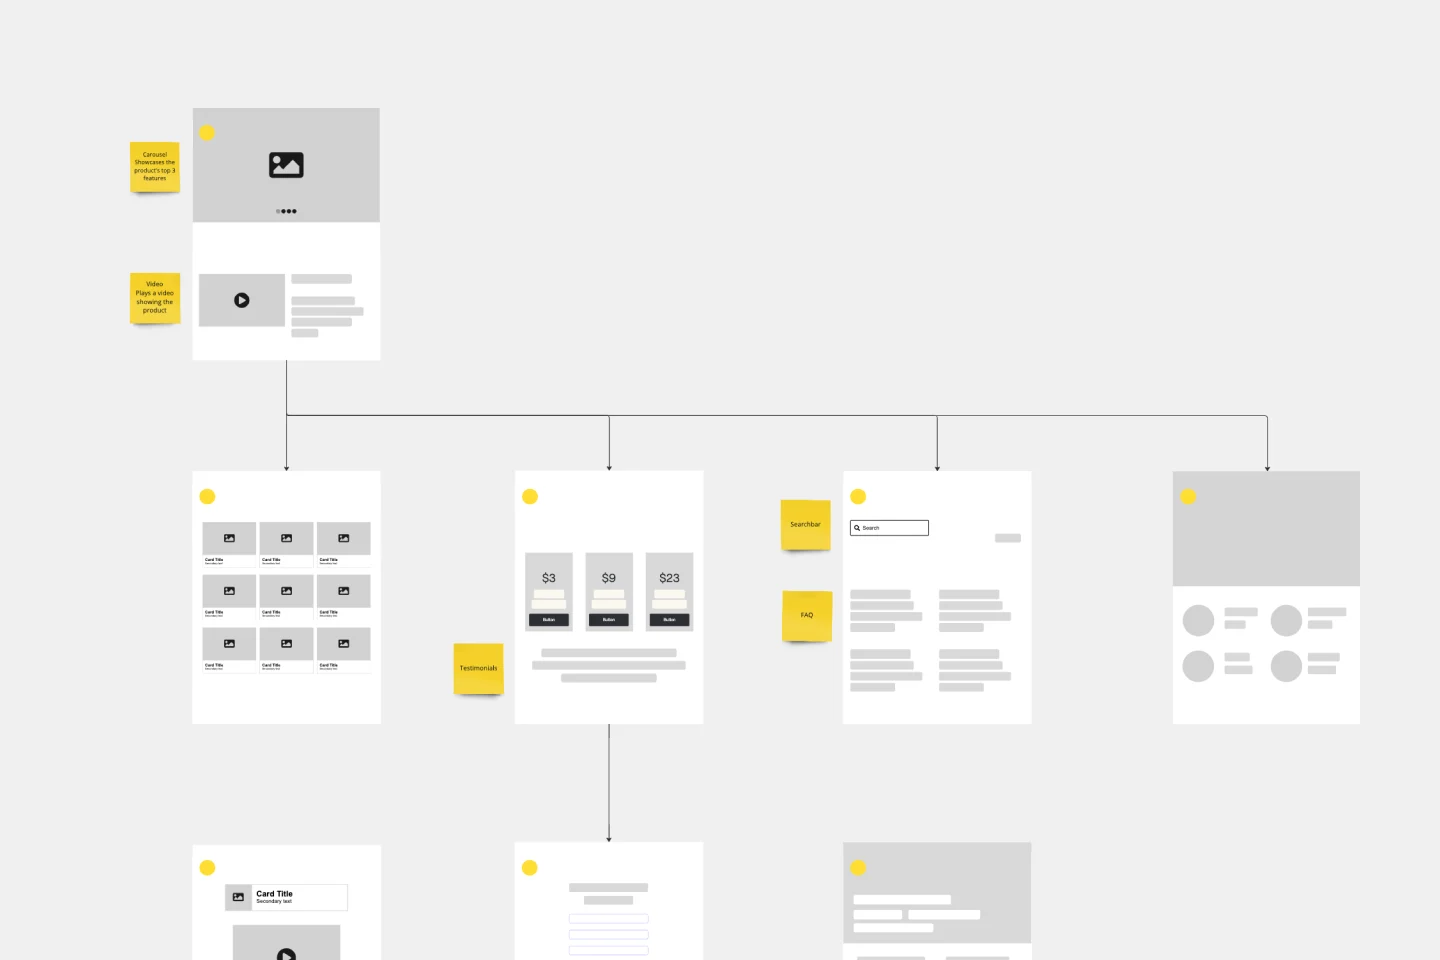
A website flowchart, also known as a sitemap, maps out the structure and complexity of any current or future website. The flowchart can also help your team identify knowledge gaps for future content. When you’re building a website, you want to ensure that each piece of content gives users accurate research results based on keywords associated with your web content. Product, UX, and content teams can use flowcharts or sitemaps to understand everything contained in a website, and plan to add or restructure content to improve a website’s user experience.
UML Communication Diagram Template
Works best for:
Software Development, Mapping, Diagrams
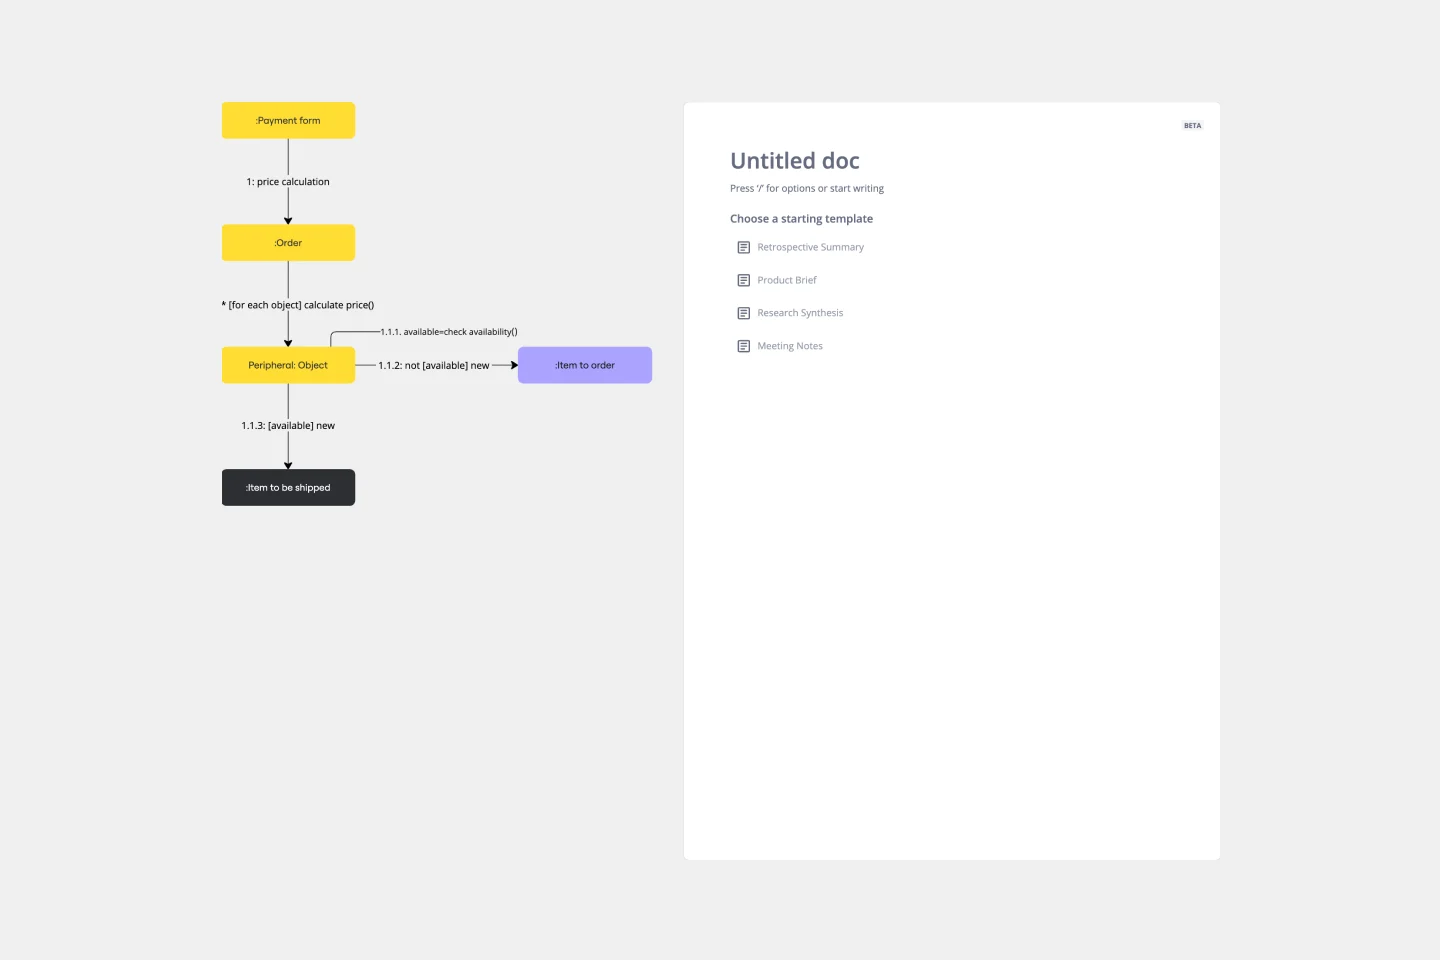
Most modern programs consist of many moving parts working to a precise set of instructions. With a communication diagram, you can visualize exactly how those parts work together, giving you a clearer understanding of your program as a whole. What’s more, the diagram leaves spaces for expanding the network of relationships as your product grows and evolves. A communication diagram is a vital tool in any software designer’s arsenal.
AWS Git to S3 Webhooks Template
Works best for:
Software Development, Diagrams
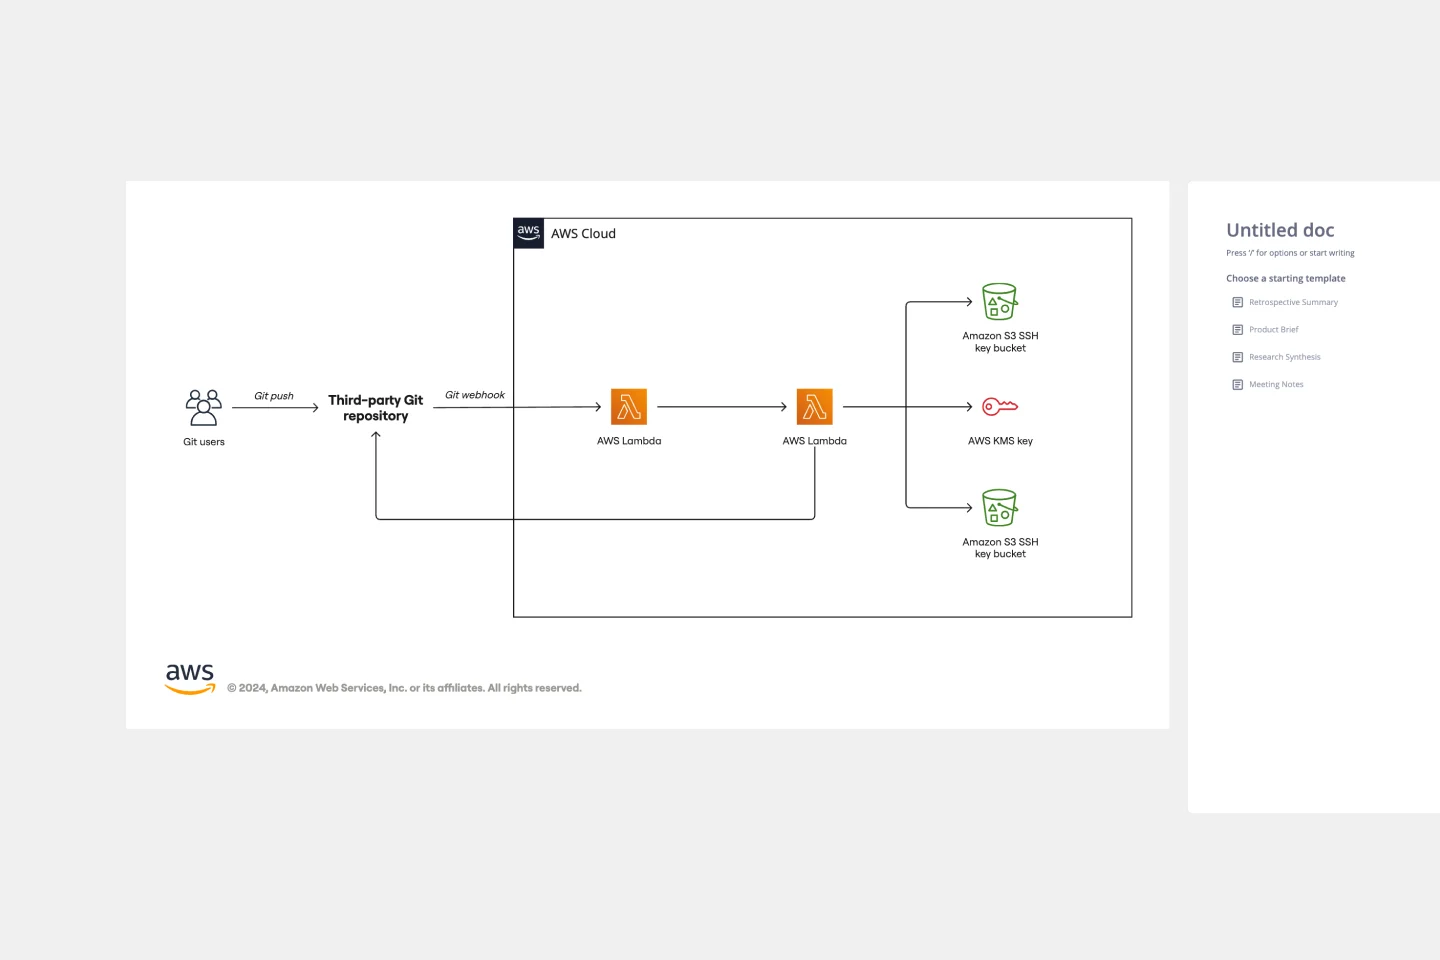
The AWS Git to S3 Webhooks Template is a visual representation of Git webhooks with AWS services Quick Start architecture. You can now have an overview of your AWS architecture with Miro’s AWS Git to S3 Webhooks Template, track your cloud solutions easily, and optimize processes like never before.
Turtle Diagram for BA
Works best for:
Diagramming
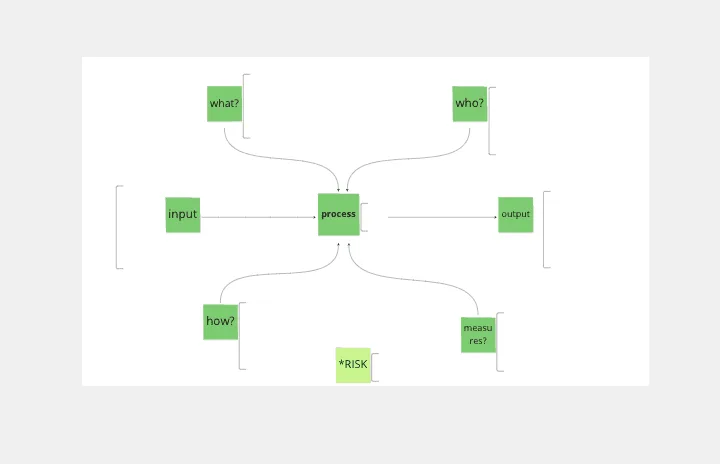
The Turtle Diagram for BA template offers a visual framework for defining and auditing business processes according to ISO 9001 standards. It provides elements for documenting process inputs, outputs, activities, and controls. This template enables organizations to ensure compliance, identify process improvements, and enhance quality management practices. By promoting systematic process documentation and auditability, the Turtle Diagram for BA empowers organizations to achieve and maintain ISO 9001 certification, demonstrating commitment to quality and continuous improvement.
Fishbone Diagram by Hanna Havulinna
Works best for:
Diagramming
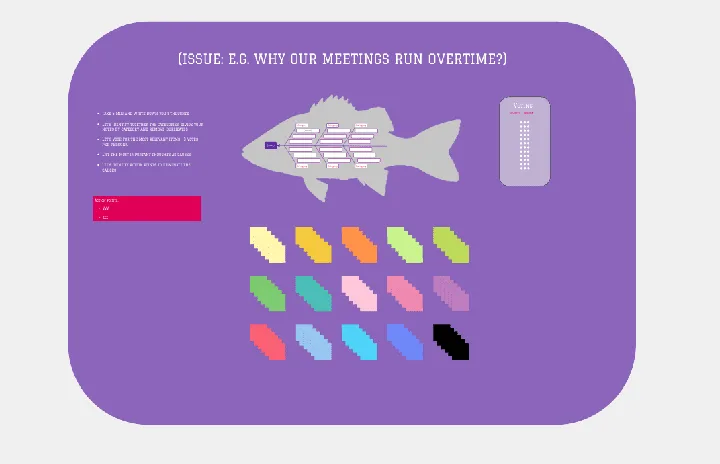
The Fishbone Diagram template, also known as the Ishikawa or Cause-and-Effect diagram, offers a visual tool for identifying and analyzing root causes of problems or issues. It provides a structured framework for categorizing potential causes into major categories such as people, process, environment, and equipment. This template enables teams to conduct root cause analysis systematically, facilitating problem-solving and decision-making. By promoting a structured approach to problem analysis, the Fishbone Diagram empowers teams to address issues effectively and implement corrective actions efficiently.