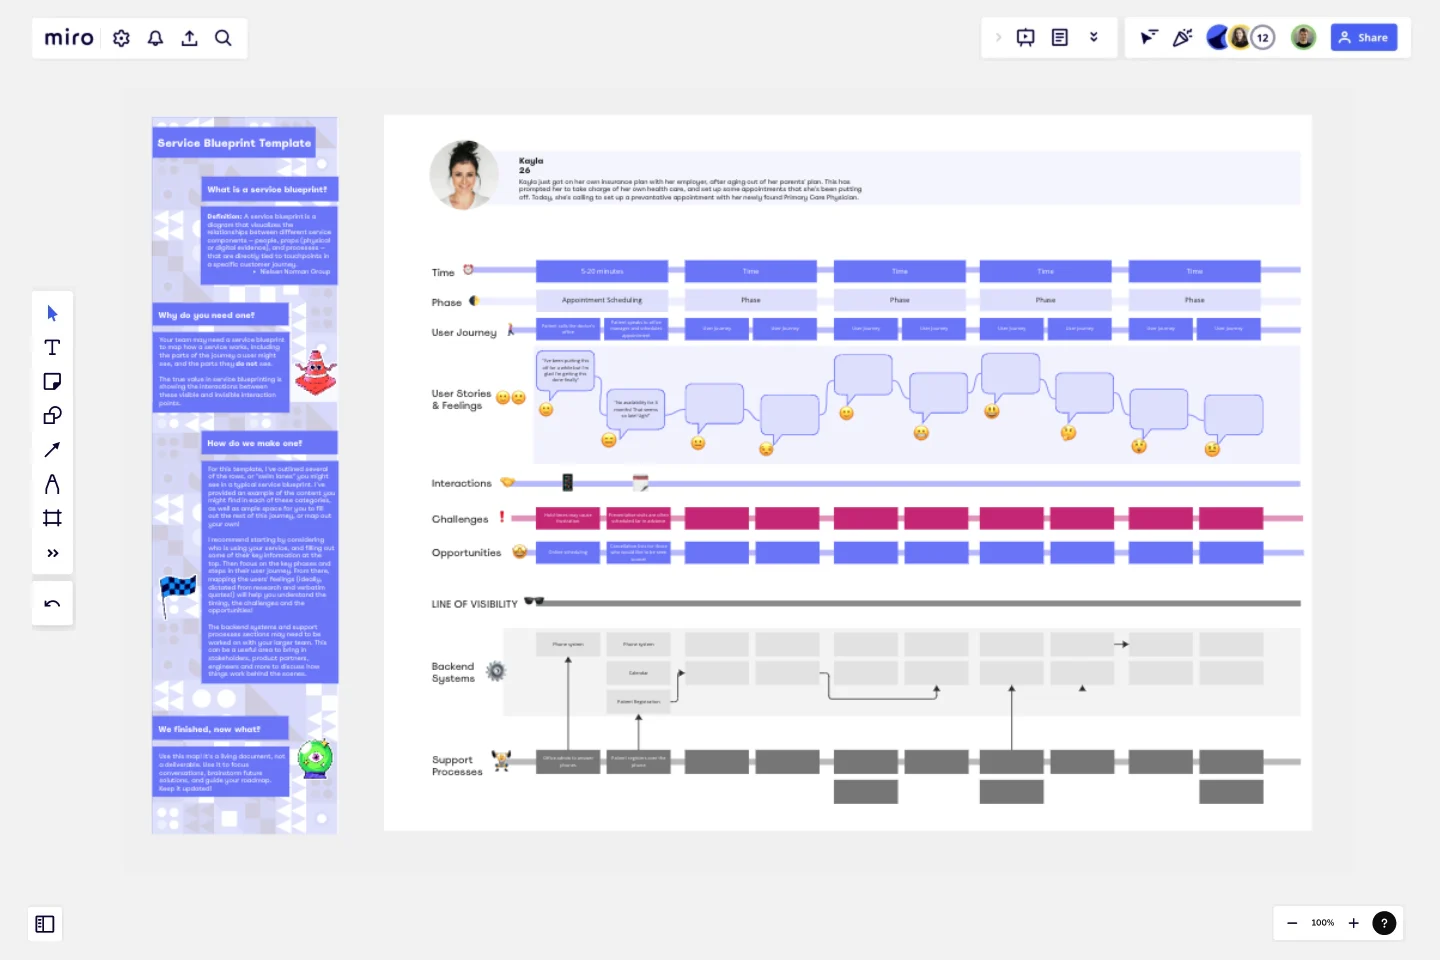
Service Blueprint by Liz Possee Corthell
Welcome to my Service Blueprint Template, designed to help you visualize and optimize the entire service process.
This template is an essential tool for service designers, managers, and teams aiming to enhance customer experience and streamline service delivery.
In this template you'll find areas to map your team's:
Persona: Who is going on this particular journey and using this service at this time? This section will allow you to consider your user, and key factors that put them on their journey with your service.
User journey: Track every step your customers take, from initial contact through to the completion of the service. This section helps you understand the customer journey from their perspective.
User feelings and actions: Track what your users are thinking and feeling through their journey. This section should ideally be filled in with verbatims from your user research so that you can visualize real findings alongside your journey.
Interactions: Detail the interactions and activities that occur directly between service staff and customers. This includes face-to-face communications, phone calls, digital interactions, and more.
Challenges and Opportunities: Map user's frustrations, challenges, or pain points while interacting with your service, and the opportunities to improve these pain points.
Backend Systems: Outline the internal processes and actions that support the user's journey but are invisible to customers.
Support Processes: Identify the systems and processes that underpin both user's journey, and the backend systems to ensure smooth service delivery.
Benefits:
Enhanced Clarity: Visualize the relationships and dependencies across different components of the service process.
Improved Efficiency: Identify redundancies and gaps in the service process, allowing for more streamlined operations.
Better User Experience: Understand and improve the user's journey by refining interactions and eliminating pain points.
Usage:
This template is versatile and can be adapted to a wide range of services, from retail and hospitality to healthcare and education. Simply fill in each section with details specific to your service to create a comprehensive overview of your service delivery process. To start, you'll find the first two columns filled out mapping Kayla's journey to set up an appointment with her new primary care physician, to show you how to use each of the rows.
This template was created by Liz Possee Corthell.
Get started with this template right now.
Value Stream Mapping Template
Works best for:
Project Management, Strategic Planning, Mapping
A value stream map can help you refocus your business on steps that actually provide value to your customers, cutting out wasteful and inefficient processes. With this template, you and your process team can collaborate on a value stream map today.
Technology Product Canvas Template
Works best for:
Product Management, Meetings
Originally created by Prem Sundaram, the Technology Product Canvas allows product and engineering teams to achieve alignment about their shared roadmap. The canvas combines agile methodologies with UX principles to help validate product solutions. Each team states and visualizes both product and technology goals, then discusses each stage of the roadmap explicitly. This exercise ensures the teams are in sync and everyone leaves with clear expectations and direction. By going through the process of creating a Technology Product Canvas, you can start managing alignment between the teams -- in under an hour.
Sprint Planning by Piera Mattioli
Works best for:
Planning, Strategy
Sprint Planning Template helps you organize and plan your sprints effectively. It allows you to set goals, allocate tasks, and track progress, ensuring your team stays focused and meets sprint objectives. Perfect for agile teams.
Service Blueprint by Habanero
Works best for:
Service Blueprint
Optimize your service processes with the Service Blueprint Habanero. This template allows you to map out and scrutinize each aspect of your service delivery, highlighting customer touchpoints and internal processes. Use it to identify inefficiencies, streamline operations, and enhance the overall customer experience. Perfect for service designers, managers, and improvement teams, it offers a detailed approach to refining and innovating your service offerings.
Status Report Template
Works best for:
Project Management, Documentation, Strategic Planning
A status report provides a snapshot of how something is going at a given time. You can provide a status report for a project, a team, or a situation, as long as it emphasizes and maps out a project’s chain of events. If you’re a project manager, you can use this report to keep historical records of project timelines. Ideally, any project stakeholder should be able to look at a status report and answer the question, “Where are we, and how did we get here?” Use this template as a starting point to summarize how something is progressing against a projected plan or outcome.
Corrective Action Plan Template
Works best for:
Project Management, Operations, Strategic Planning
For a manager or HR leader, it’s the least fun part of the job: Documenting an employee’s performance issues and talking about them directly to that employee. A corrective action plan makes that tough task a little easier by putting issues into a professional, written framework. That way the process, next steps, and details of the conversations are all clearly documented. This template will enable you to eliminate murky communication, align on expectations, and provide step-by-step instructions for your employee.
