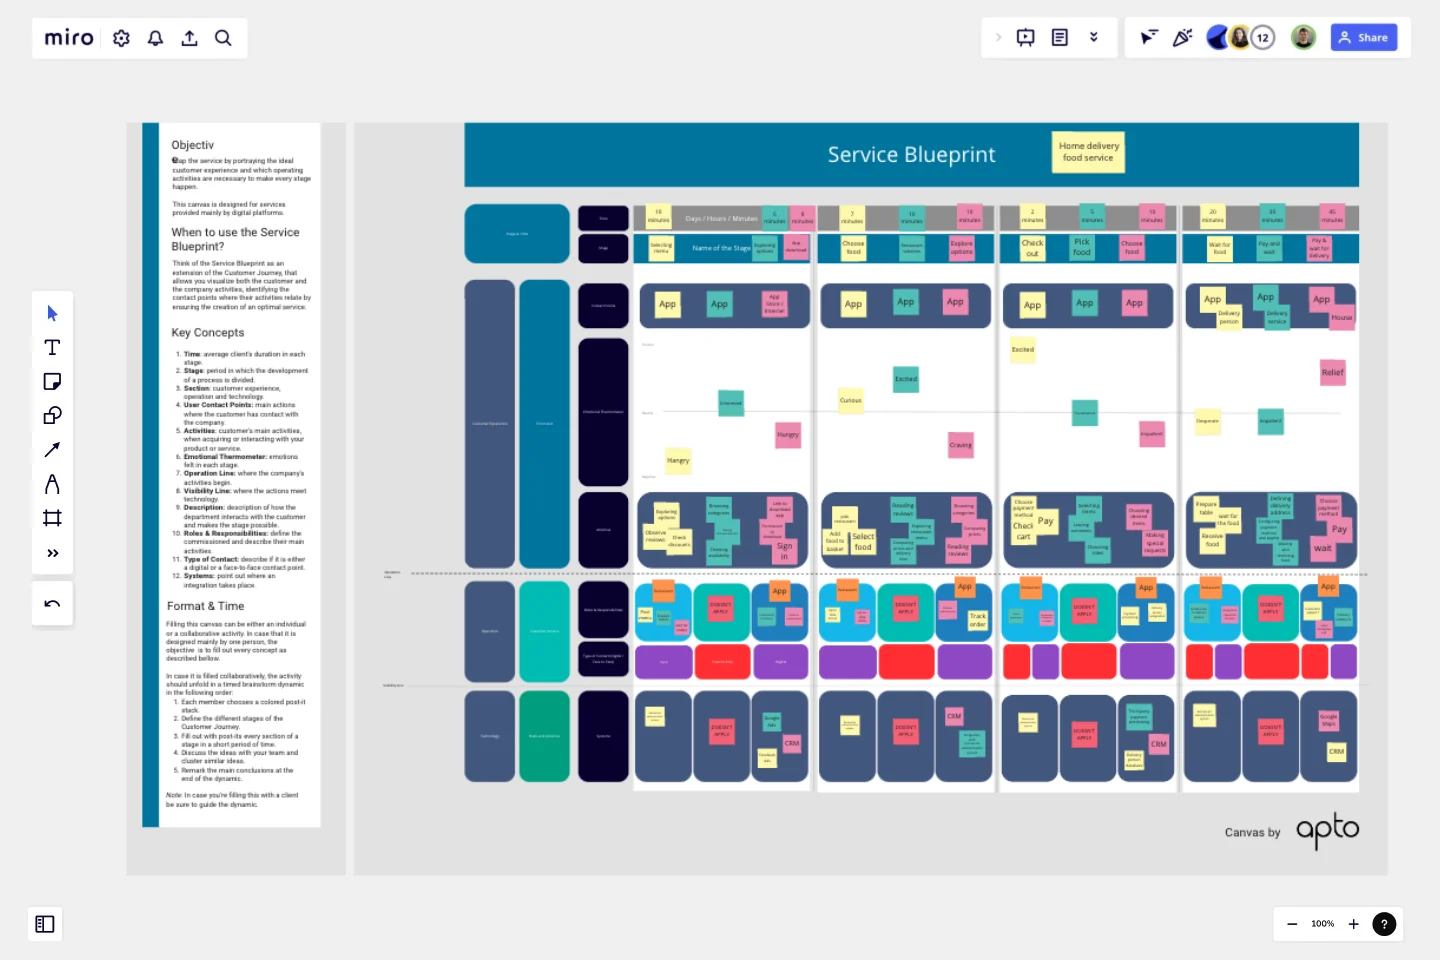
Service Blueprint by Apto Digital Innovation
This canvas is designed for services provided mainly by digital platforms.
Objective:
In 90 minutes, the team should be able to map the first iteration of the service blueprint by portraying the ideal customer experience and which operating activities are necessary to make every stage happen.
When to use the Service Blueprint?
Think of the Service Blueprint as an extension of the Customer Journey, that allows you visualize both the customer and the company activities, identifying the contact points where their activities relate by ensuring the creation of an optimal service.
Key Concepts:
Time: average client's duration in each stage.
Stage: period in which the development of a process is divided.
Section: customer experience, operation and technology.
User Contact Points: main actions where the customer has contact with the company.
Activities: customer's main activities, when acquiring or interacting with your product or service.
Emotional Thermometer: emotions felt in each stage.
Operation Line: where the company's activities begin.
Visibility Line: where the actions meet technology.
Description: description of how the department interacts with the customer and makes the stage possible.
Roles & Responsibilities: define the commissioned and describe their main activities.
Type of Contact: describe if it is either a digital or a face-to-face contact point.
Systems: point out where an integration takes place.
Format & Time
Filling this canvas can be either an individual or a collaborative activity. In case that it is designed mainly by one person, the objective is to fill out every concept as described below.In case it is filled collaboratively, the activity should unfold in a timed brainstorm dynamic in the following order:
Each member chooses a colored post-it stacks.
Define the different stages of the Customer Journey.
Fill out with post-its every section of a stage in a short period of time.
Discuss the ideas with your team and cluster similar ideas.
Remark the main conclusions at the end of the dynamic.
Note: In case you are filling this with a client be sure to guide the dynamic.
This template was created by Apto Digital Innovation.
Get started with this template right now.
Niching Down: Online Course Persona Empathy Map
Works best for:
Market Research, Research & Design
Niching Down Online Course Persona Empathy Map helps you tailor online courses to specific personas. By understanding their needs and motivations, you can design more effective and engaging course content. Perfect for course developers and educators.
Website Landing Page Wireframe Template
Works best for:
Wireframe, UX, Design
The Website Wireframe template equips you with everything needed to kickstart your next website or web page concept. Rather than starting from scratch, the template offers a ready-to-use, customizable layout for your designs. Change and rearrange the included pages and components to build the perfect wireframe for your project.
Product Development Roadmap Template
Works best for:
Product Management, Software Development
Product development roadmaps cover everything your team needs to achieve when delivering a product from concept to market launch. Your product development roadmap is also a team alignment tool that offers guidance and leadership to help your team focus on balancing product innovation and meeting your customer’s needs. Investing time in creating a roadmap focused on your product development phases helps your team communicate a vision to business leaders, designers, developers, project managers, marketers, and anyone else who influences meeting team goals.
Pet Sitting App Wireframe Template
Works best for:
Wireframes, UX, Design
Kick off your next app design project with the Pet Sitting App Wireframe template. This template includes multiple low-fidelity app design screens, providing everything you need to quickly and easily craft a pet sitting app.
Research Topic Brainstorm Template
Works best for:
Desk Research, Brainstorming, Ideation
Coming up with a topic for a research project can be a daunting task. Use the Research Topic Brainstorm template to take a general idea and transform it into something concrete. With the Research Topic Brainstorm template, you can compile a list of general ideas that interest you and then break them into component parts. You can then turn those parts into questions that might be the focus for a research project.
Cheat Sheet Template
To ensure quick and efficient understanding and usage of a product, many products come with a reference guide or cheat sheet. Similarly, when introducing an unfamiliar concept to new audiences, a cheat sheet can effectively communicate the key principles and main features. The idea is to treat the concept as a new product and create a concise and clear reference guide that explains its intended purpose and basic specifications in a simple and straightforward manner.
