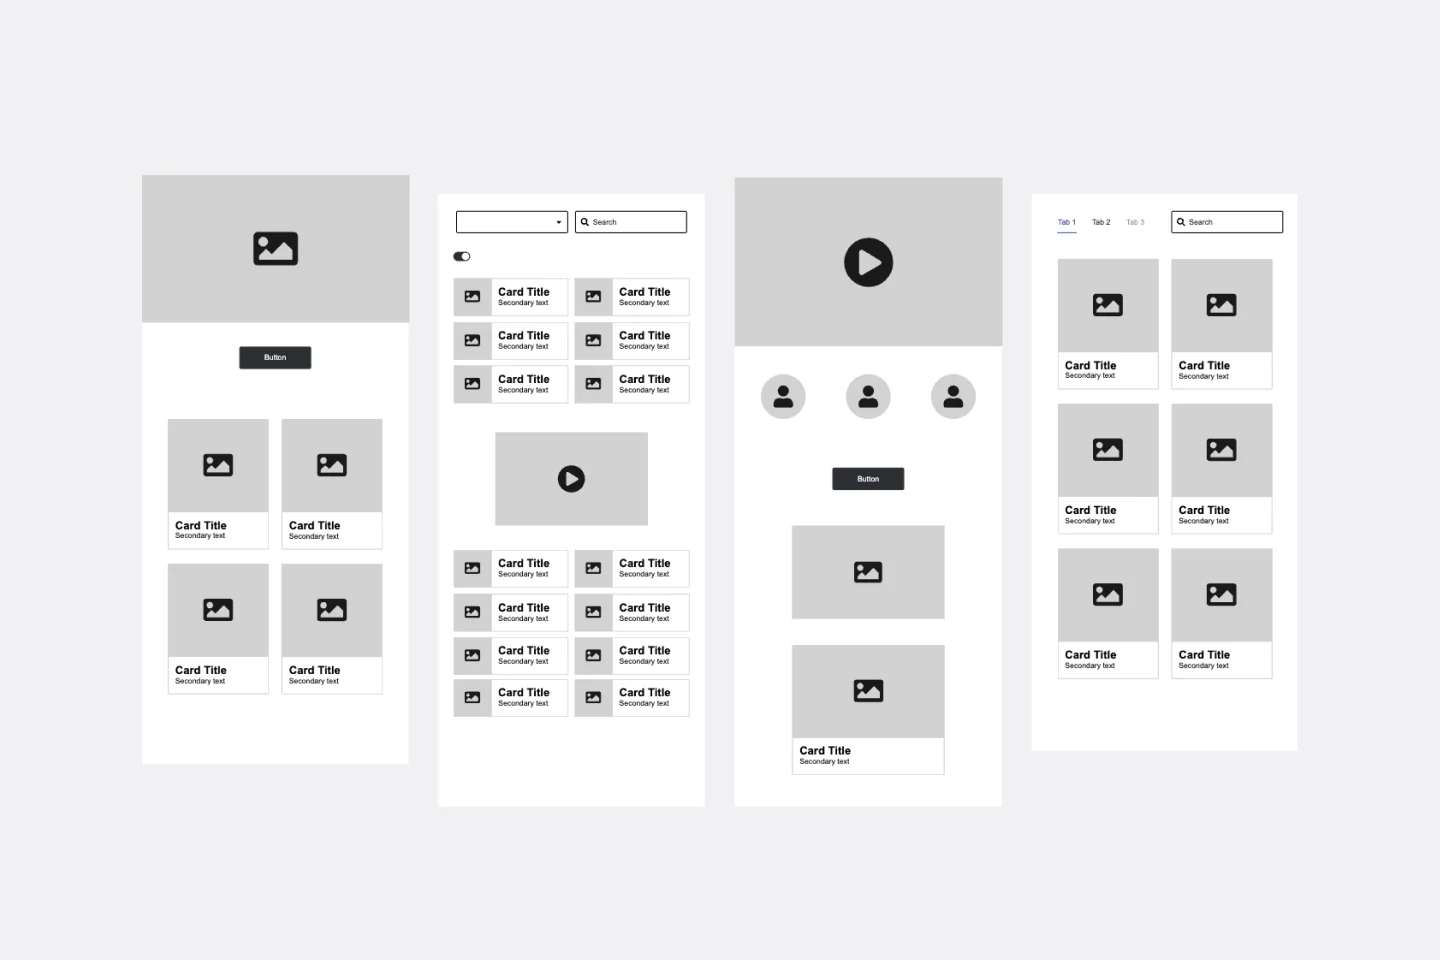
Screen Flow Template
Validate visual screen components in a user flow and gain insights about your user interaction. Build a better experience in every platform.
About the Screen Flow Template
Screen flows (also known as “wireflows”) are a combination of wireframes and creating a flowchart. The end-to-end flow maps out what users see on each screen and how it impacts their decision-making process through your product or service. With that information in hand, you can explain better the decisions you’ve made regarding your interaction design.
Use the Screen Flow Template to find new opportunities to make the user experience frictionless and free of frustration from start to end.
If you’re interested in developing your work further and getting in the realm of UX design, where you can showcase the user journey as a flowchart with texts and symbols rather than screens, you may be interested in the User Flow Template.
Keep reading to learn more about screen flows.
What is a Screen Flow?
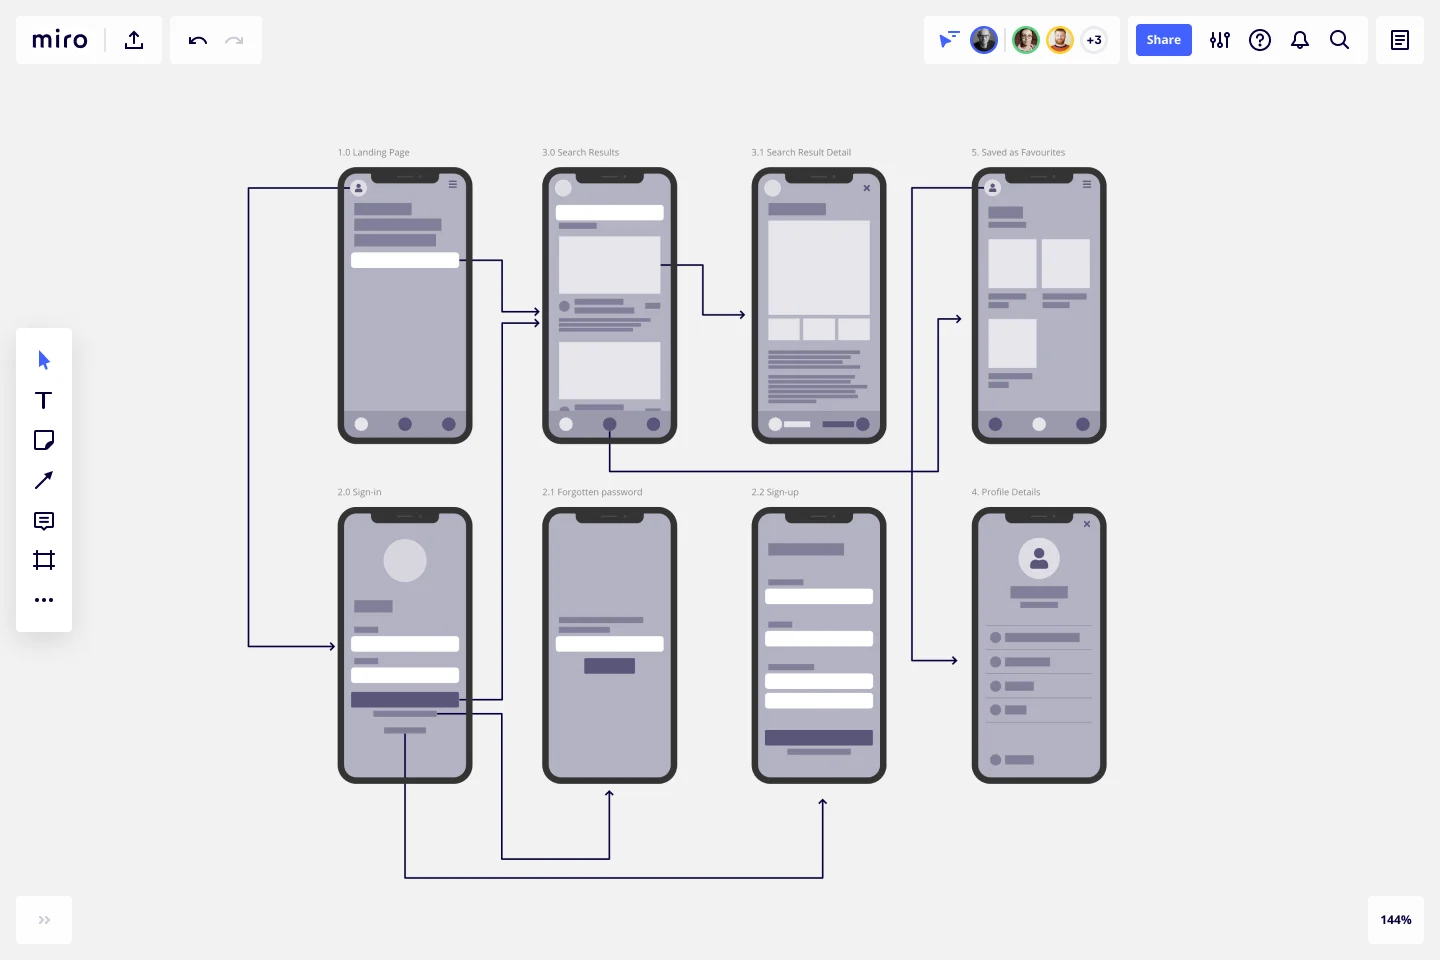
A screen flow (or wireflow) brings together a multi-screen layout, connected like a flowchart to map out a customer’s decision-making points and movements from start to end.
Wireframes on their own lack context for what an interactive, page-by-page user flow could look like. UX flows on their own are more abstract and can’t show you what your customer is actually looking at.
Wireflows, or screen flows, combine the strengths of both methods and help you make a case for how what the user sees makes a high impact on how they experience your product or service.
When to use Screen Flows
Wireframes help UX and product teams think of a customer journey as a full flow instead of a set of screens. The wireflow or screen flow focuses on the screens themselves and the customer's interaction with your service or product.
A designer can map out a screen flow when they need to …
Make sure there are no missing scenarios: with an end-to-end journey mapped out, you can consider all the potential use cases that apply to the customer’s needs.
Improve user interactions: get to know your customer through every opportunity in the flow, such as sign-ups, confirmations, or popups.
Create better cross-functional communication: bring designers and developers together, encouraging them to think about the whole experience rather than separate screens.
Engage in stakeholder education: if clients or teams have never considered what the customer sees when moving through your product or experience, following a flow helps build empathy for customer pain points.
Create your own Screen Flow
Making your screen flow is easy. Miro’s virtual collaboration platform provides the perfect canvas to create and share them. Get started by selecting the Screen Flow Template, then take the following steps to make one of your own.
1. Define your user story
Before you start mapping out a visual sequence, describe your user needs and pain points to be solved. This is your foundation to set up a starting point for your screen flow.
2. Decide what your key screens will show
Think through your start and endpoints in the journey. Do you need a landing page? Sign-up form screen? Confirmation page? Identify changes or additional steps to the process, such as pages that need to split or screens that need to be added. Miro is the perfect wireframe maker with a Wireframe Library that has over 15 UI components that you can easily add to your screen flow.
3. Connect the screens
Add and move arrows between each screen to move the user forward through the task, using Miro’s Connection Line tool. You can also include decision points and show what happens in every available instance to the user.
4. Share your screen flow with your team or stakeholders for feedback
You can use Miro’s Mention feature to tag your team or individual people for quick feedback rounds, design critiques, or reviews before live workshop sessions with clients. You can also share your Miro Board with anyone (even if they’re not already registered!) by clicking the Invite Members button.
Discover more user flow examples to help you build your next big thing.
What is screen flow in UX?
A screen flow helps you analyze your user’s interactions, focusing mainly on your product screens. It combines the best of wireframing and flowcharts, giving you a more detailed overview of your customer flow and, therefore, more data to build a better user experience.
Get started with this template right now.
Troubleshooting Flowchart Template
Works best for:
Diagramming , Flowcharts
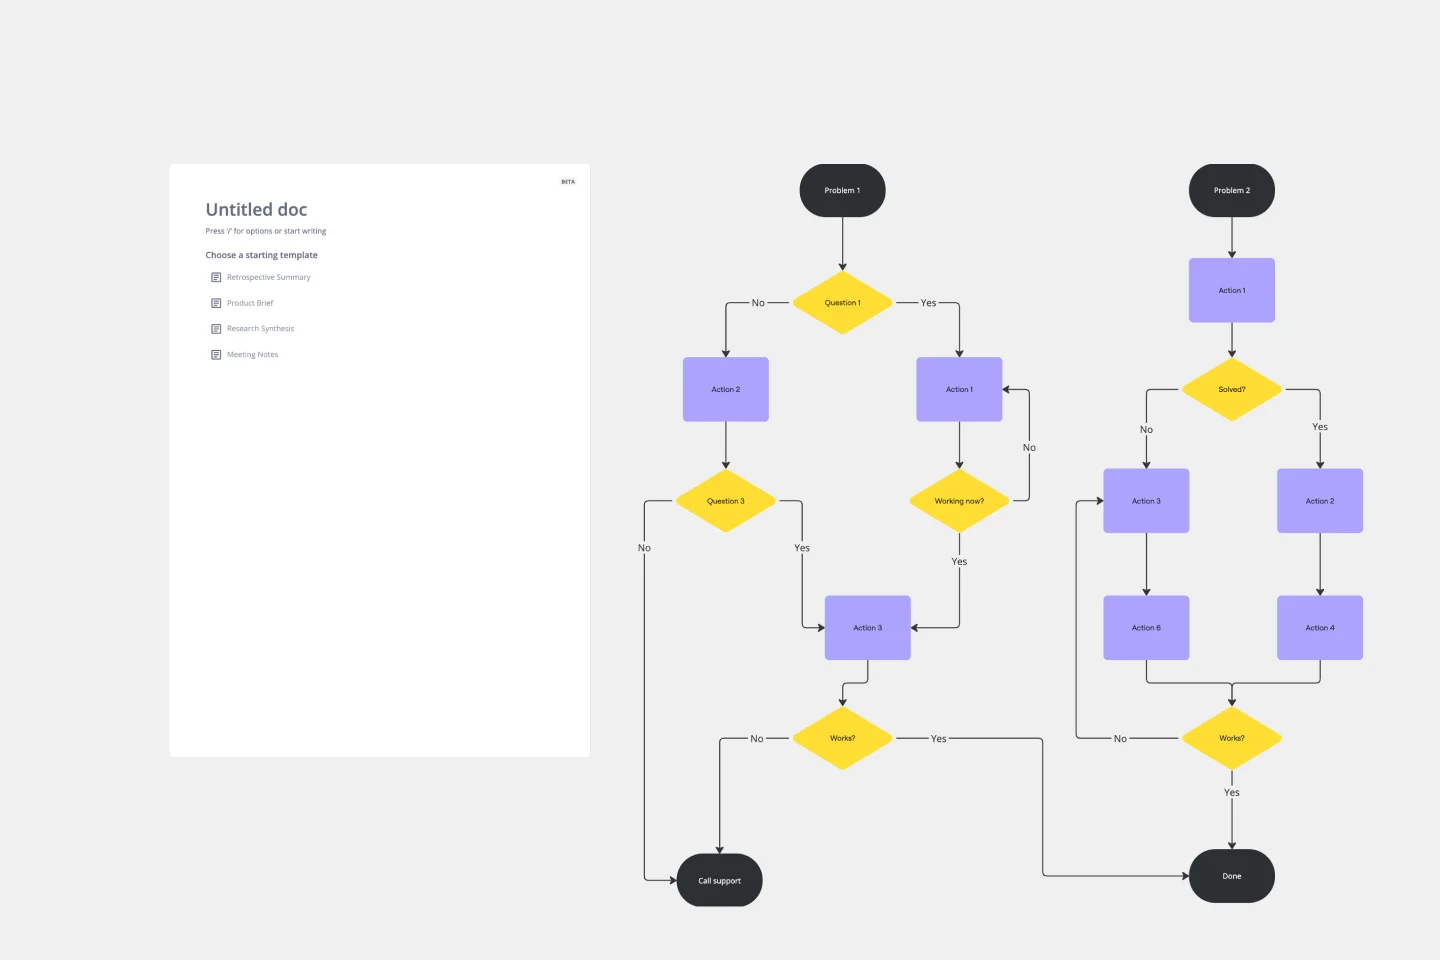
The Troubleshooting Flowchart Template is an easy-to-use and versatile tool that simplifies problem-solving. It provides a step-by-step visual guide to identify, analyze, and fix issues, ensuring a clear and structured approach to troubleshooting. One of the key benefits of utilizing this template is that it helps improve communication among team members. By representing the troubleshooting steps visually, it simplifies complex processes and makes it easier for team members to understand, collaborate, and contribute efficiently.
Look Mock Analyze Template
Works best for:
Design, Desk Research, Product Management
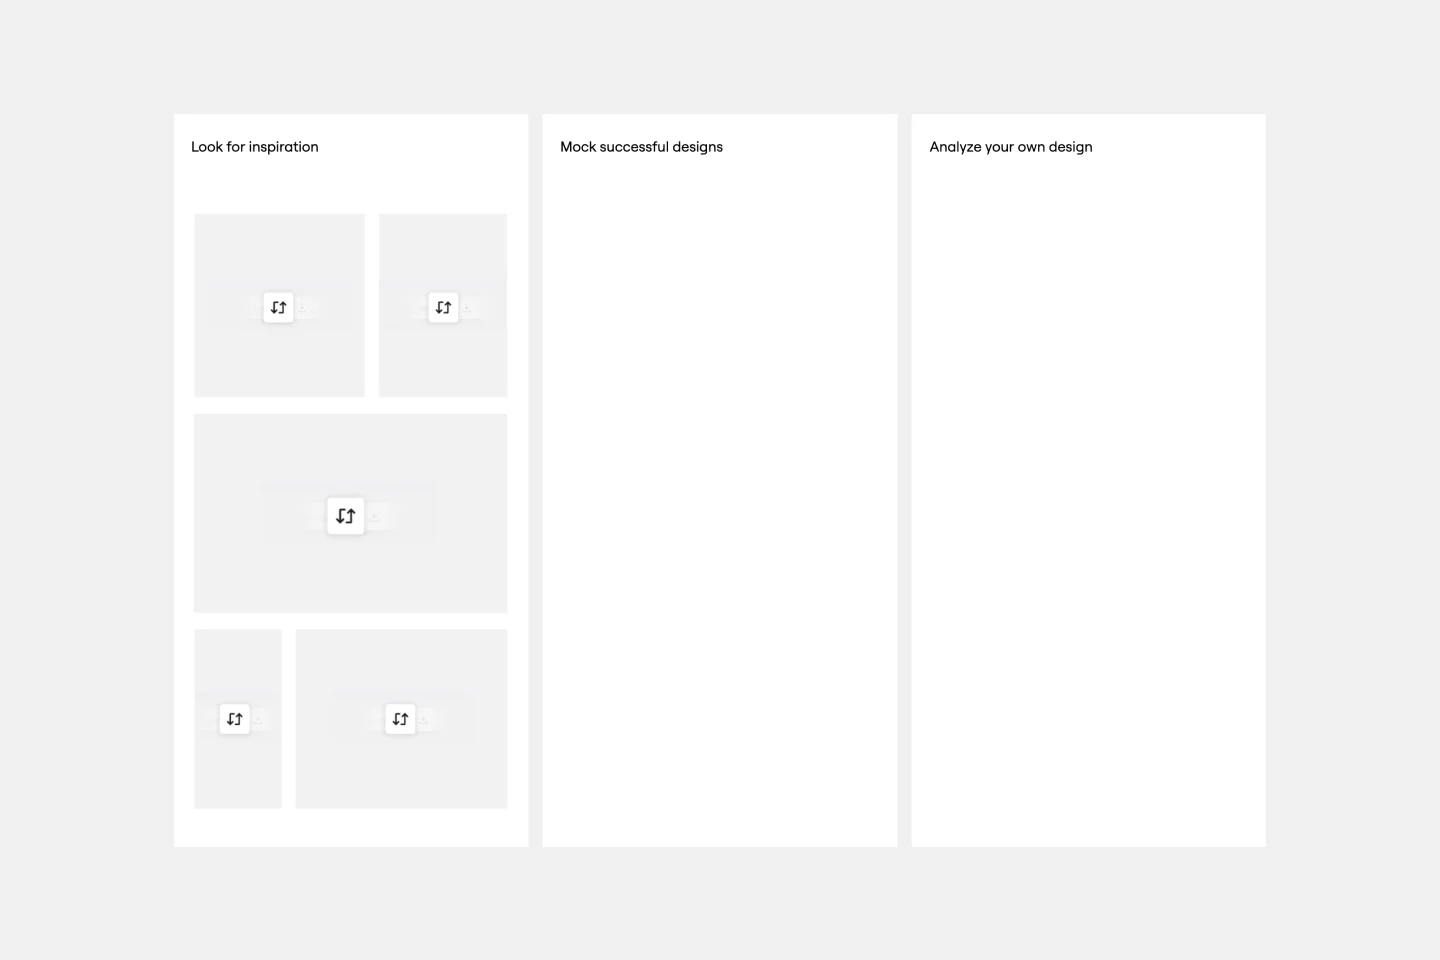
Doing your homework (aka, the research) is a key step in your design process, and the Look, Mock, Analyze approach helps you examine, structure, and streamline that step. With this powerful tool you’ll be able to identify your strengths and weaknesses, what you did right or wrong, and whether you spent time efficiently. Our Look, Mock, Analyze template makes it so easy for you to discover inspiration, mock up designs, and get feedback — you can start by setting up your board in less than a minute.
On-Premise to Cloud Migration Process Flowchart Template
Works best for:
Flowcharts
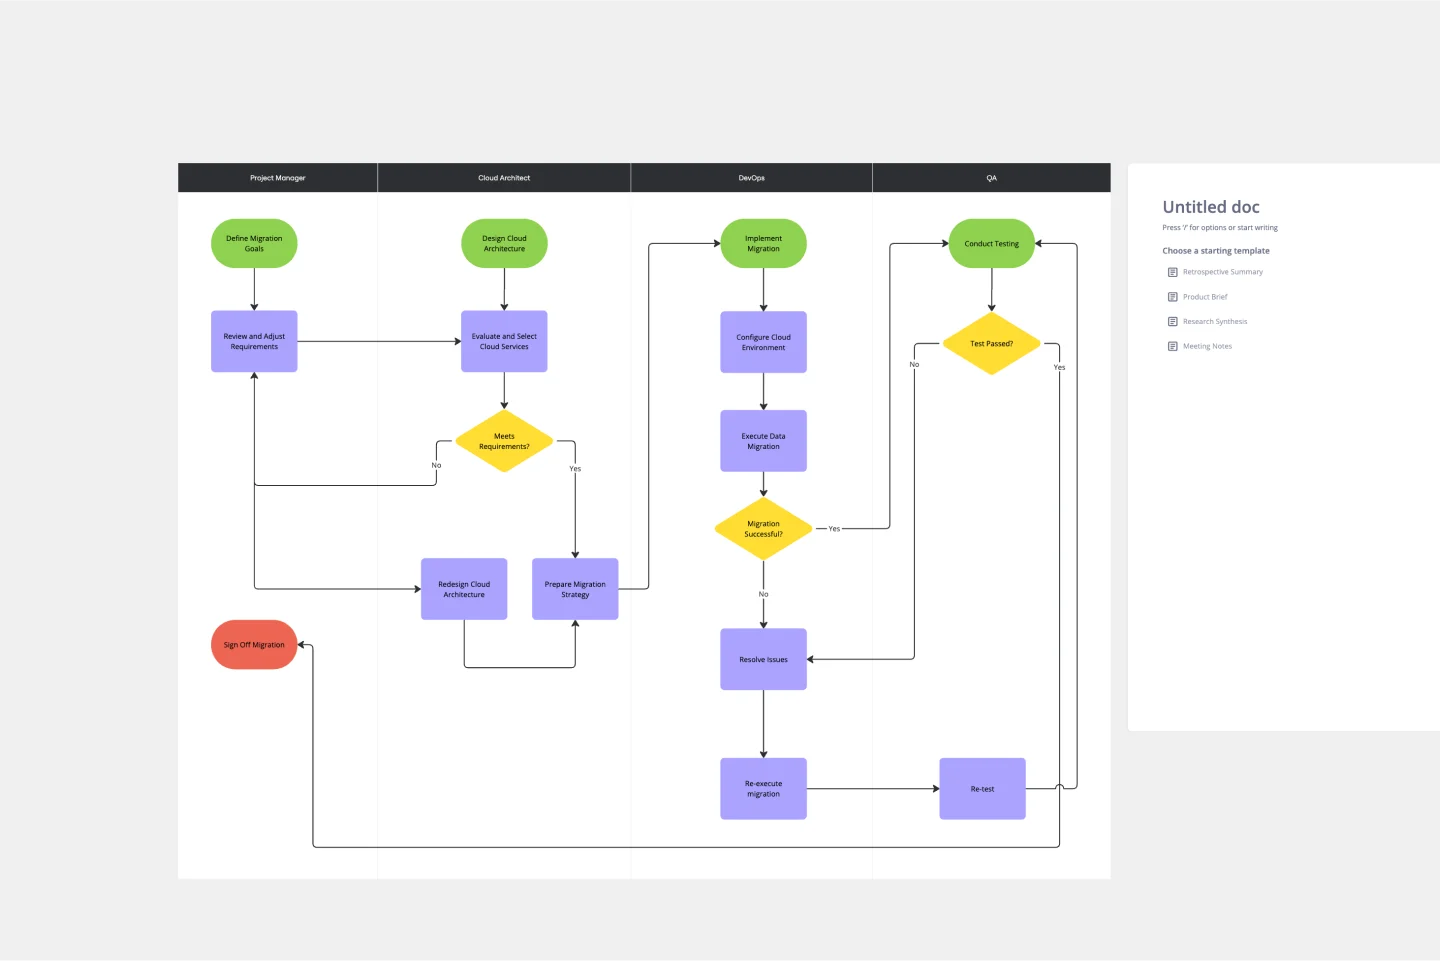
The On-Premise to Cloud Migration Process Flowchart Template is a strategic tool designed to streamline the transition from traditional on-premise systems to more flexible, scalable cloud-based solutions. This template acts as a visual roadmap, guiding teams through each phase of the migration process with clarity and precision. By breaking down the migration into manageable steps, it ensures a comprehensive approach, minimizing risks and aligning with best practices for cloud adoption.
Low-fidelity Wireframes Template
Works best for:
Desk Research, Product Management, Wireframes
When you’re designing a site or building an app, the early stages should be BIG — seeing the big picture and communicating the big idea. Low fidelity wireframes empower you to see it and do it. These rough layouts (think of them as the digital version of a sketch on a napkin) help your teams and project stakeholders quickly determine if a design meeting meets your users’ needs. Our template lets you easily use wireframes during meetings or workshops, presentations, and critique sessions.
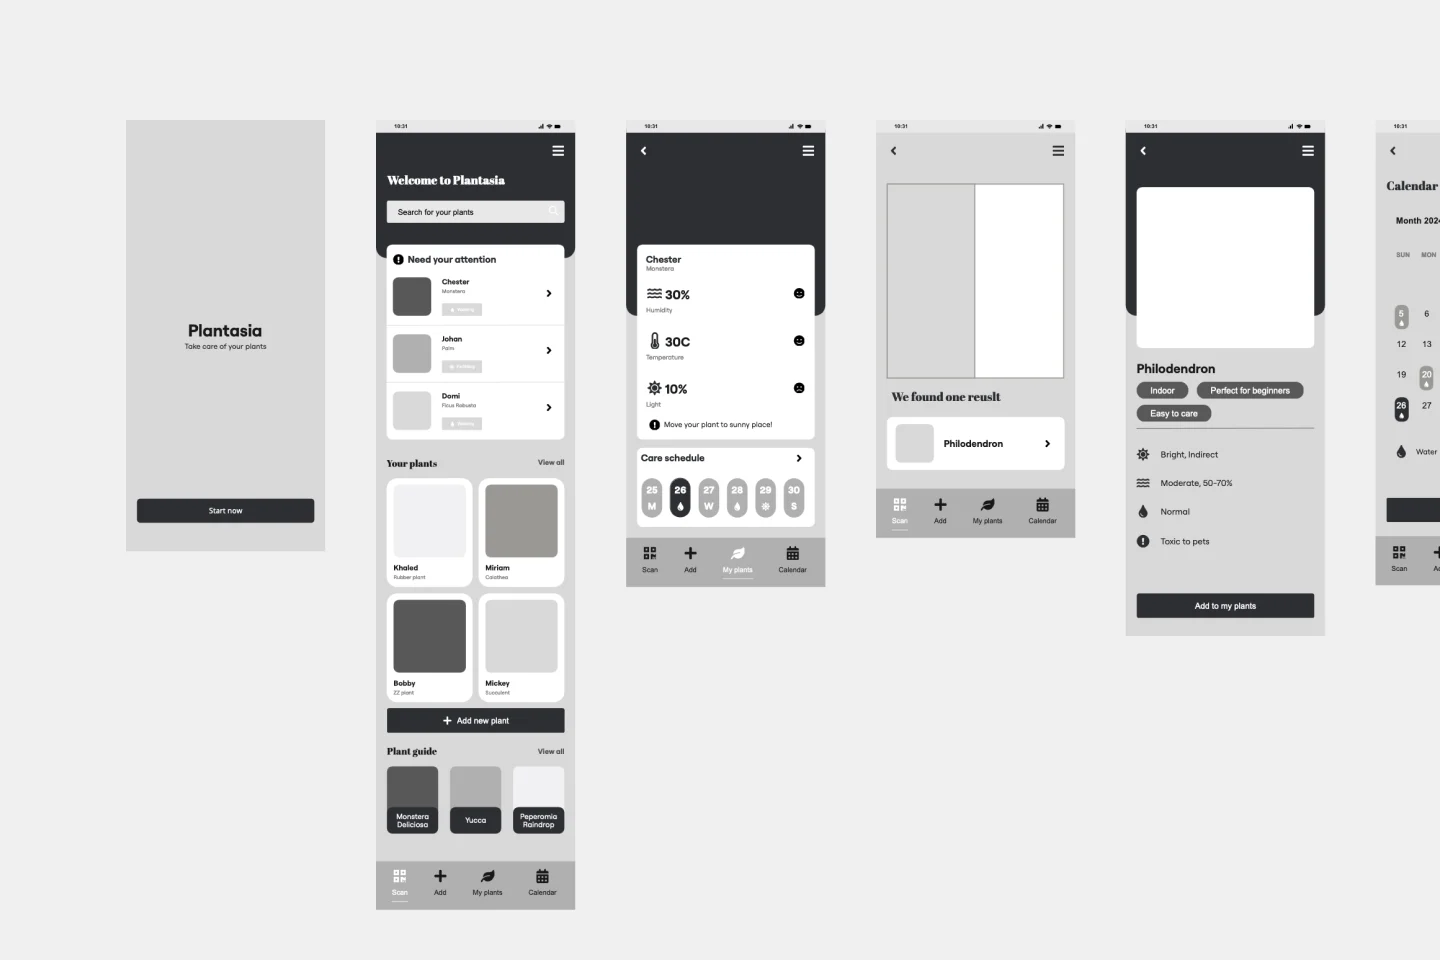
Plant Care App Wireframe Template
Works best for:
Wireframe, UX, Design
The Plant Care App Wireframe template provides a multi-screen app wireframe along with all the necessary design pages to get started. You can easily customize the wireframe to meet the specific needs of your client or personal project. Add, remove, or adjust screens to create a smooth user flow, and personalize the design by modifying colors, typography, and layouts. Leverage our AI-powered features to further enhance your app design.
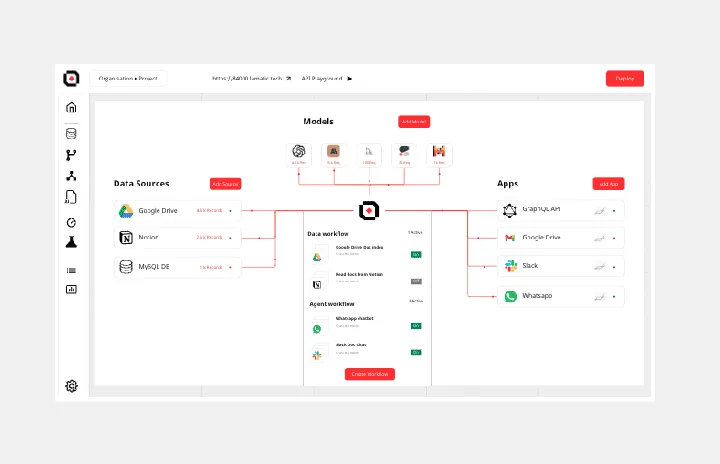
GenAI Application Workflow
Works best for:
Flowcharts, Mapping, Diagrams
The GenAI Application Workflow template is a visual tool for mapping out the workflow of applications developed using GenAI. It provides elements for defining process steps, decision points, and data flows within the application. This template enables developers and project teams to visualize the application workflow, identify potential bottlenecks, and optimize the user experience. By promoting clarity and efficiency in application development, the GenAI Application Workflow empowers teams to deliver innovative and user-friendly applications effectively.