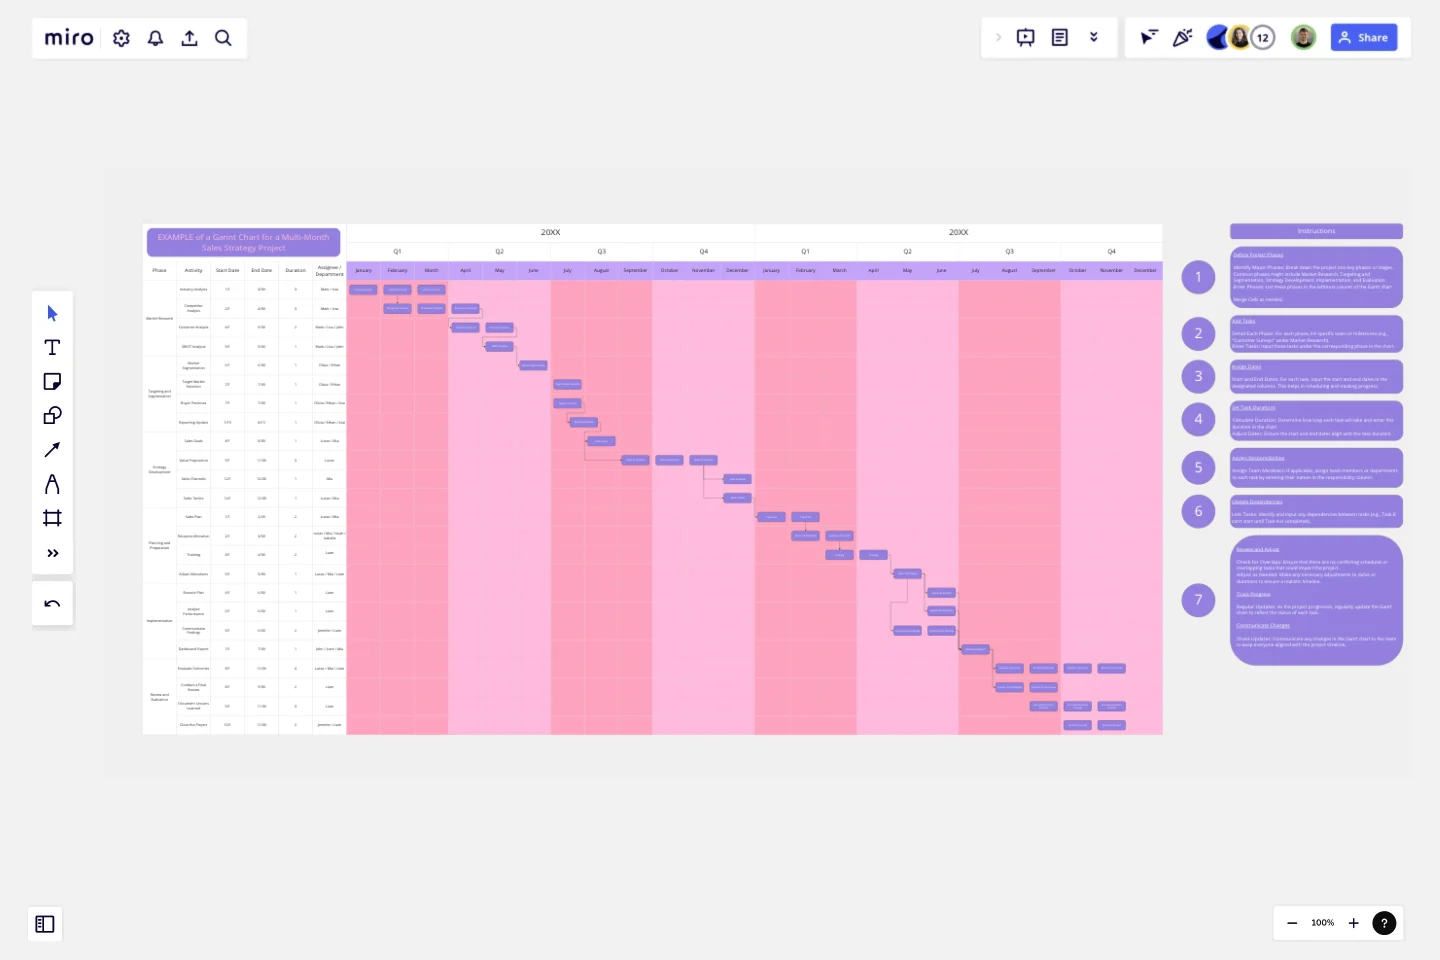
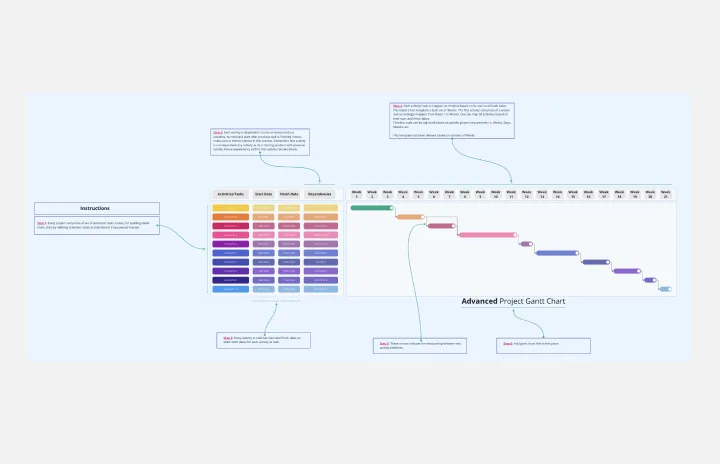
Sales Strategy Gantt Chart
The Sales Strategy Gantt Chart template is designed to help teams plan, execute, and track their sales strategy efficiently.
This template provides a visual timeline of tasks and milestones, ensuring that all aspects of the sales strategy are organized and managed effectively.
Key Features:
Project Phases: Includes clearly defined phases relevant to sales strategy development and execution, such as Market Research, Targeting and Segmentation, Strategy Development, Planning and Preparation, Implementation, Performance Monitoring, Review and Evaluation, and Optimization.
Task Breakdown: Allows for detailed listing of tasks or milestones within each phase (e.g., "Competitive Analysis" under Market Research), ensuring that all necessary activities are planned and tracked.
Timeline Visualization: Offers a visual representation of the project timeline, including start and end dates for each task. This helps in scheduling and understanding how tasks overlap or depend on each other.
Task Dependencies: Shows dependencies between tasks, indicating which tasks need to be completed before others can start. This facilitates better planning and coordination.
Responsibility Assignment: Provides columns to assign responsibilities to team members or departments, ensuring clear ownership and accountability for each task.
Progress Tracking: Includes sections for updating the status of each task, making it easier to monitor progress and address any issues or delays.
Resource Allocation: Helps in managing and tracking the resources needed for each task, ensuring that the necessary tools, budget, and personnel are allocated effectively.
Why Use the Sales Strategy Gantt Chart Template?
Structured Planning: Helps structure and organize the entire sales strategy project, ensuring all phases and tasks are accounted for and scheduled properly.
Visual Clarity: Provides a clear, visual timeline of the project, making it easy to understand the schedule, identify critical deadlines, and see how tasks are interconnected.
Effective Coordination: By showing task dependencies and assigning responsibilities, it aids in coordinating efforts among team members, avoiding conflicts, and ensuring timely execution.
Enhanced Tracking: Allows for regular updates and tracking of task progress and resource utilization, helping to keep the project on track and address any deviations promptly.
Resource Management: Assists in managing and optimizing resources by providing an overview of how and when resources are needed and used.
Informed Decision-Making: Supports better decision-making by providing a comprehensive and structured view of the sales strategy project, helping to make adjustments as needed based on progress and performance.
When to Use This Template:
When Developing a New Sales Strategy: To ensure comprehensive planning and execution from the start.
For Complex Sales Projects: To manage and track multiple phases and tasks effectively.
When Coordinating a Sales Team: To clearly assign tasks and responsibilities and track progress across different team members.
The Sales Strategy Gantt Chart template is a valuable tool for managing sales strategy projects, providing clarity, structure, and efficiency in planning, executing, and tracking the sales strategy.
This template was created by Anthony.
Get started with this template right now.
VRIO Analysis Template
Works best for:
Diagramming, Strategy
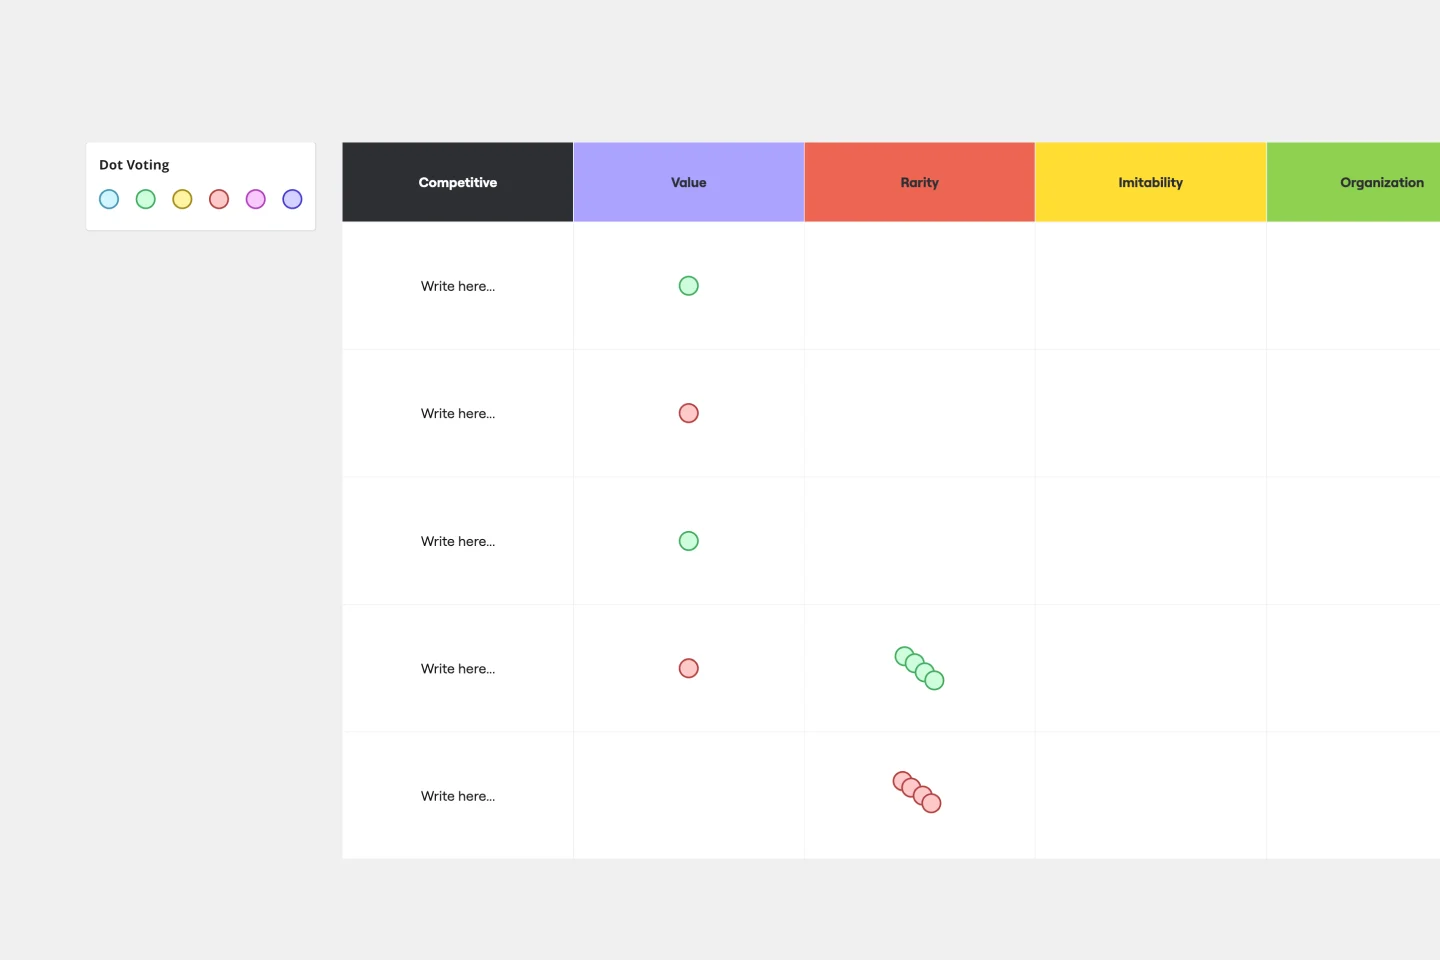
The VRIO Analysis Template is a framework that helps businesses evaluate their resources and capabilities for competitive advantage. It categorizes resources into four areas: Value, Rarity, Imitability, and Organization. This provides a comprehensive view of an organization's strengths and potential weaknesses. The template has the key benefit of offering quick visual insights. Decision-makers can immediately identify and focus on resources that are valuable, rare, hard to imitate, and well-organized. This ensures a sustainable competitive edge and saves time by avoiding lengthy textual analyses.
Syllabus Template
Works best for:
Education
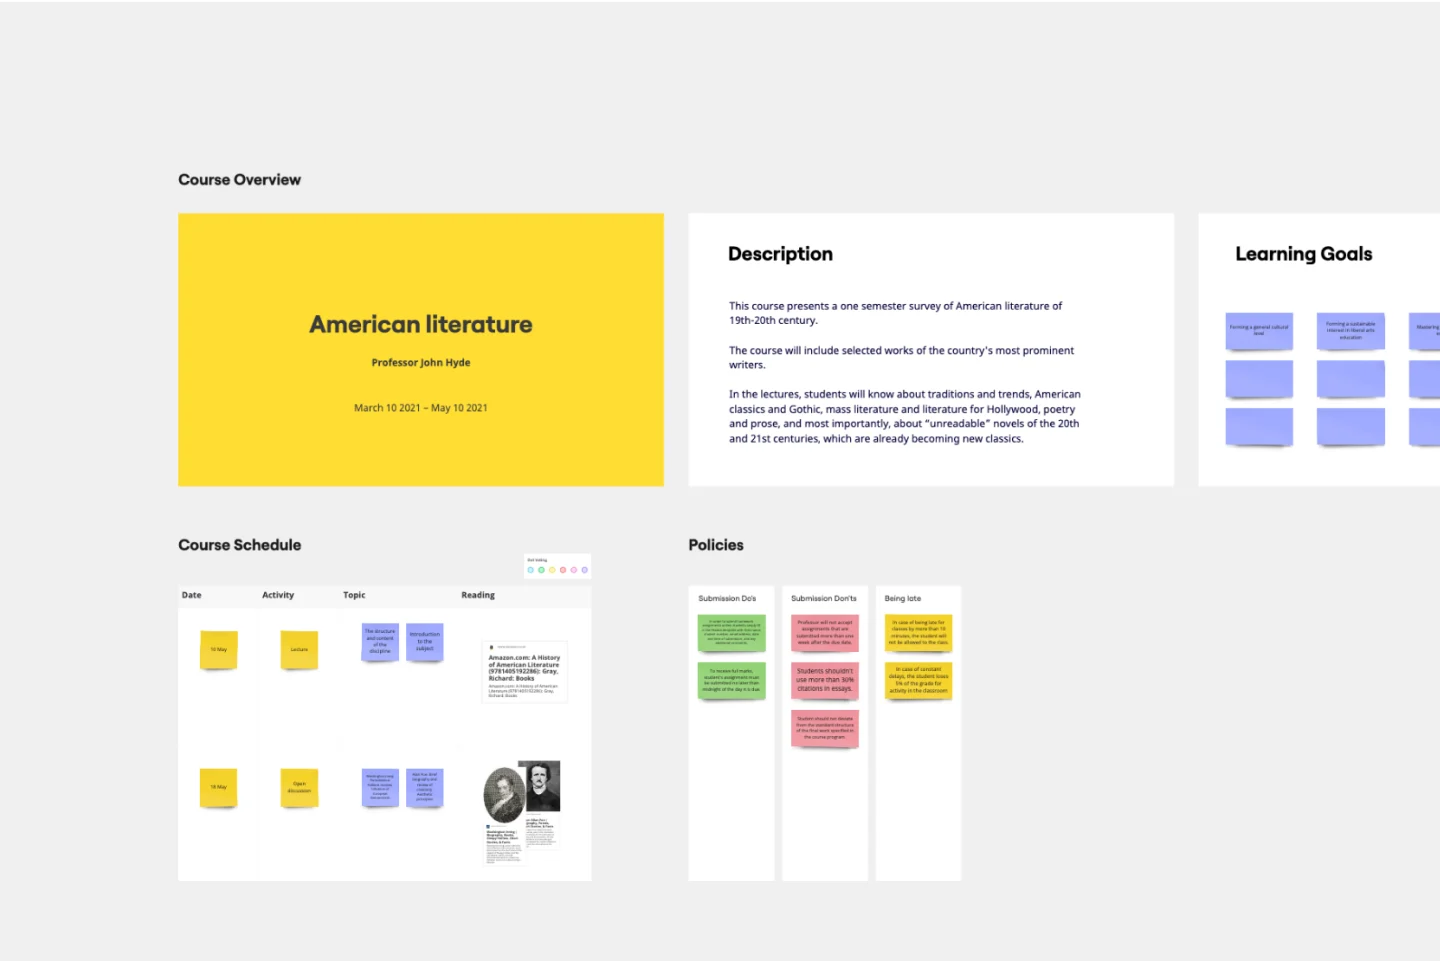
A Syllabus is a brief guide to your course, including expectations for your students, readings they will complete throughout the course, and a mission statement or course description. The Syllabus outlines any policies your students should follow during the course, rules and regulations that apply to them, and anything else your students should know. A Syllabus is a valuable tool for orienting your students, and it’s important the syllabus be clear and easy to follow. Use the Syllabus template to streamline the process of creating a simple, intuitive syllabus for your course.
OKR Planning Template
Works best for:
Strategic Planning, Meetings, Workshops
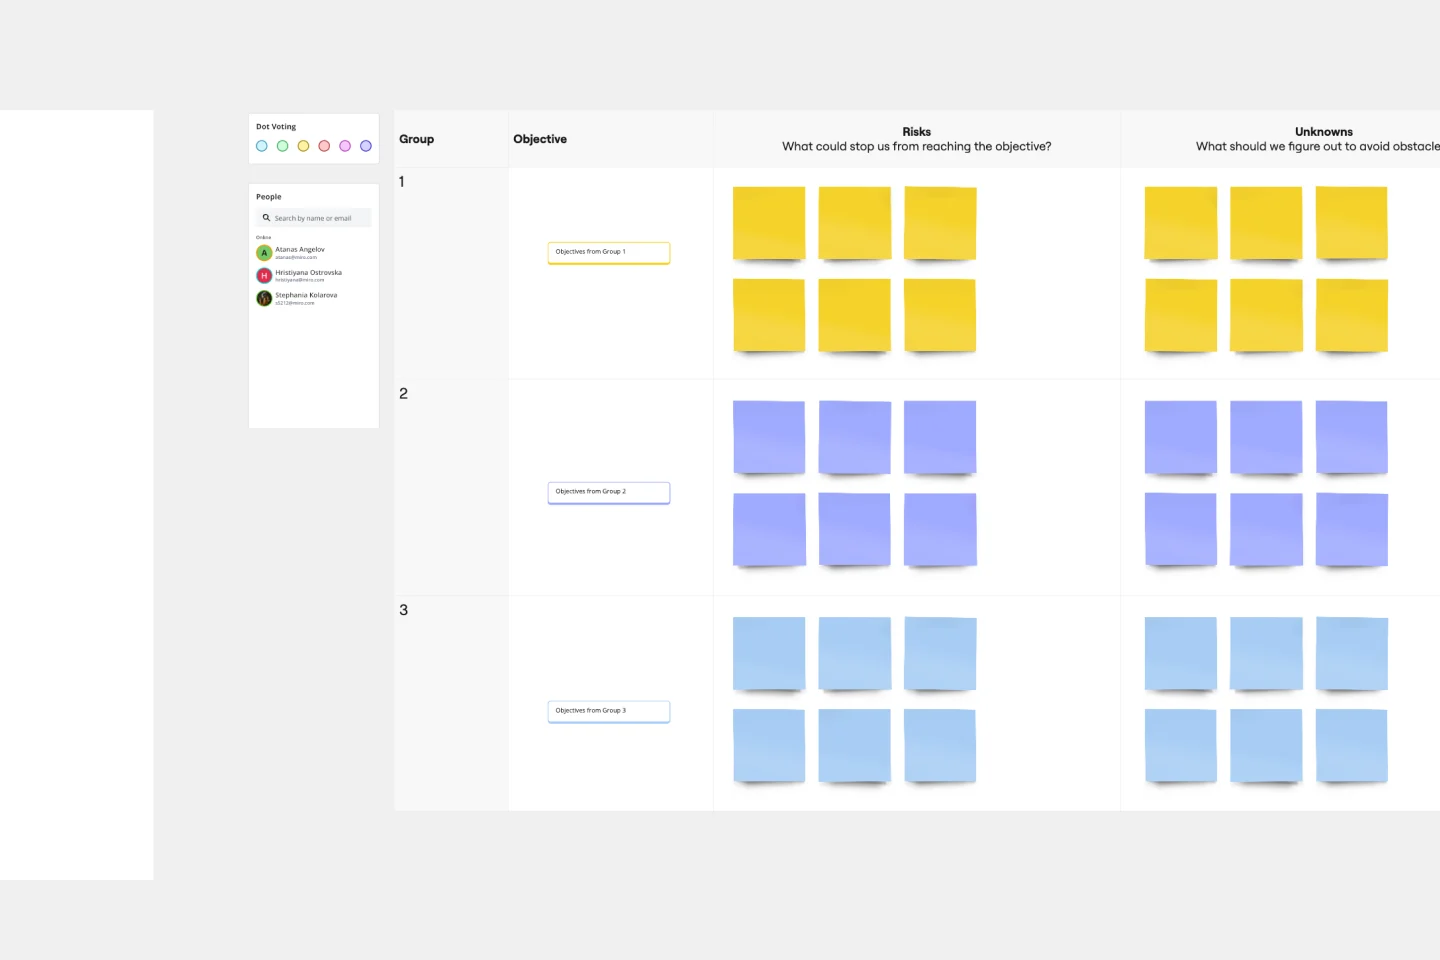
The OKR Planning template helps you turn exhaustive OKR sessions into dynamic and productive meetings. Use this template to make OKR planning more interactive, guiding your team through the session with creative Ice Breakers and Brainstorms, so you can co-create your OKRs and define the key results and action plans to achieve them.
Advanced Project Gantt Chart Template
Works best for:
Gantt Chart, Planning
Manage complex projects with ease using the Advance Project Gantt Chart Template. This tool helps you schedule tasks, set deadlines, and track progress in a visual format. Ensure that all team members are aligned and that your project stays on track. Ideal for project managers handling multifaceted projects with multiple dependencies and timelines.
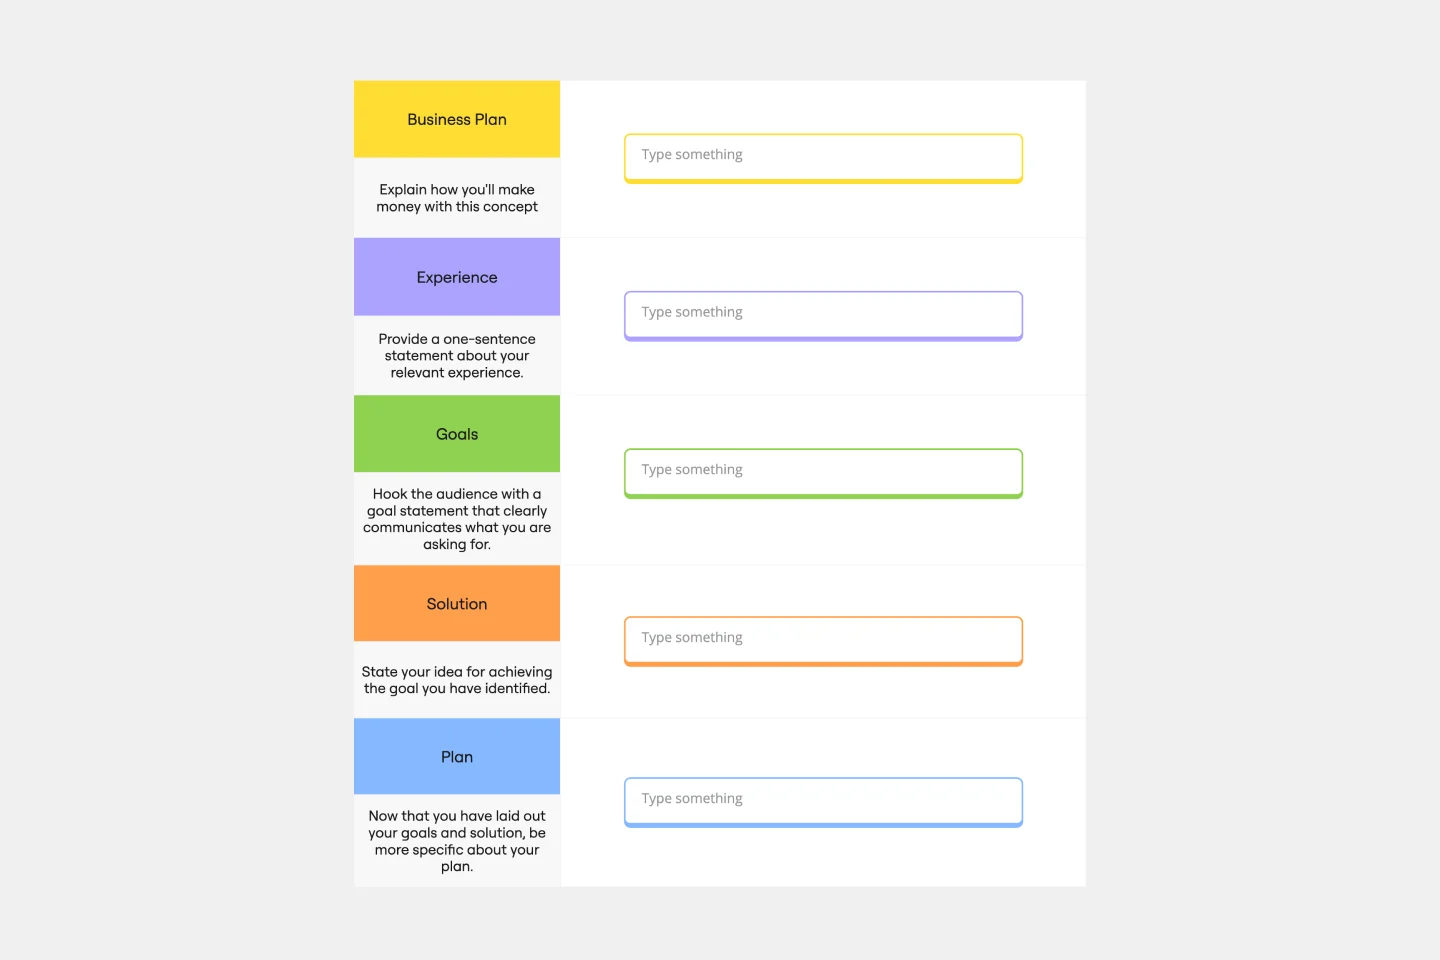
Business Pitch Template
Works best for:
Business Pitch
The Business Pitch Template uses visual aids to enhance your pitch, making it more impactful and easier to understand. This gives your pitch an edge, leaving a lasting impression and greatly improving your ability to convey your ideas persuasively.
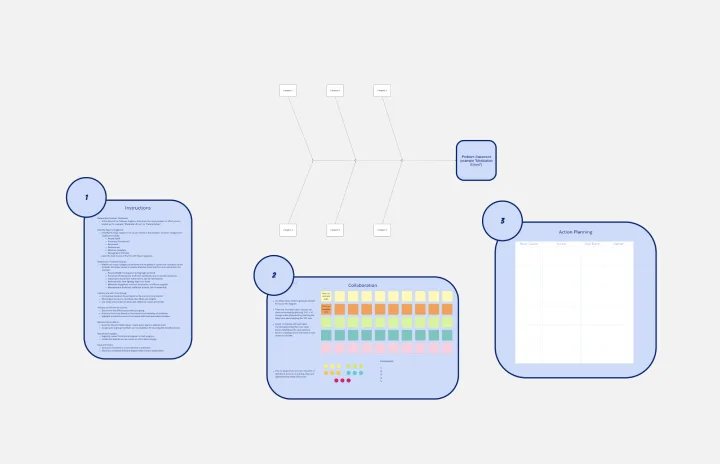
Fishbone Diagram for Healthcare
Works best for:
Fishbone Diagram
Ensuring high-quality care in healthcare settings requires a thorough understanding of root causes behind issues. The Fishbone Diagram for Healthcare template helps you analyze potential causes of problems in areas like patient care, staff performance, and administrative processes. This structured approach facilitates comprehensive analysis and collaborative problem-solving, ultimately leading to improved healthcare outcomes and patient satisfaction.