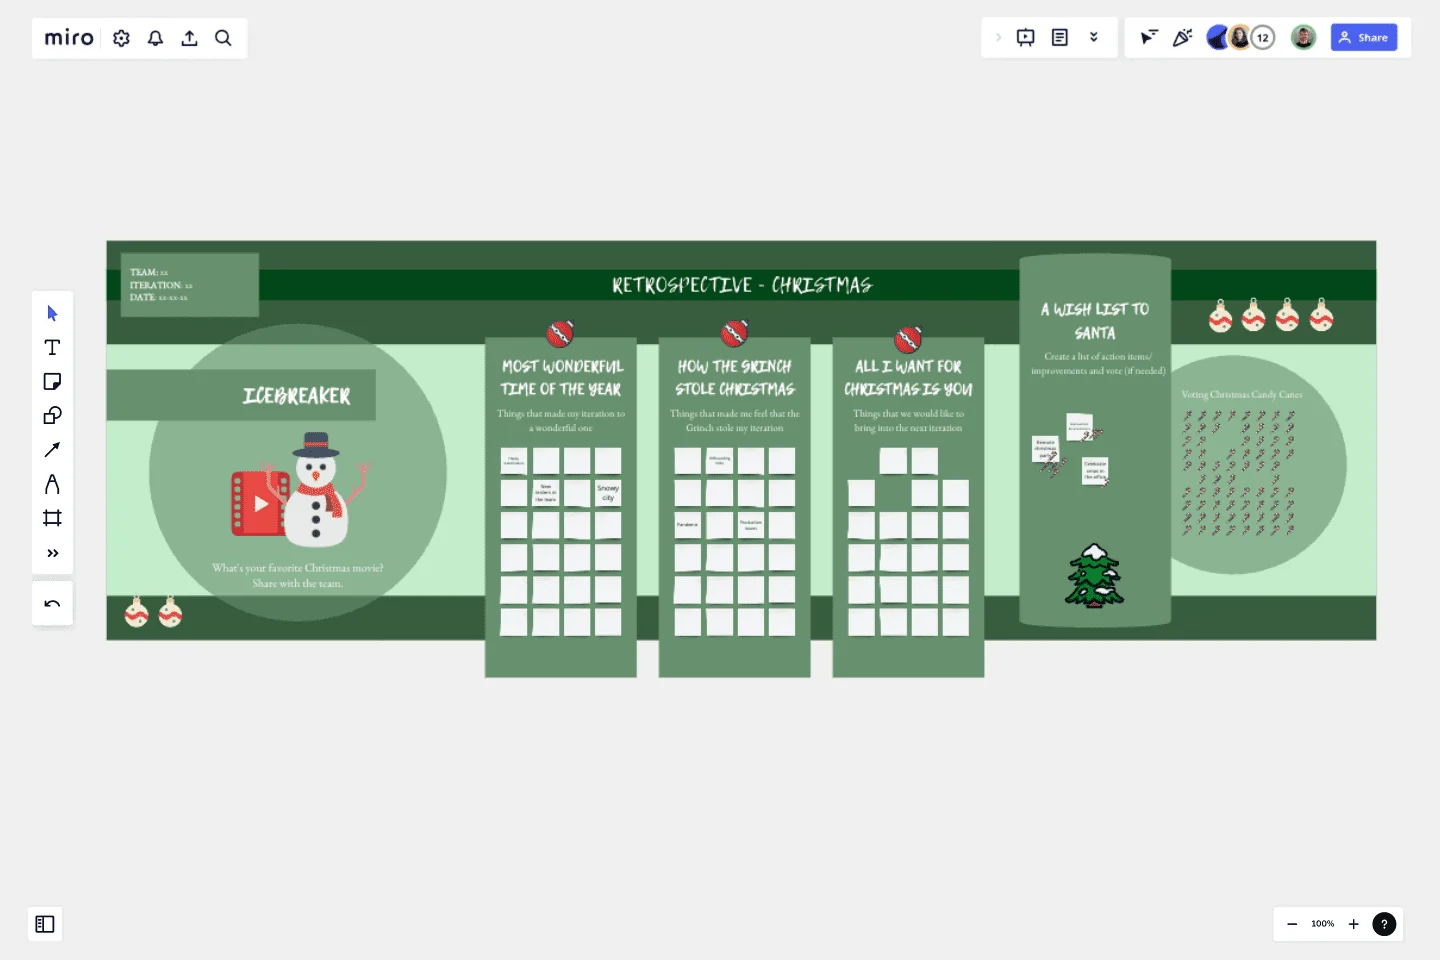
Retrospective - Christmas Edition
This is a retrospective with a touch of Christmas.
Start with an icebreaker and share your favorite Christmas movie with the team.
Most wonderful time of the year? - Things that made my iteration to a wonderful one.
How the Grinch stole Christmas? Things that made me feel that the Grinch stole my iteration.
All I want for Christmas is you - Things that we would like to bring into the next iteration.
Tips! Play some music in the background while the team is writing the notes.
This template was created by Nhi Tran.
Get started with this template right now.
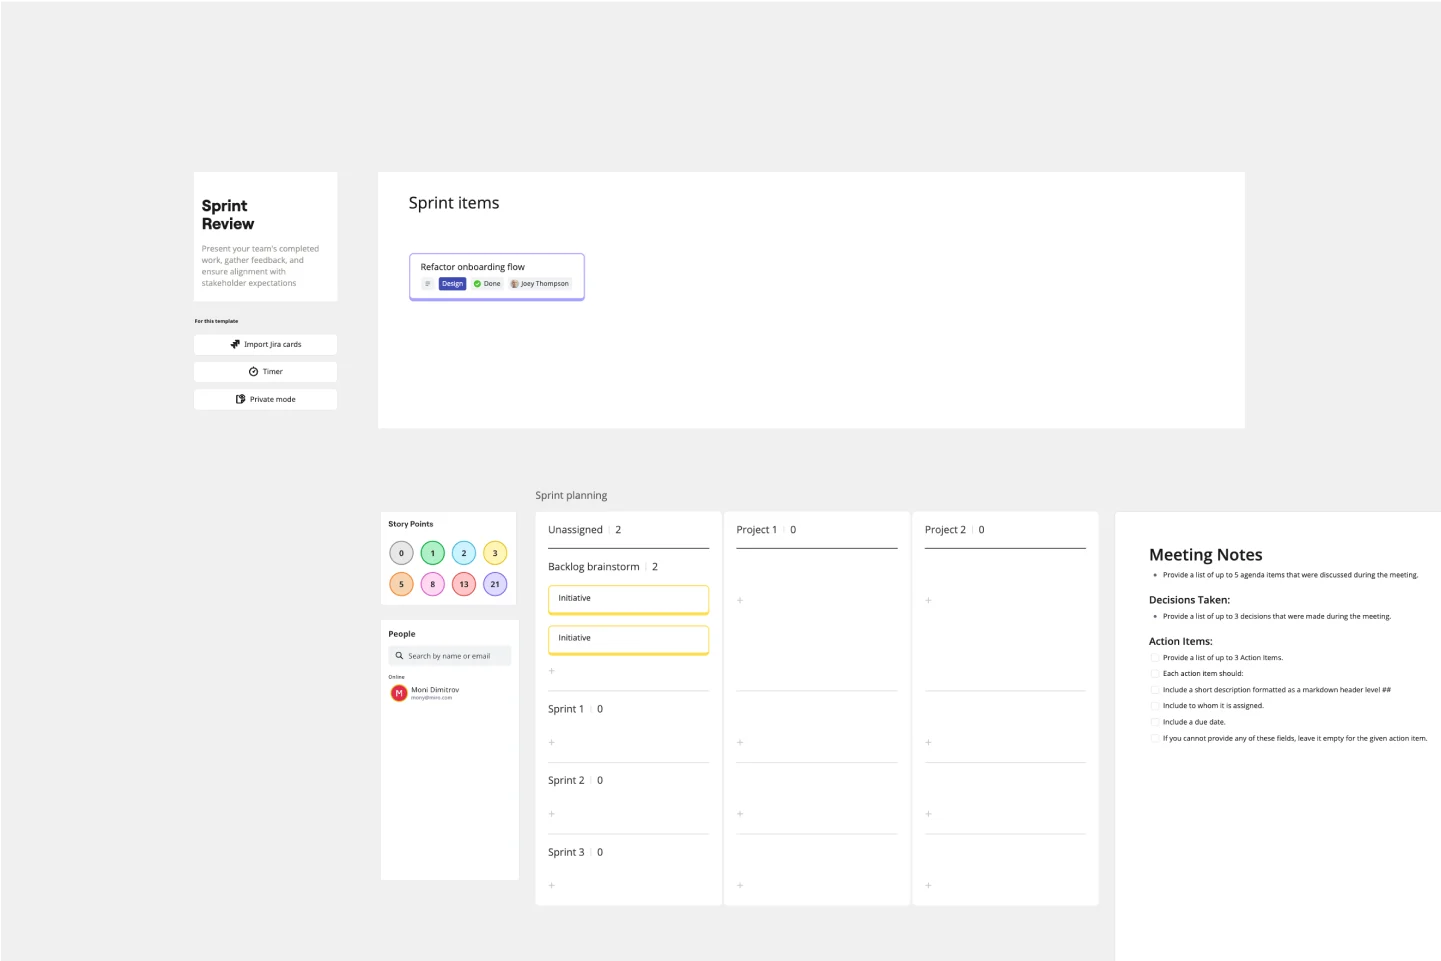
Sprint Review Template
Works best for:
Sprint Review, Agile
The Sprint Review Template is a vital tool in Agile project management that enhances communication between team members and stakeholders by providing a clear format for presenting the sprint's accomplishments and challenges. It encourages active participation and feedback from all attendees, leading to more informed decision-making and continuous improvement. In essence, it's a catalyst for meaningful dialogue and collaborative growth.
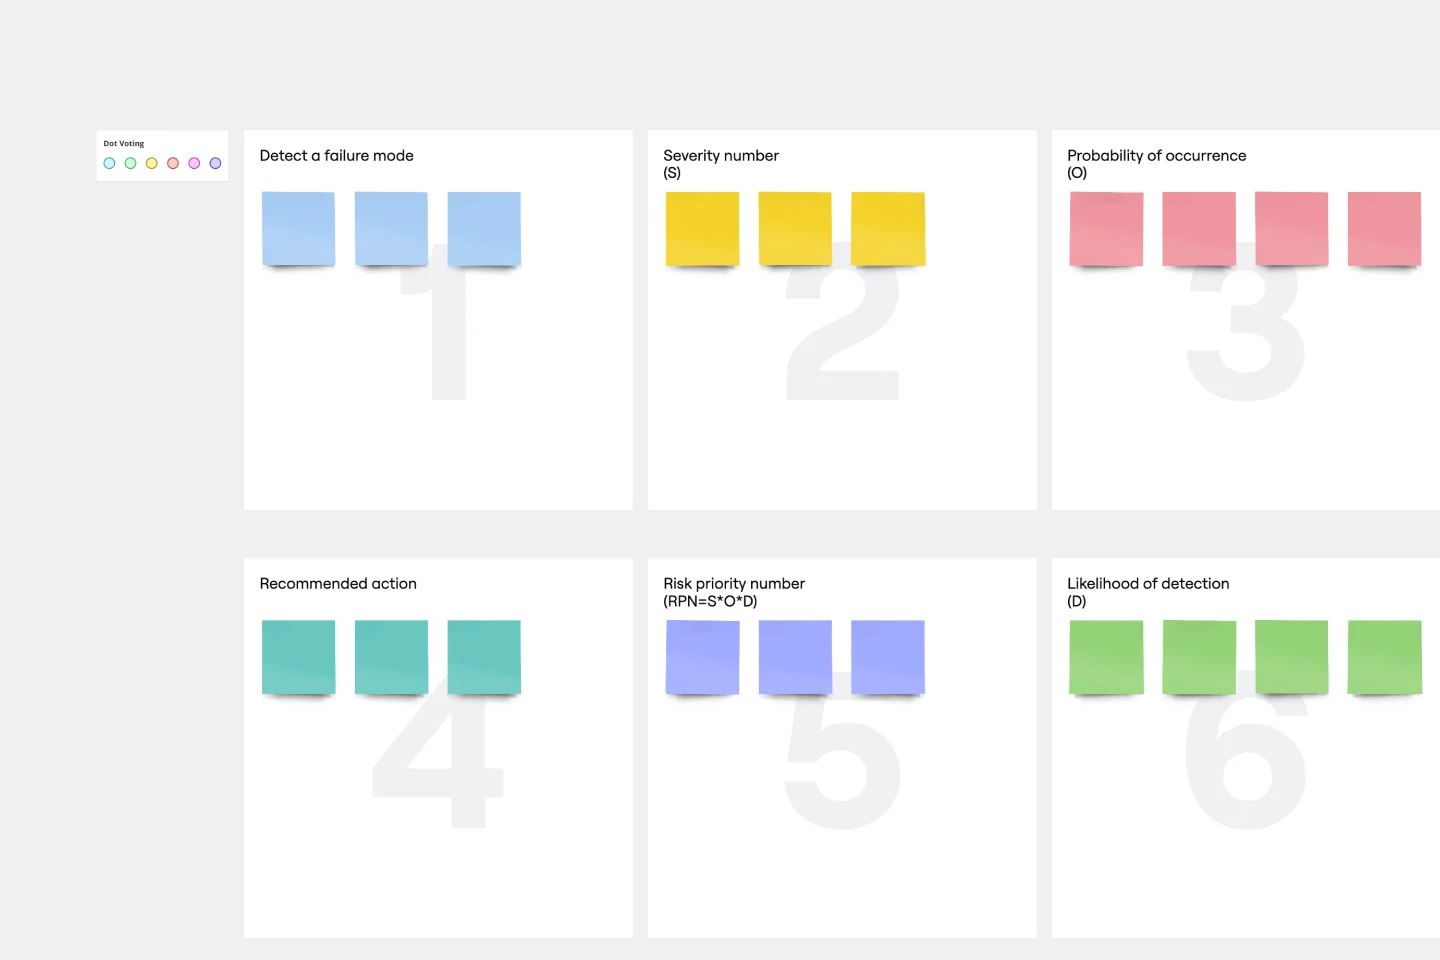
FMEA Analysis Template
Works best for:
Agile Methodology, Strategic Planning, Software Development
When you’re building a business or running a team, risk comes with the territory. You can’t eliminate it. But you CAN identify it and mitigate it, to up your odds of success. Failure Modes and Effects Analysis (FMEA) is a powerful tool designed to help you manage risk and potential problems by spotting them within a process, product, or system. And you’ll spot them earlier in your process—to let you sidestep costly changes that arise late in the game or, worse, after they’ve impacted your customers and their experience.
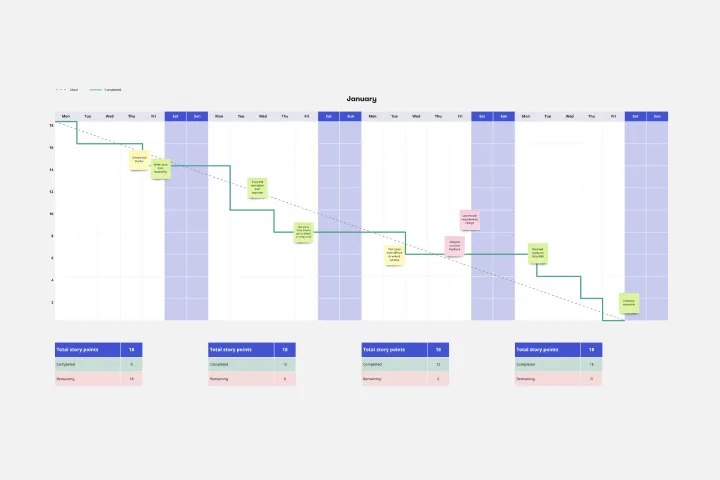
Burndown Chart Template
Works best for:
Project Management, Agile Workflows, Mapping
Whoa whoa whoa, pace yourself! That means knowing how much work is left—and, based on the delivery date, how much time you’ll have for each task. Perfect for project managers, Burndown Charts create a clear visualization of a team’s remaining work to help get it done on time and on budget. These charts have other big benefits, too. They encourage transparency and help individual team members be aware of their work pace so they can adjust or maintain it.
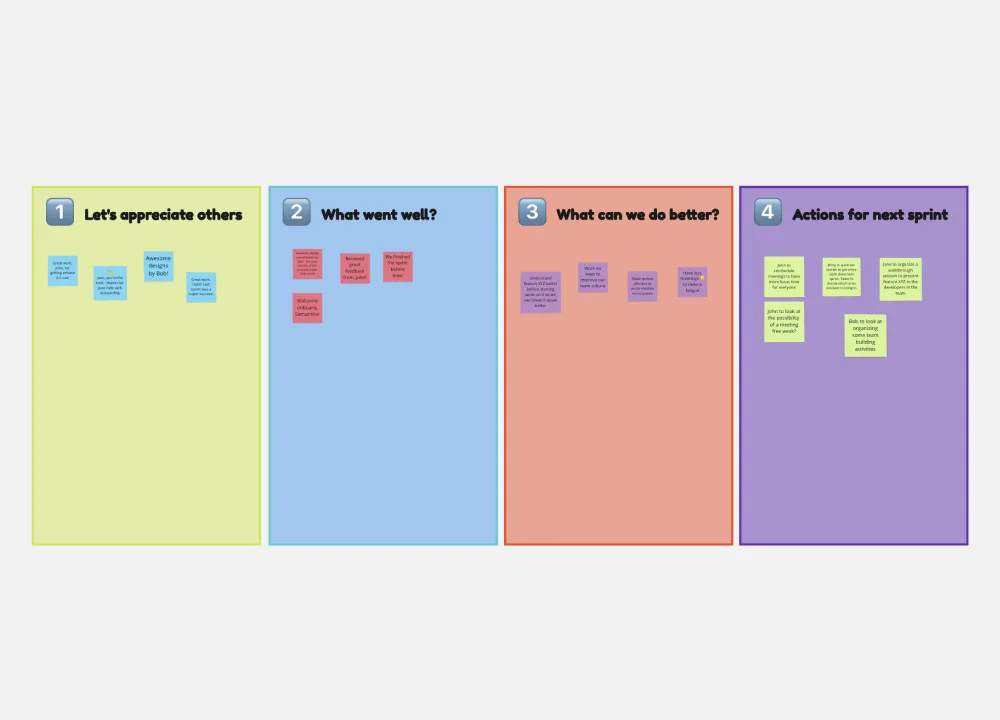
The 4-Step Retrospective
Works best for:
Retrospectives, Agile Methodology, Meetings
The 4-Step Retrospective template offers a simple yet effective framework for conducting retrospectives. It provides steps for reflecting on what went well, what didn't go well, what could be improved, and action planning. This template enables teams to systematically review past iterations, identify areas for growth, and implement actionable improvements. By promoting a structured approach to reflection and improvement, the 4-Step Retrospective empowers teams to drive continuous learning and enhancement effectively.
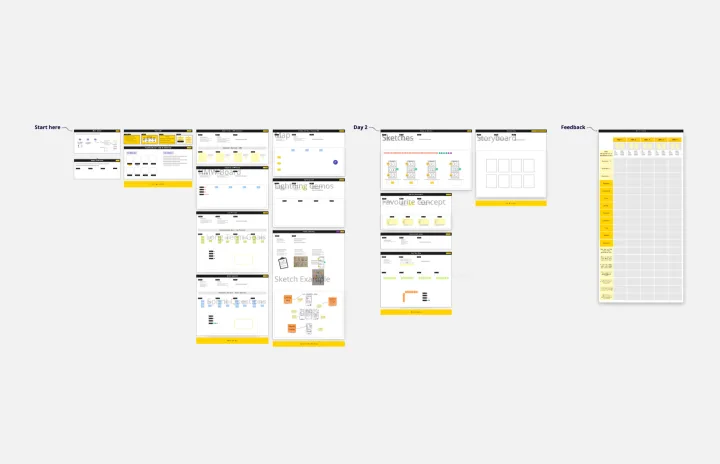
Remote Design Sprint Template
Works best for:
Design, Desk Research, Sprint Planning
A design sprint is an intensive process of designing, iterating, and testing a prototype over a 4 or 5 day period. Design sprints are conducted to break out of stal, work processes, find a fresh perspective, identify problems in a unique way, and rapidly develop solutions. Developed by Google, design sprints were created to enable teams to align on a specific problem, generate multiple solutions, create and test prototypes, and get feedback from users in a short period of time. This template was originally created by JustMad, a business-driven design consultancy, and has been leveraged by distributed teams worldwide.
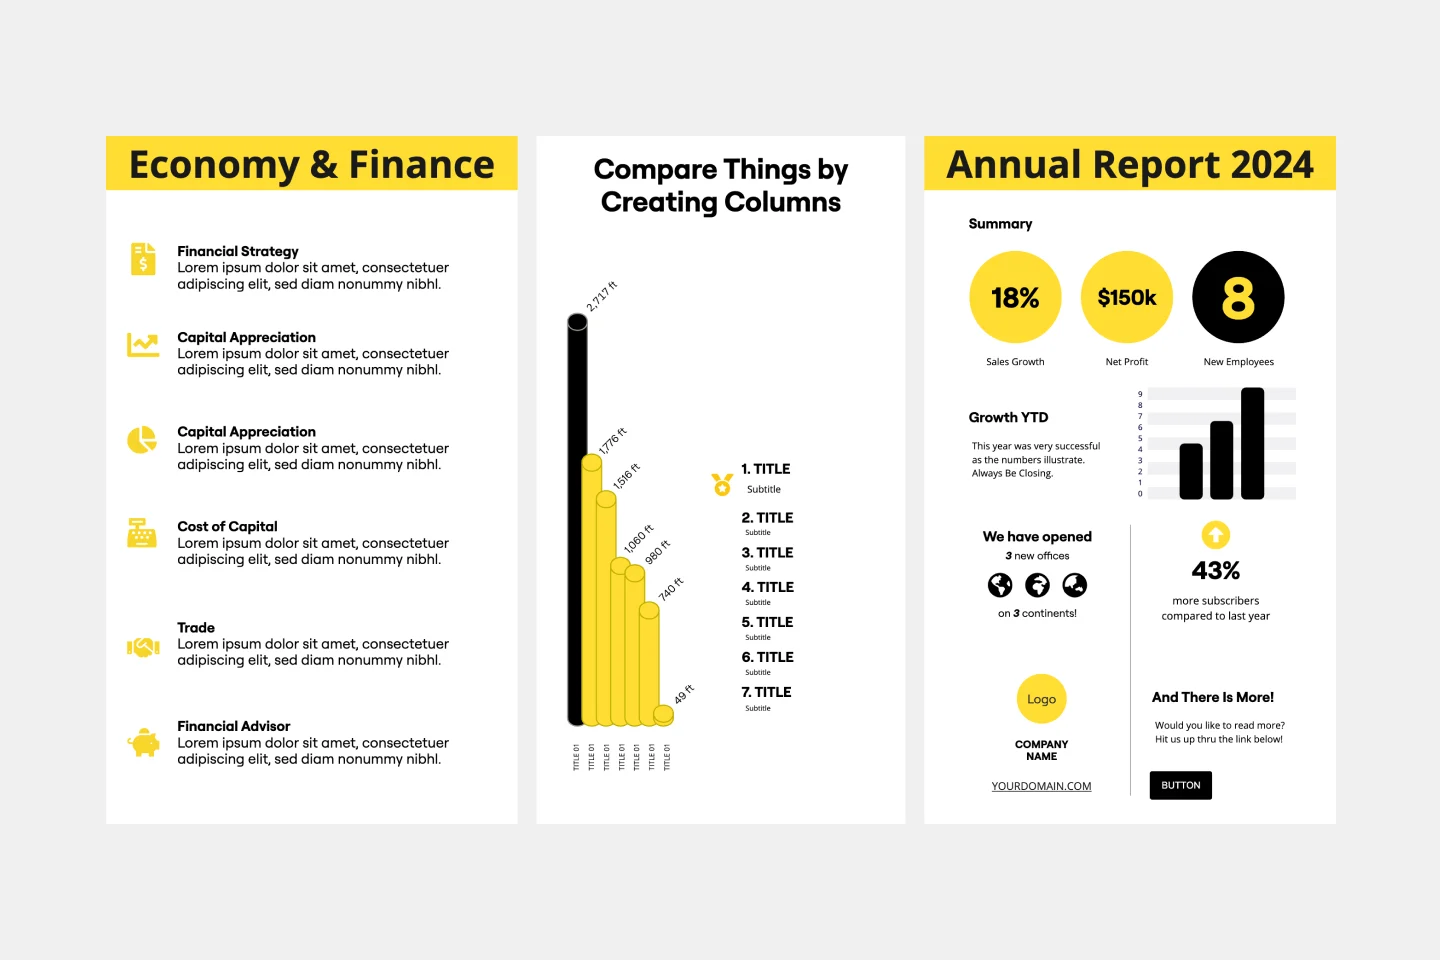
Infographic Template
Works best for:
Marketing, Desk Research, Documentation
As we bet you’ve experienced, data can get pretty dense and dry. But you need it to be compelling, memorable, and understandable. The solution? Infographics. These are tools that let you present information in a visually striking way and turn quantitative or qualitative data into stories that engage and resonate. Whoever you’ll be presenting to — customers, donors, or your own internal teams — our template will let you design an infographic that combines text and visuals to break down even the most complicated data.