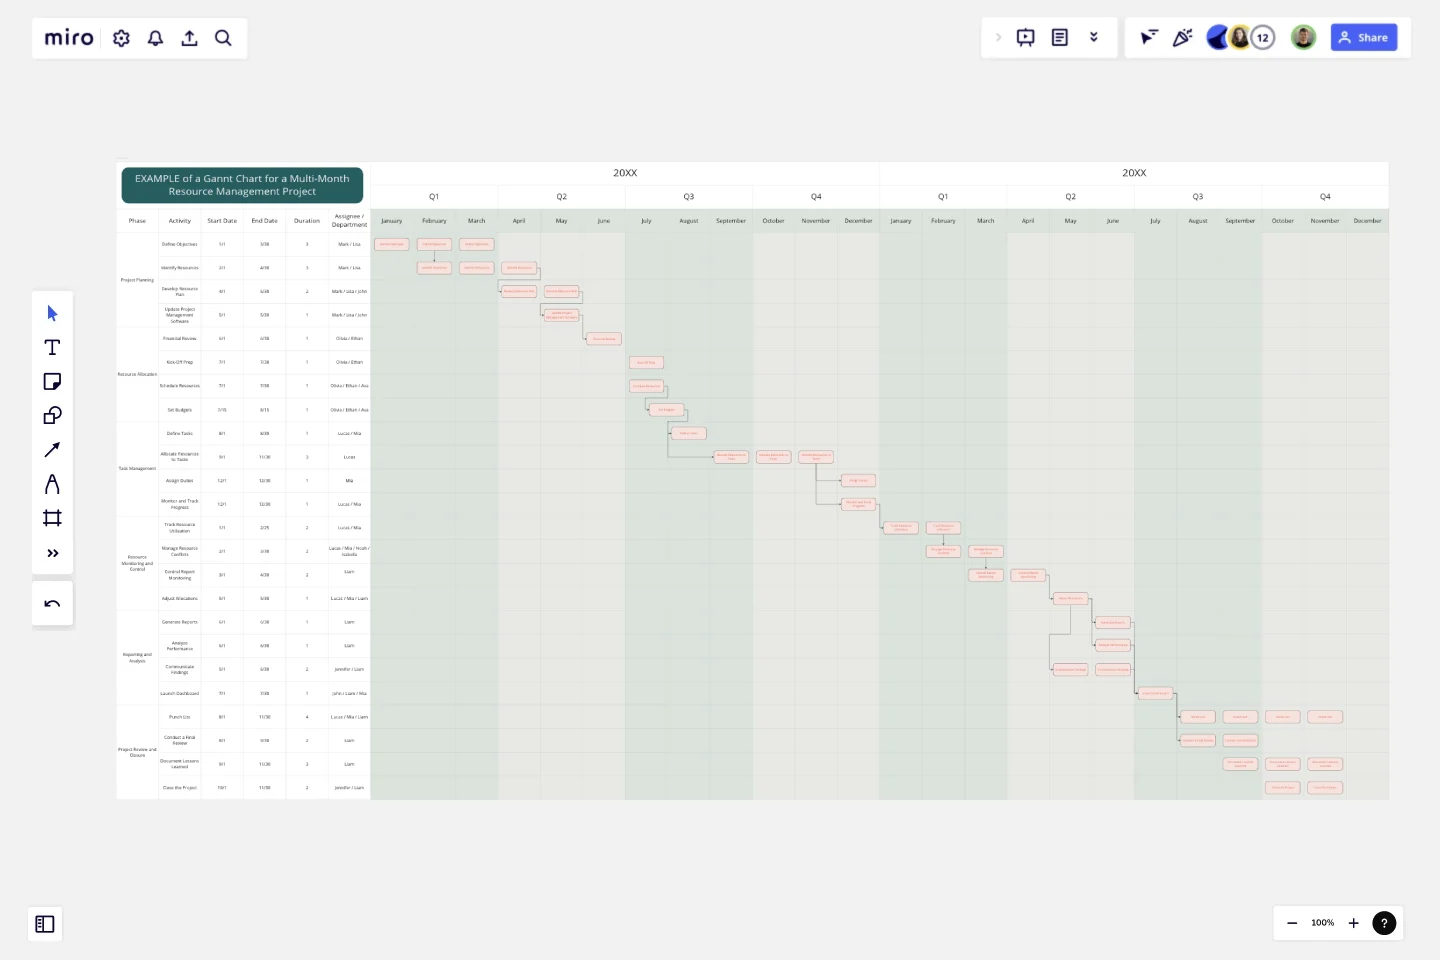
Resource Management Gantt Chart
The Resource Management Gantt Chart template is designed to help teams efficiently plan, allocate, and manage resources throughout a project.
It provides a visual timeline for tasks and resource usage, ensuring that resources are optimally utilized and potential conflicts are identified early.
Key Features
Project Phases: Includes clearly defined phases relevant to resource management, such as Planning, Resource Allocation, Task Management, Monitoring and Control, Reporting, and Project Closure.
Task Breakdown: Allows for a detailed listing of tasks or milestones within each phase. This ensures that all necessary activities are planned and tracked.
Timeline Visualization: Offers a visual representation of the project timeline, including start and end dates for each task. This helps in scheduling and understanding resource demands over time.
Resource Allocation: Provides columns to assign and track resources (such as team members, equipment, and materials) for each task, ensuring clear visibility of who or what is involved.
Dependency Tracking: Shows dependencies between tasks, indicating which tasks need to be completed before others can start. This helps in coordinating resources and scheduling effectively.
Progress Tracking: Includes sections for updating the status of each task and resource utilization, making it easier to monitor progress and make necessary adjustments.
Resource Utilization: Helps in managing and optimizing resource use by providing an overview of how and when resources are being allocated.
Conflict Identification: Assists in identifying and resolving resource conflicts or over-allocations by providing a clear view of resource assignments and schedules.
Why Use the Resource Management Gantt Chart Template?
Organized Resource Planning: Helps structure and organize resource planning, ensuring that all resources are accounted for and allocated appropriately throughout the project.
Visual Clarity: Provides a clear, visual timeline of the project and resource usage, making it easy to understand scheduling and resource demands.
Efficient Allocation: Facilitates effective allocation of resources by showing which resources are needed for which tasks and when, helping to prevent overallocation or shortages.
Improved Coordination: By showing task dependencies and resource assignments, it aids in coordinating efforts among team members and avoiding scheduling conflicts.
Enhanced Tracking: Allows for regular updates and tracking of both task progress and resource utilization, ensuring that the project stays on track and resource issues are addressed promptly.
Informed Decision-Making: Supports better decision-making by providing a structured and comprehensive view of resource management, helping to make adjustments as needed.
When to Use This Template:
For Complex Projects: When managing multiple resources and tasks, this template helps to ensure that resources are allocated efficiently and project timelines are adhered to.
When Coordinating Teams: To clearly assign and track responsibilities and resources, especially in projects involving multiple team members or departments.
For Resource Optimization: To manage and optimize resource use, avoiding conflicts and ensuring that resources are used effectively throughout the project.
The Resource Management Gantt Chart template is a valuable tool for managing project resources, providing clarity, structure, and efficiency in resource planning and utilization.
This template was created by Anthony.
Get started with this template right now.
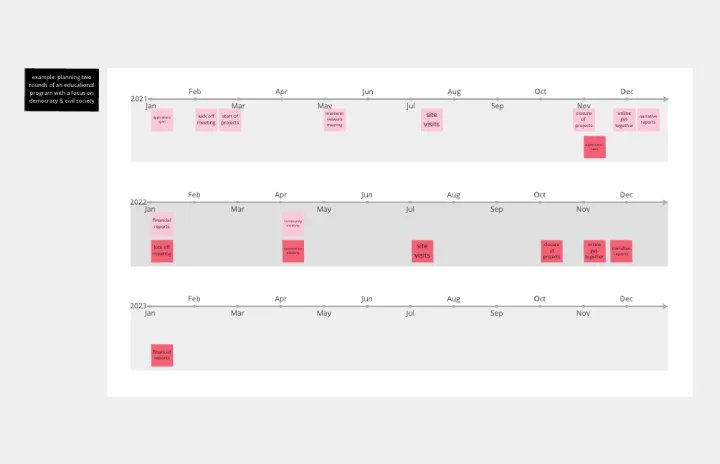
Year Timeline Template
Works best for:
Timeline, Planning
The Year Timeline template provides a comprehensive view of annual events and milestones. Perfect for planning yearly goals, tracking progress, and scheduling important dates, this template helps you stay organized and focused throughout the year.
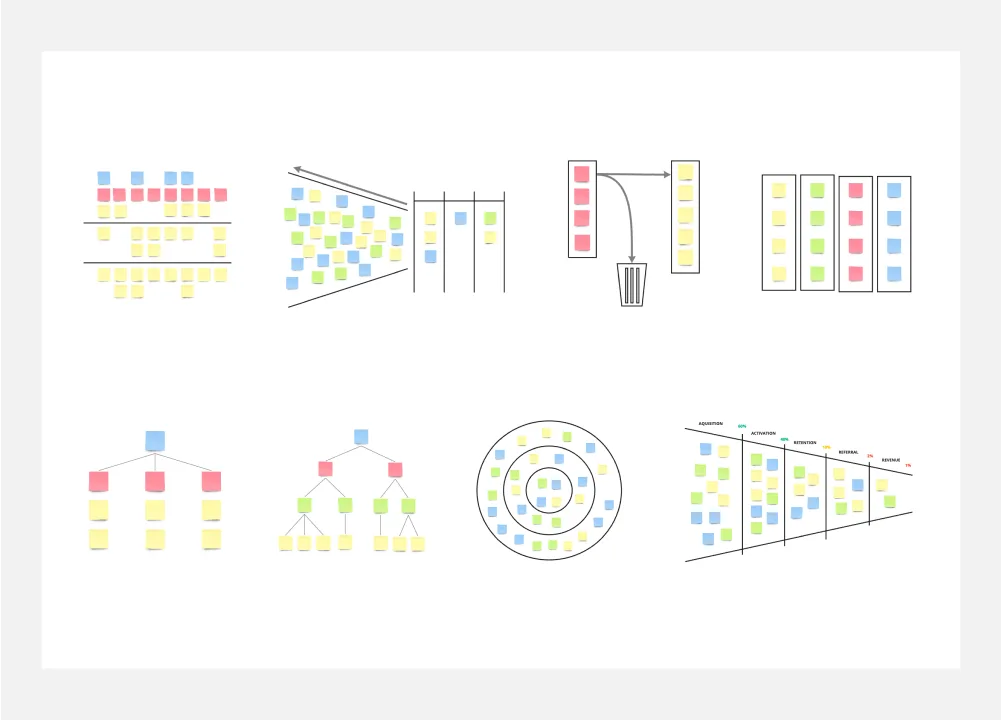
8 Different Ways to Organize Your Backlog
Works best for:
Agile
Explore 8 different techniques for managing and prioritizing work effectively with this template. From prioritization matrices to story mapping, it offers a comprehensive overview of backlog management strategies. By understanding the strengths and limitations of each approach, teams can tailor their backlog organization to optimize workflow, empowering teams to stay organized and focused on delivering value.
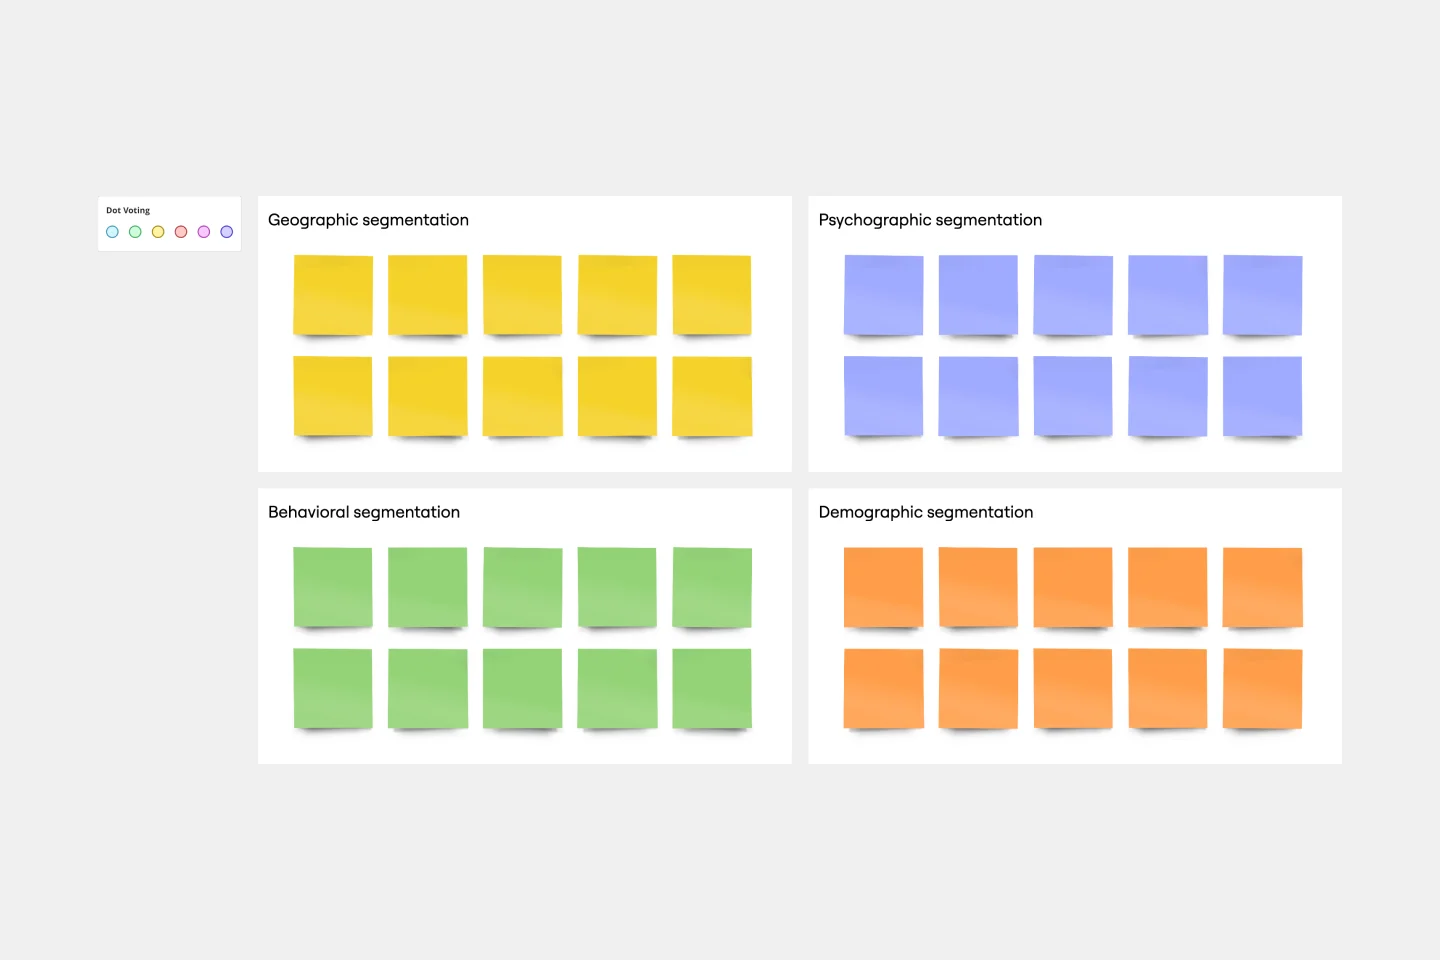
Market Segmentation Matrix Template
Works best for:
Marketing, Strategic Planning, Product Management
Successful, compelling marketing begins and ends with knowing your audience — who they are, where they are, and what they want and expect. A market segmentation matrix will help you understand them on a deeper level. This business tool divides your target market into subsets based on demographics, geography, needs, interests, psychographics, or behavioral characteristics. You can then use these insights and data to hit it out of the park, by building better product, sales, and marketing strategies. Our template lets you set up and populate a Market Segmentation Matrix with ease.
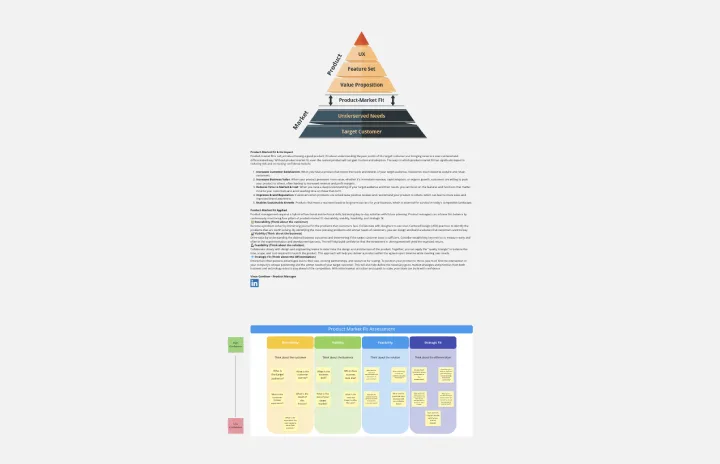
Product Market Fit Board
Works best for:
Product Management, Planning
The Product Market Fit Board template helps product teams assess and validate product-market fit. By capturing user feedback, analyzing market trends, and tracking key metrics, this template enables teams to evaluate product-market alignment objectively. With sections for defining target segments, identifying pain points, and prioritizing features, it guides teams through the process of optimizing product-market fit. This template serves as a tool for iteratively refining products to meet customer needs and drive market success.
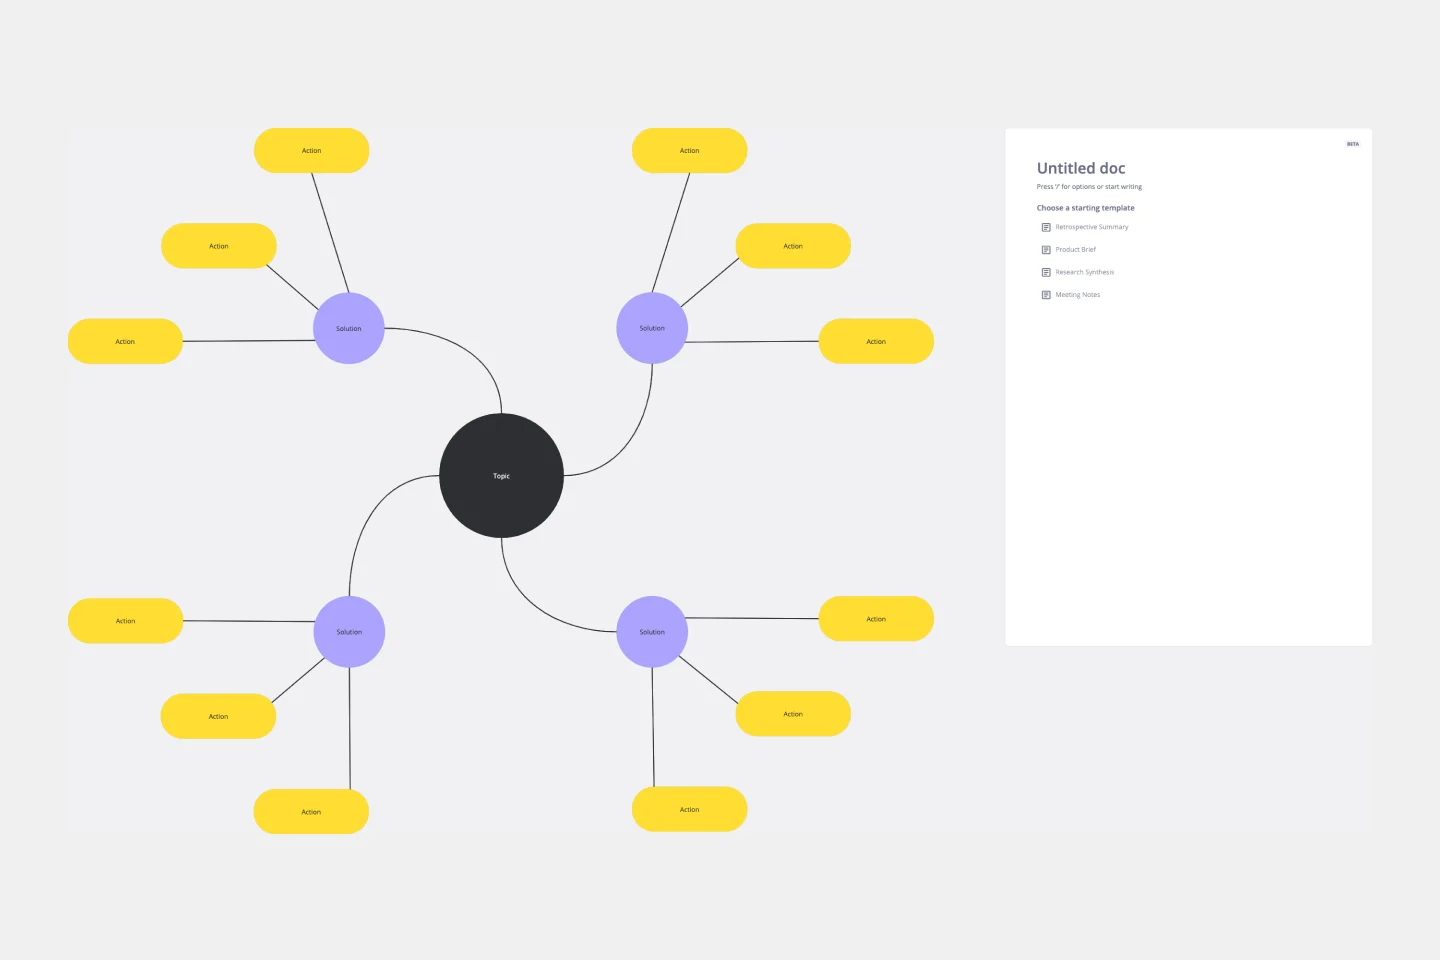
Spider Diagram Template
Works best for:
Diagramming, Mapping
Perfect for brainstorming sessions, project planning, or simply organizing thoughts, the Spider Diagram Template allows you to create 'legs' branching out from a central idea, representing related topics or subtopics.
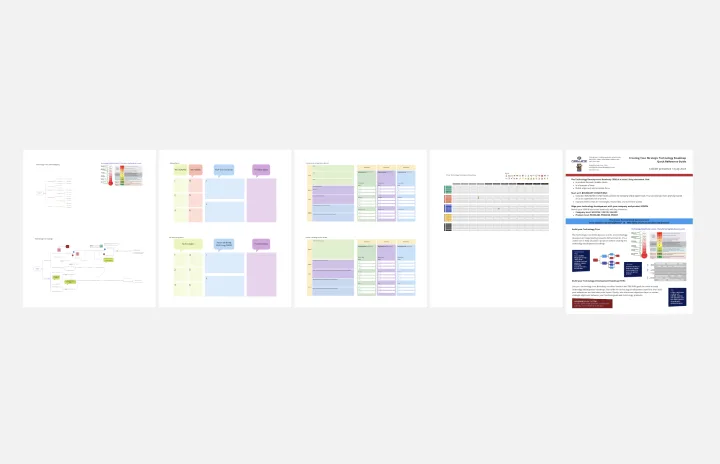
Strategic Technology Roadmap Worksheets
Works best for:
Roadmap, Planning, Mapping
We all know that technology commercialization success starts with the end in mind, a product with market viability.