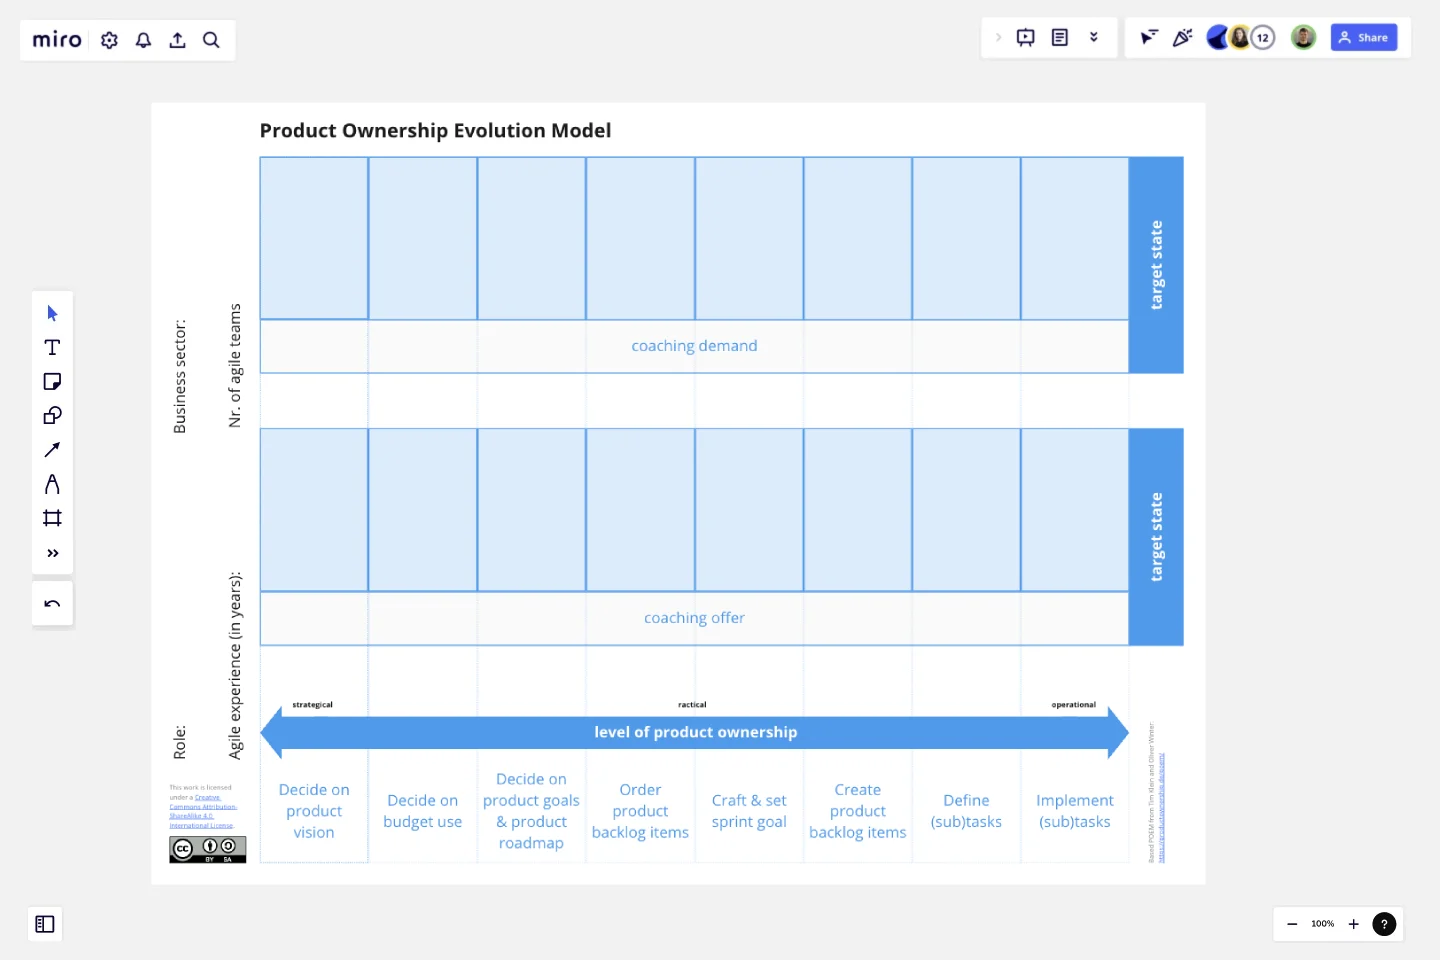
Product Ownership Evolution Model (POEM)
A model for the evolution of product ownership in an organization.
It helps to visualize and discuss the current and future design of product ownership and thus to jointly develop it further.
Building on these results, the model can be used to agree on (more) binding responsibilities for product ownership between the roles.
Finally, a possible coaching need of the acting persons/roles can be identified, which must be covered by Scrum Masters and/or Agile Coaches.
This template was created by Enrico Reinsdorf.
Get started with this template right now.
Agile Product Roadmap
Works best for:
Roadmap, Planning, Mapping
The Agile Product Roadmap template enables teams to visualize and communicate the strategic direction of their product development in an agile environment. It allows for flexibility and adaptation to changing requirements while providing a clear overview of priorities and timelines. By incorporating feedback loops and iterative planning, teams can ensure alignment with stakeholder expectations and deliver value incrementally.
Editorial Calendar Template
Works best for:
Marketing, Strategic Planning, Project Planning
If your company is like most, content is a big thing. You create more of it (and a lot faster) than you create almost anything else. It includes blogs, newsletters, social media posts, ads, and more—and it requires ideating, writing, editing, and publishing. That’s why every content team needs an editorial calendar. The template will let you easily create a calendar that empowers your team to plan strategically, keep things organized (by content type, writer, channel, and delivery date), and finalize/post all content on schedule.
Features Audit Template
Works best for:
Desk Research, Product Management, User Experience
Add new features or improve existing features—those are the two paths toward improving a product. But which should you take? A features audit will help you decide. This easy, powerful product management tool will give you a way to examine all of your features, then gather research and have detailed discussions about the ones that simply aren’t working. Then you can decide if you should increase those features’ visibility or the frequency with which it’s used—or if you should remove it altogether.
Monthly Budget Template
Works best for:
Project management, Planning
Miro's Monthly Budget Template is more than a budgeting tool; it's a step towards more strategic and efficient financial planning. Start today, and take control of your financial future, achieving your projects and goals.
English Grammar Timeline Builder
The English Grammar Timeline template helps you map out the progression of grammar concepts over time. This is a great tool for educators and students to visualize the sequence and relationship between different grammar topics, making learning and teaching more effective.
Product Roadmap by Sahithi Alluru
Works best for:
Product Management, Roadmap
Visualize your product strategy with the Product Roadmap by Sahithi Alluru. This template helps you outline key milestones, set priorities, and track progress. Use it to align your team, communicate your plan effectively, and keep stakeholders informed. Ideal for product managers and teams looking to maintain clarity and direction throughout the product lifecycle. Streamline your planning and execution with this comprehensive roadmap.
