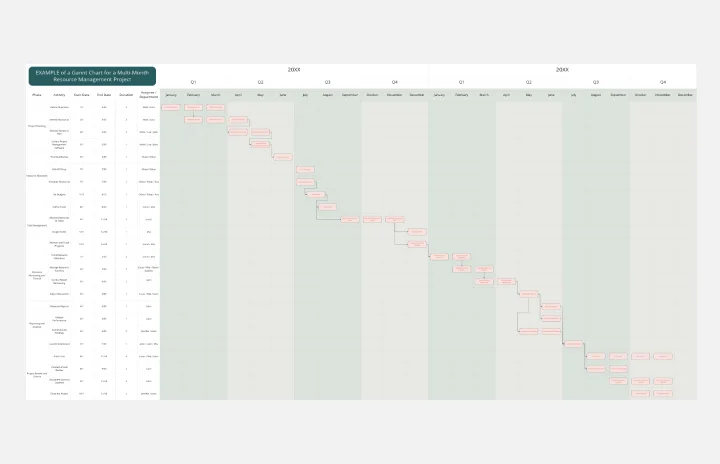
Product Development Gantt Chart
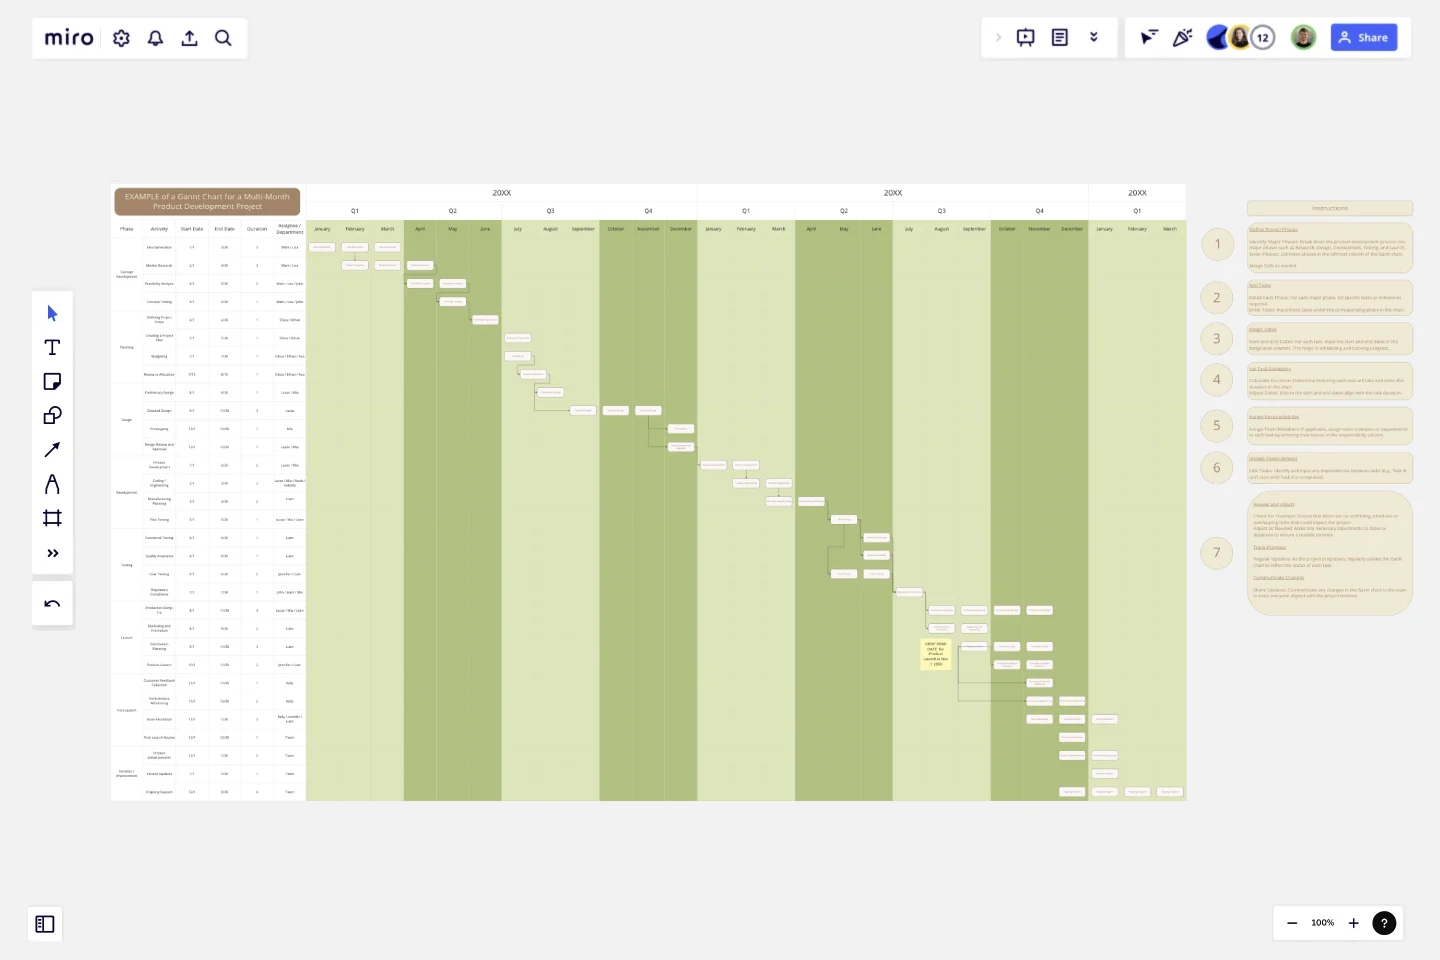
The Product Development Gantt Chart template is designed to help teams plan, track, and manage the entire product development lifecycle from concept to launch.
It provides a visual timeline of tasks and milestones, ensuring that all phases of the project are organized and managed effectively.
Key Features
Project Phases and Project Activities
Timeline Visualization: Provides a visual representation of the project timeline. This helps in understanding the overall schedule and identifying potential overlaps or delays.
Dependencies: Shows dependencies between tasks, so you can see which tasks need to be completed before others can start, facilitating better coordination and resource allocation.
Responsibility Assignment: Allows assignment of team members or departments to specific tasks, ensuring accountability and clear ownership of responsibilities.
Progress Tracking: Includes sections for updating the status of each task, making it easier to track progress and make adjustments as needed.
Resource Allocation: Helps in planning and allocating resources effectively by providing a clear overview of task requirements and deadlines.
Why Use the Product Development Gantt Chart Template?
Comprehensive Planning: Helps ensure that all aspects of product development are covered and planned in detail, reducing the risk of missing critical tasks or phases.
Visual Clarity: Provides a clear, visual timeline of the project, making it easier to understand the schedule and identify potential issues.
Improved Coordination: By showing dependencies and task assignments, it helps in coordinating efforts among team members and departments, minimizing conflicts and delays.
Enhanced Tracking: Allows for regular updates and tracking of progress, ensuring that the project stays on track and any deviations are promptly addressed.
Effective Resource Management: Helps in planning and managing resources more effectively, preventing overallocation or underutilization.
Informed Decision-Making: Provides a structured approach to project management, supporting better decision-making and strategic planning.
When to Use This Template
When Starting a New Product Development Project: To ensure all phases and tasks are planned and scheduled from the outset.
For Complex Projects with Multiple Phases: To manage and track various stages of development and their interdependencies.
When Coordinating a Team: To clearly assign responsibilities and track progress across different team members or departments.
This template is especially useful for teams needing a structured and visual approach to manage product development efficiently and effectively.
This template was created by Anthony.
Get started with this template right now.
Sprint Planning Template
Works best for:
Agile, Sprint Planning
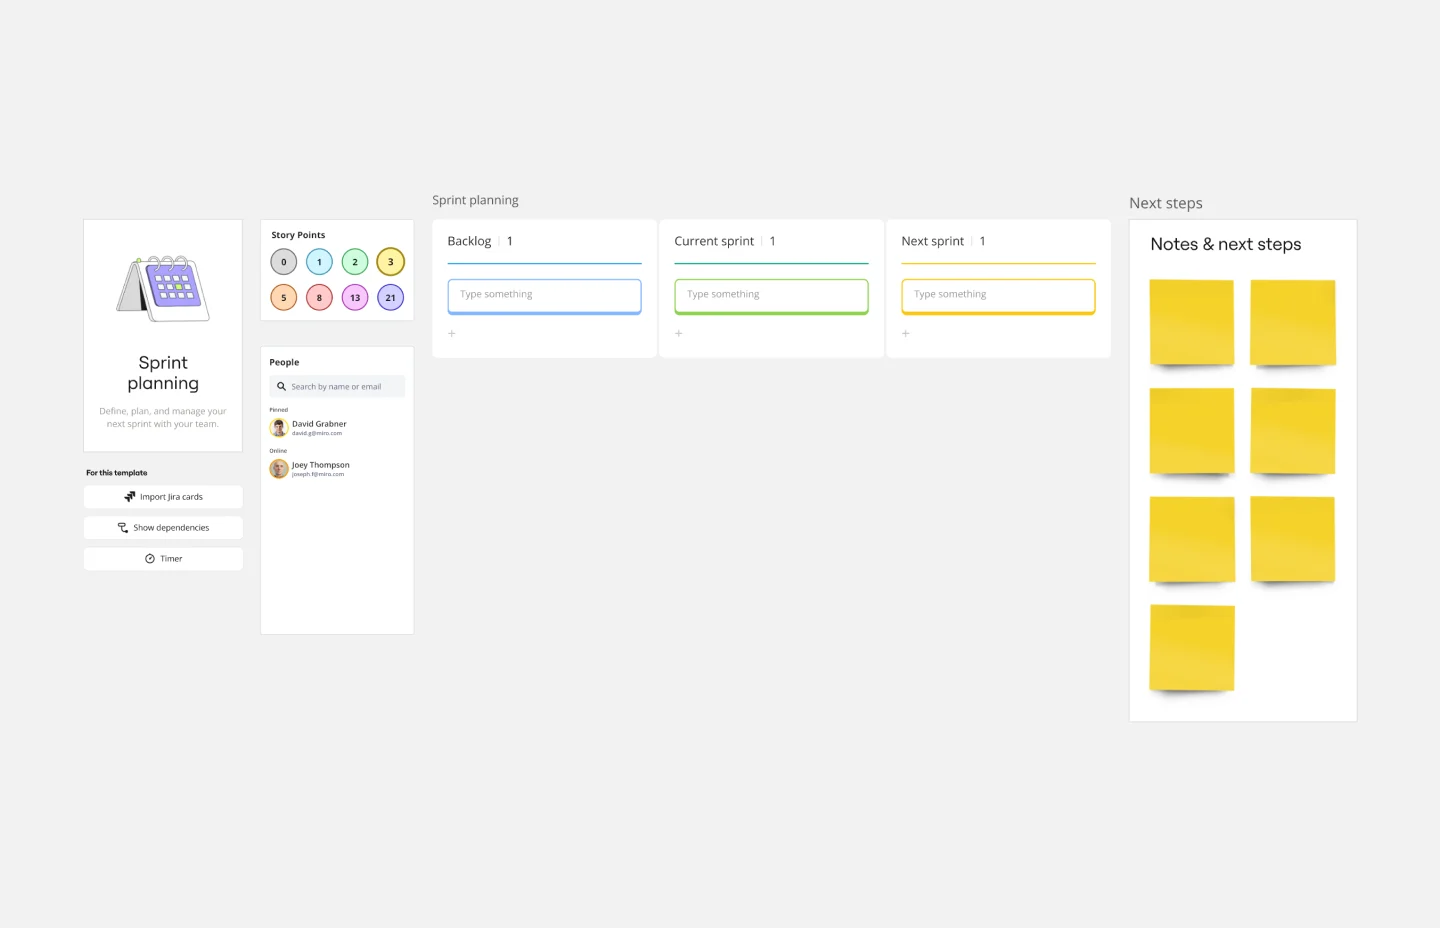
The Sprint Planning Template is a useful tool for agile teams to organize and conduct sprint planning sessions. It enhances team collaboration and communication by providing a clear visual layout of sprint goals, tasks, and timelines. The interactive design ensures team alignment toward sprint objectives, leading to effective teamwork. The template is a central hub for planning, discussion, and decision-making, creating a collaborative and productive environment.
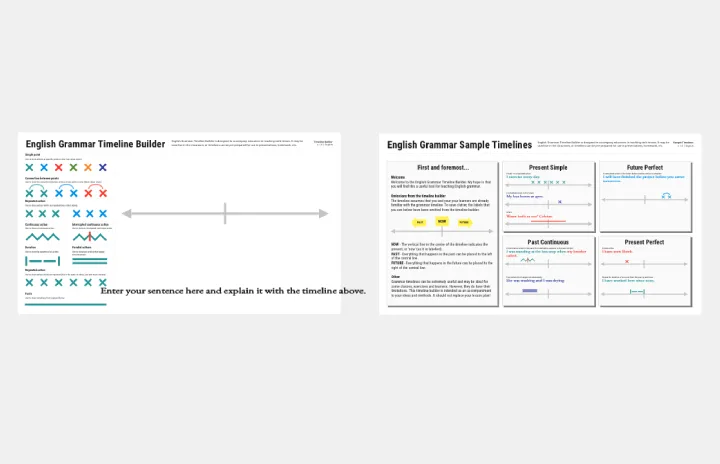
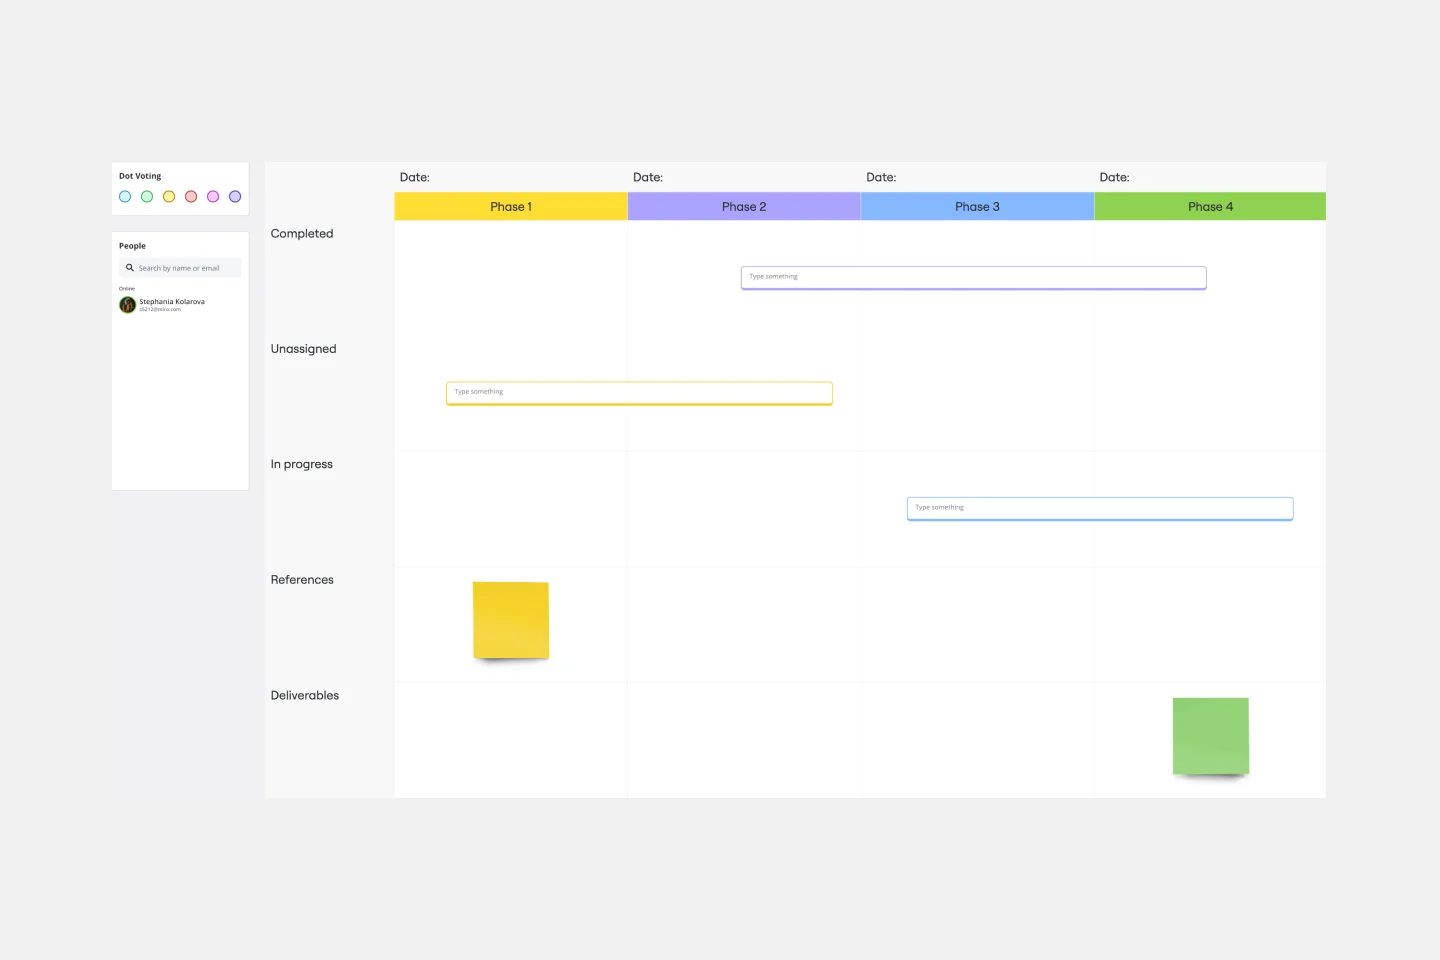
English Grammar Timeline Builder
The English Grammar Timeline template helps you map out the progression of grammar concepts over time. This is a great tool for educators and students to visualize the sequence and relationship between different grammar topics, making learning and teaching more effective.
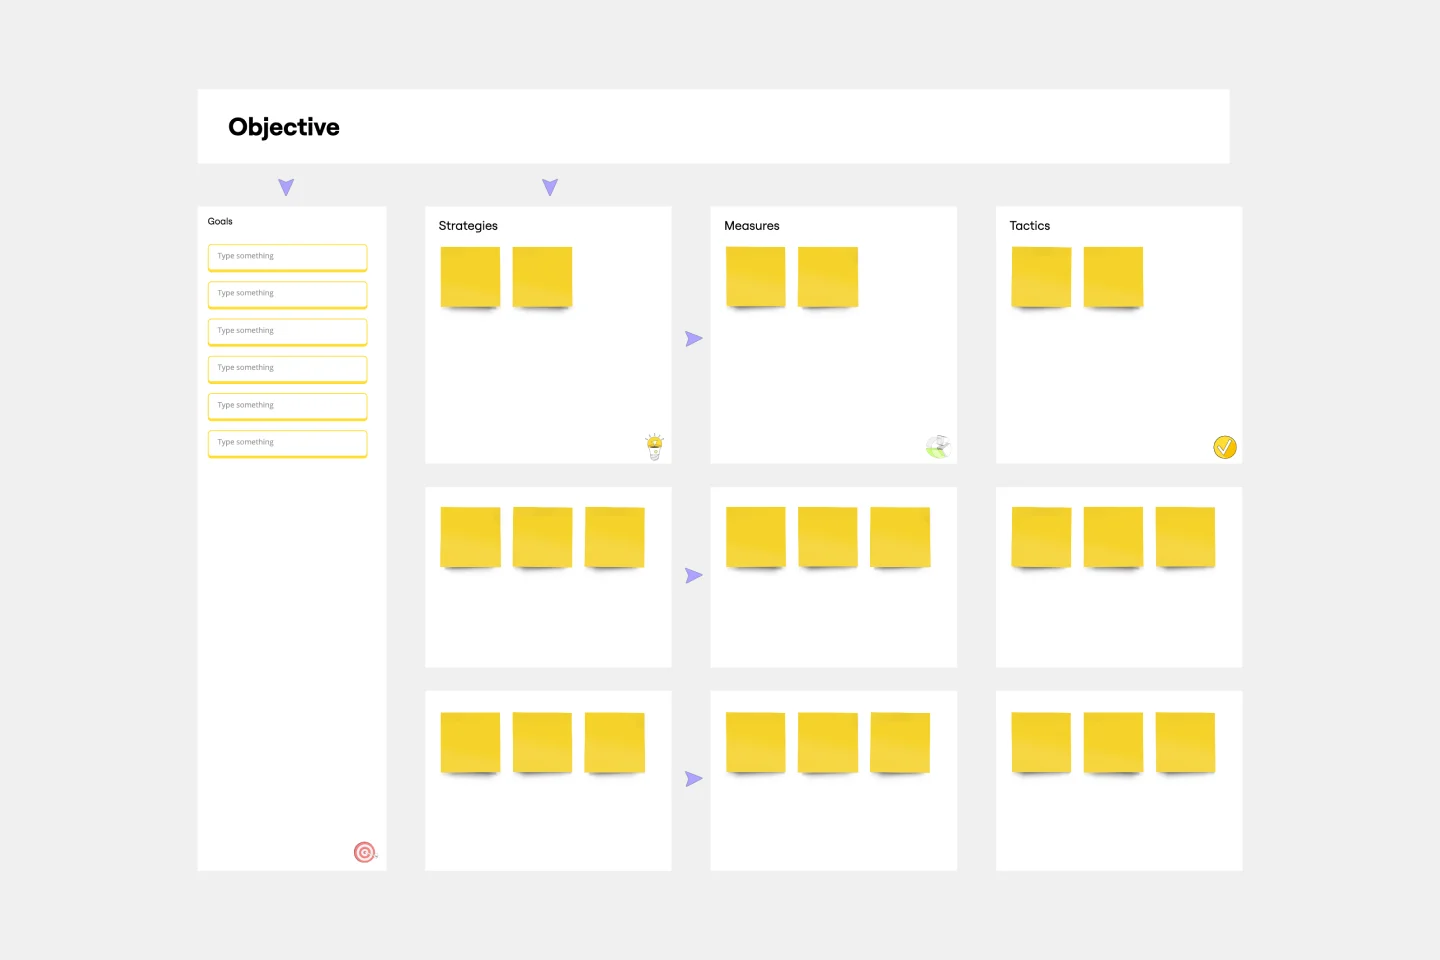
OGSM Template
Works best for:
Strategy, Planning
The OGSM template provides a readable framework, systematically breaking down business strategies into Objectives, Goals, Strategies, and Measures. This structured approach ensures that overarching visions are translated into actionable plans, fostering alignment across different teams and initiatives. One standout benefit of using this template is its ability to offer clarity. By clearly delineating between broad objectives and specific measures, stakeholders can easily comprehend and stay focused on the most critical elements of a strategy, ensuring that all efforts are directed toward the desired outcomes.
Timeline Workflow
Works best for:
Project Management, Flowcharts, Operations
A timeline is a visual tool that chronologically plots out projects step by step. It’s an ideal tool for your team to tell stories (such as an overview of events in your organization) and visualize your projects or processes. The Timeline Workflow template is perfect for any project that relies on visual content. You may find it beneficial to use with your team and also to share with other stakeholders or clients to keep them in the loop on your progress.
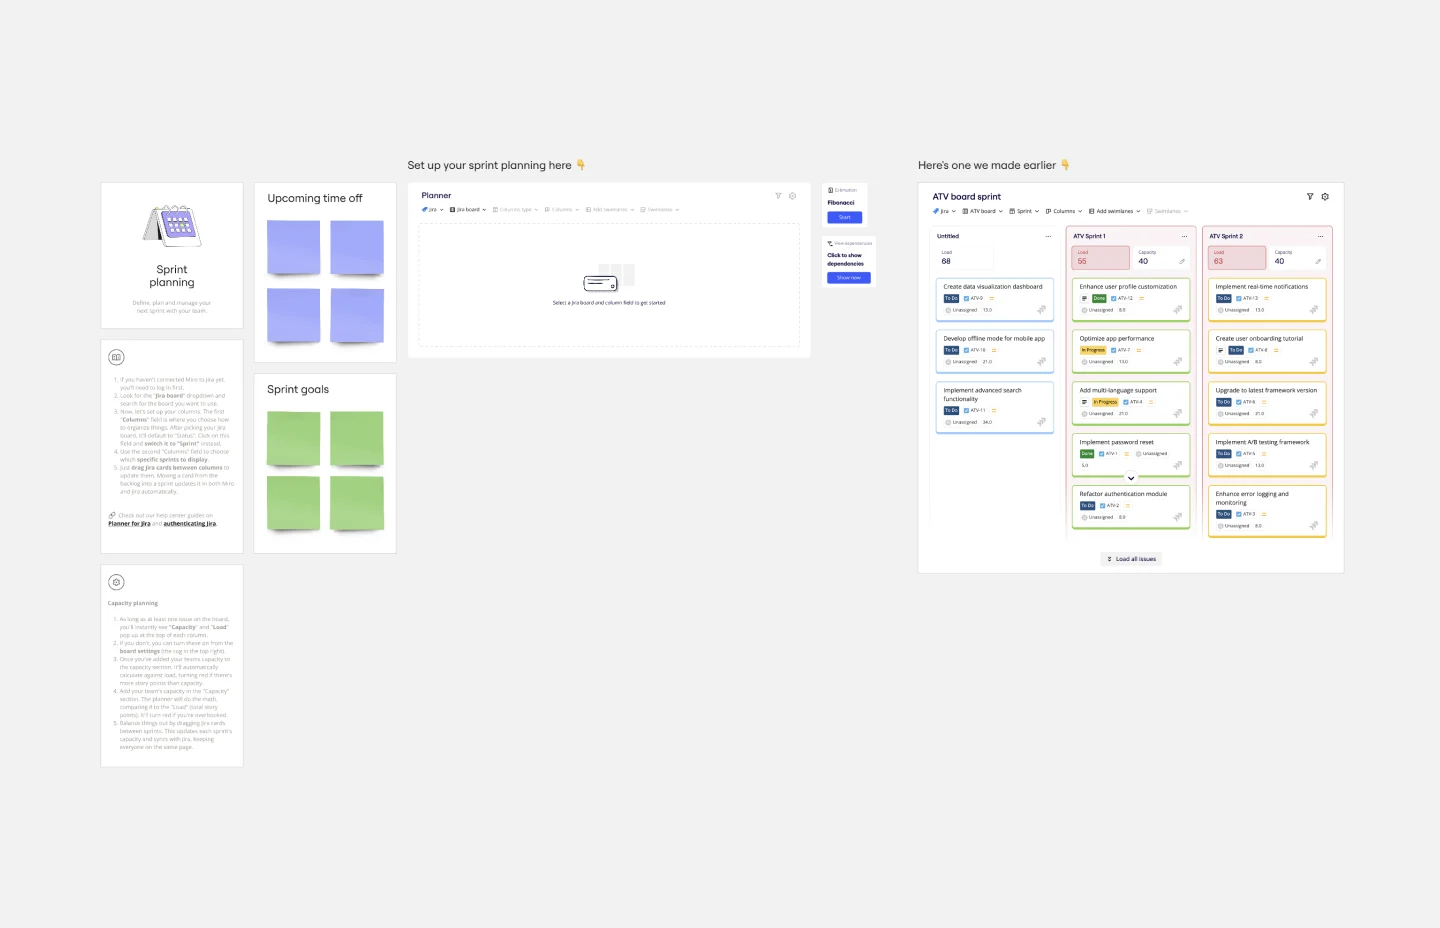
Sprint Planning with Jira Template
Works best for:
Sprint Planning, Agile
The Sprint Planning with Jira template in Miro is a powerful tool designed to streamline and enhance your sprint planning sessions. One of the key benefits of this template is its Jira integration, which saves time and effort when planning and aligning teams. By integrating directly with Jira, the template allows for seamless import and management of tasks, ensuring that all your Jira tickets are up-to-date and easily accessible within Miro. This reduces the need for manual updates and minimizes errors, making the planning process more efficient and effective.
Resource Management Gantt Chart
Works best for:
Strategy, Planning
Efficient resource allocation is crucial for project success. The Resource Management Gantt Chart template helps you plan and manage your resources effectively. Use it to track the availability and allocation of personnel, equipment, and materials throughout your project. This template ensures resources are optimally utilized, reducing waste and avoiding delays, providing a clear overview of assignments and workload balance.