Problem Tree Template
Use the Problem Tree Template to promote holistic insights, enabling users to strategize more informed and impactful solutions. This method ensures that efforts are addressing symptoms and targeting the heart of the problem.
About the Problem Tree Template
Dive into the complexities of any issue with the Problem Tree Template. This valuable resource provides a structured approach to problem-solving, helping users identify a problem's root causes and understand its ripple effects. Suitable for challenges in business, community, or personal initiatives, the template offers clarity and a broad perspective on complex issues.
What's a Problem Tree Template?
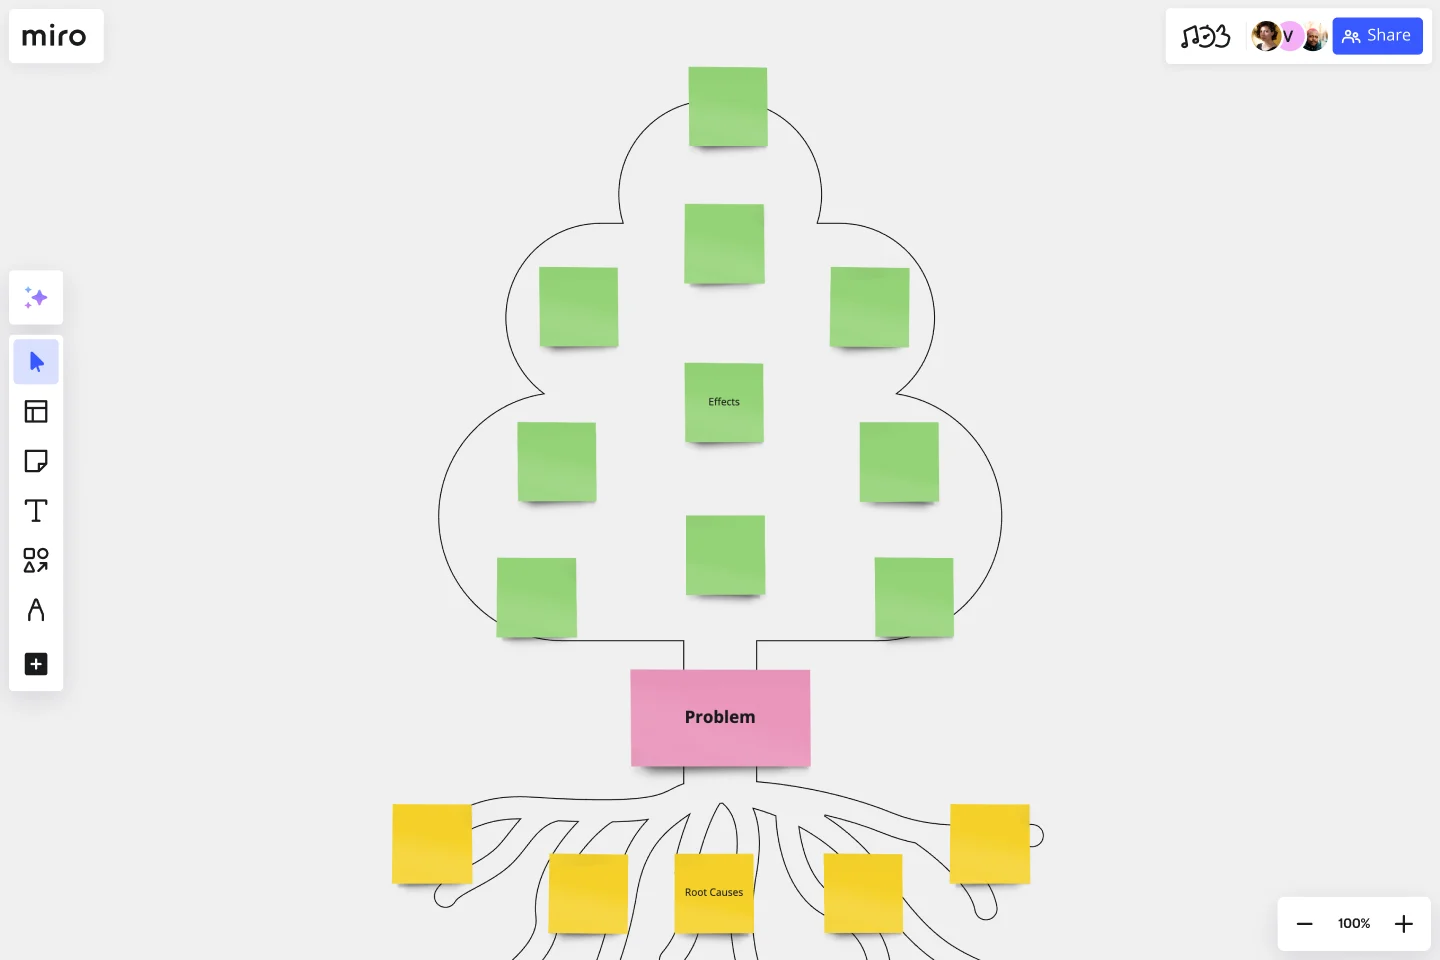
A Problem Tree Template is a structured visual tool designed to break down a central problem into its main effects and the underlying causes. Envision a tree:
The trunk represents the core problem.
The branches depict its direct effects.
The roots symbolize the deep-seated reasons behind it.
By mapping out the issue in such a detailed way, people and teams can gain a comprehensive view of their challenges. One significant benefit of using this template is that it fosters a holistic understanding of the problem, enabling more strategic and effective solutions. This method helps pinpoint where interventions might be most effective and encourages a more collaborative and inclusive approach to problem-solving.
How to use a Problem Tree Template in Miro
Using the Problem Tree Template in Miro is an interactive experience that brings your problem-solving sessions to life. With the help of sticky notes, emojis, and stickers, you can dynamically populate your tree diagram. Here's how you can do it in four steps:
Identify the central problem: Start by placing a sticky note in the center of your board detailing the main problem you want to tackle. This serves as the trunk of your problem tree.
Map out the effects: Above the central problem, use sticky notes to detail the direct effects or consequences of the problem. Think of these as the branches of your tree. Feel free to use emojis or stickers to add emphasis or to categorize.
Unearth the root causes: Below the central problem, dive deep to uncover the underlying causes of the problem. Use sticky notes for each identified cause, and think of them as the roots of your tree. Emojis and stickers can once again be used to visualize the intensity or type of each cause.
Connect and organize: Finally, draw lines or connectors between related effects and causes, helping to visualize the relationships and flow between different parts of your problem tree.
Learn more about Miro's tree diagram maker and find out other solutions for your decision-making process.
Can I customize the Problem Tree Template?
Yes, Miro allows you to customize any template. Feel free to add more sections and colors or even integrate other templates as needed to tailor the template to your specific needs.
Is this template suitable for group workshops?
Yes, the Problem Tree Template is ideal for group sessions. Multiple users can collaborate in real time, adding their insights and helping to map out a comprehensive view of the problem.
What if my problem has more than one main effect or root cause?
The beauty of the template is its flexibility. You can add as many effects and root causes as necessary to accurately represent your problem. Miro's visual workspace can be expanded indefinitely, so space won't be an issue.
Can I share my completed problem tree with others?
Of course! Miro allows you to easily share your boards with team members, stakeholders, or anyone else. They can then view or collaborate on your problem tree, depending on the permissions you grant.
Get started with this template right now.
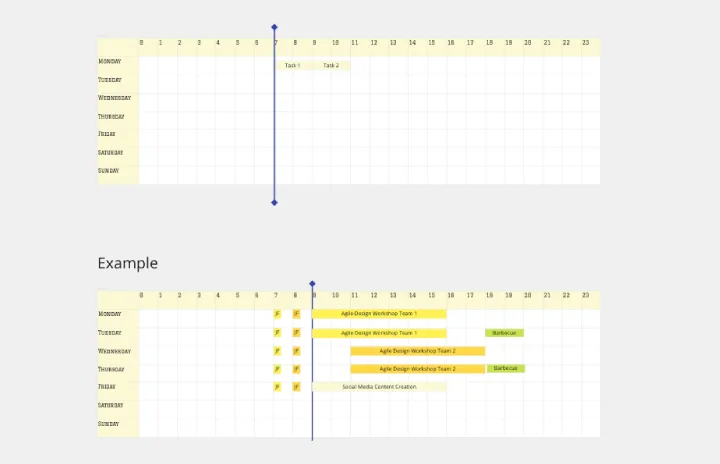
Weekly Planner by Elina Schäfer
Weekly Planner template is perfect for organizing your weekly tasks and schedules. It helps you prioritize activities, set deadlines, and manage your time effectively, ensuring you stay productive and on track throughout the week.
Wardley Mapping Canvas Template
Works best for:
Leadership, Strategic Planning, Mapping
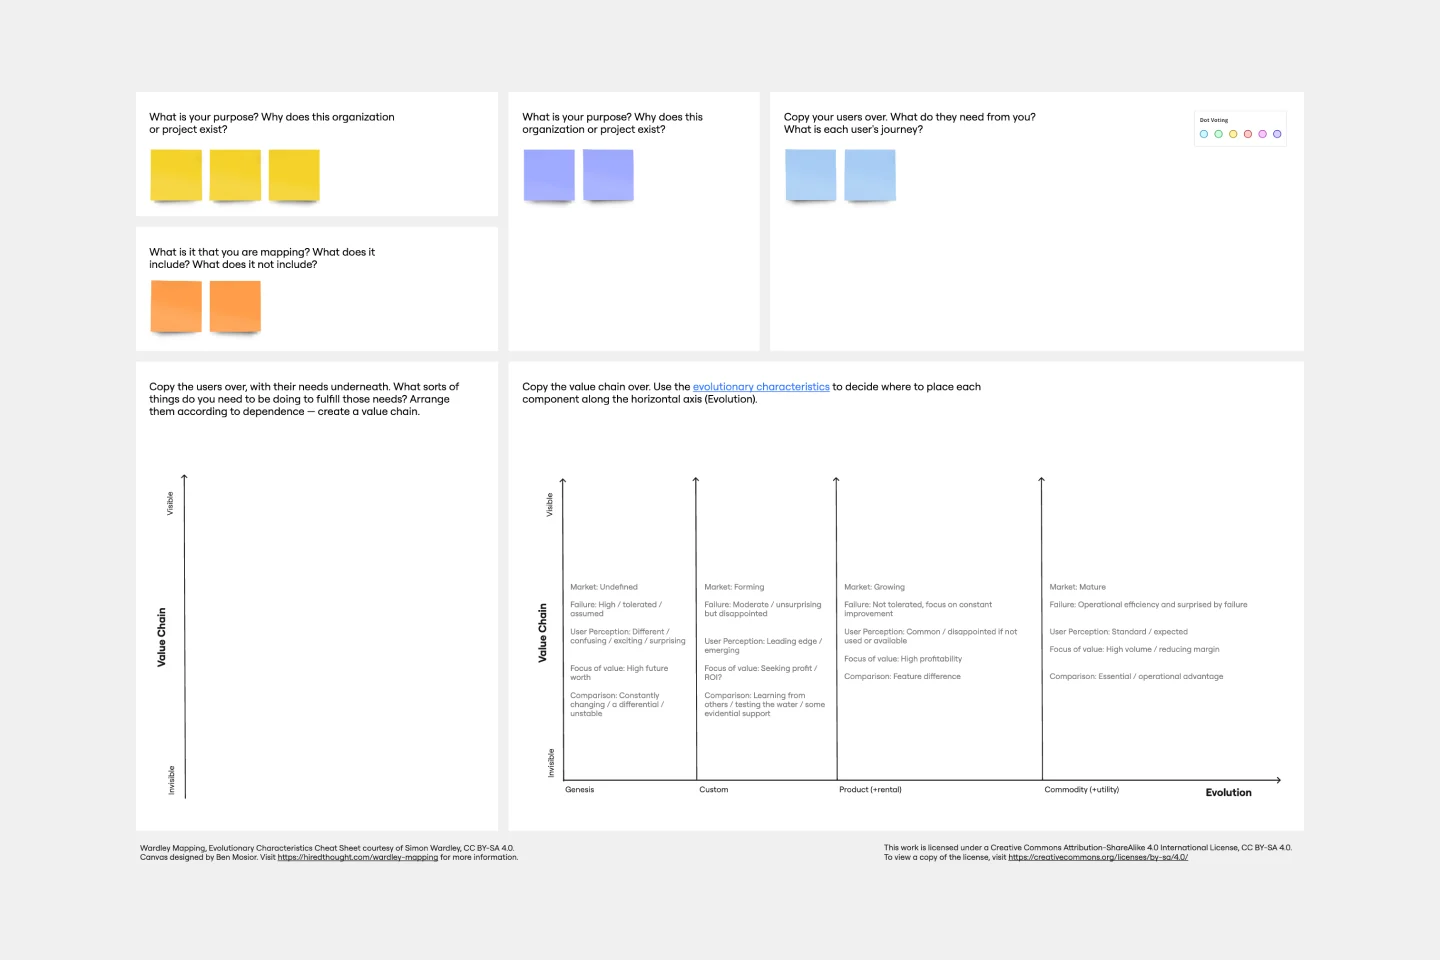
A Wardley Map represents the landscape in which a business operates. It's made up of a value chain (the activities required to fulfill user needs) graphed against the evolution of individual activities over time. You place components with value on the y-axis and commodity on the x-axis. Use a Wardley Map to understand shared assumptions about your environment and discover what strategic options are available. Easily communicate your understanding of the landscape to your team, new hires, and stakeholders.
Value Proposition Template
Works best for:
Strategy & Planning, Product Strategy
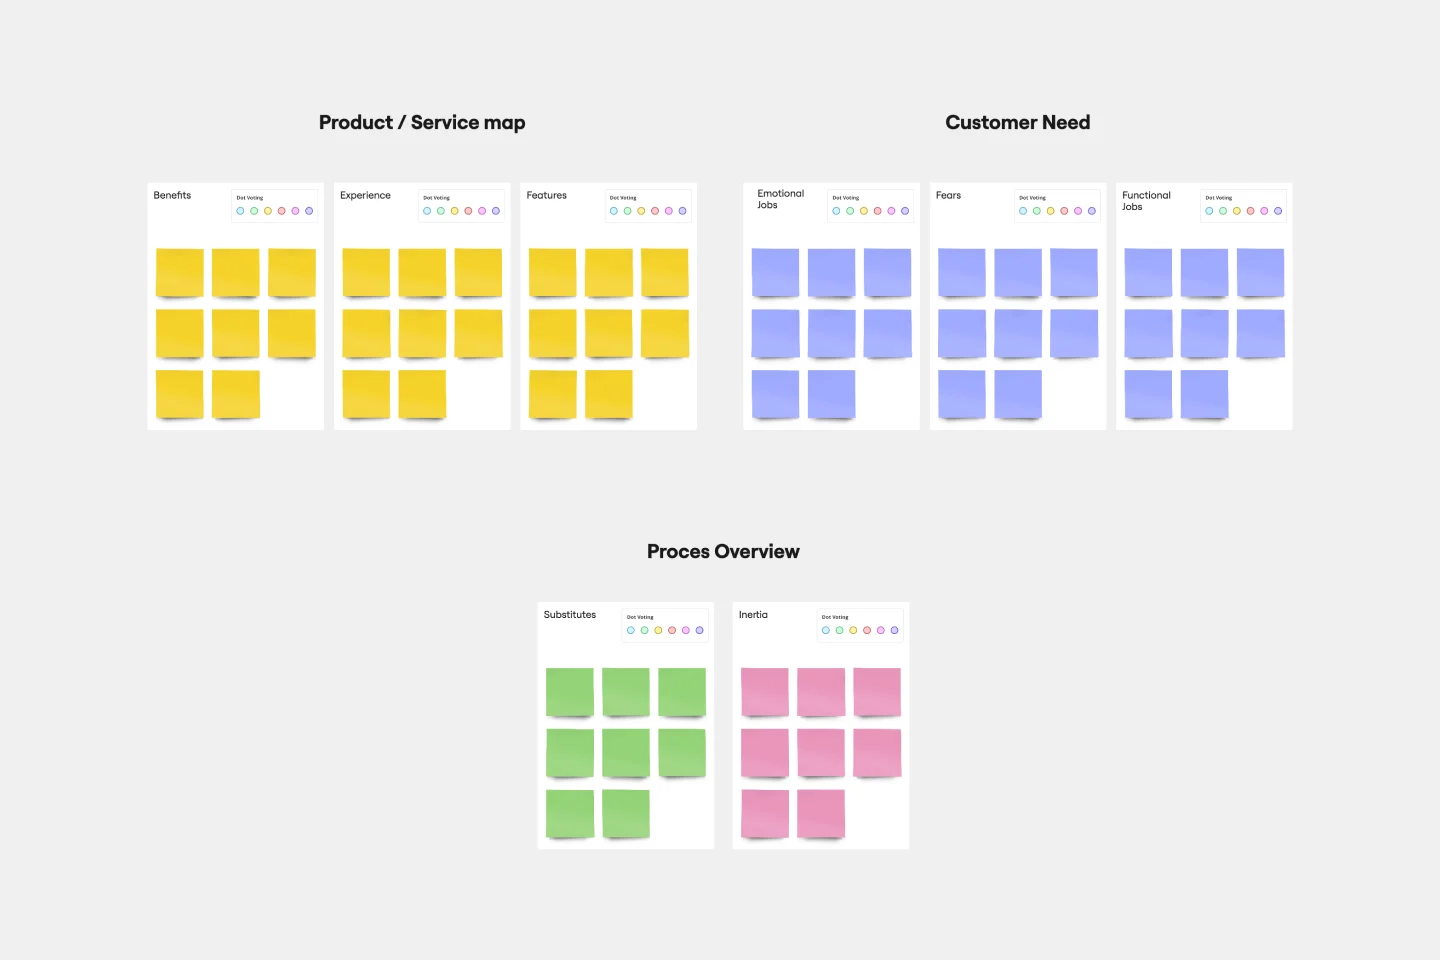
The Value Proposition Template is a framework that empowers businesses to articulate their offerings' core advantages. By breaking down an offering into its essential elements, this template ensures that stakeholders grasp the unique value a product or service brings to the market.
OGSM Template
Works best for:
Strategy, Planning
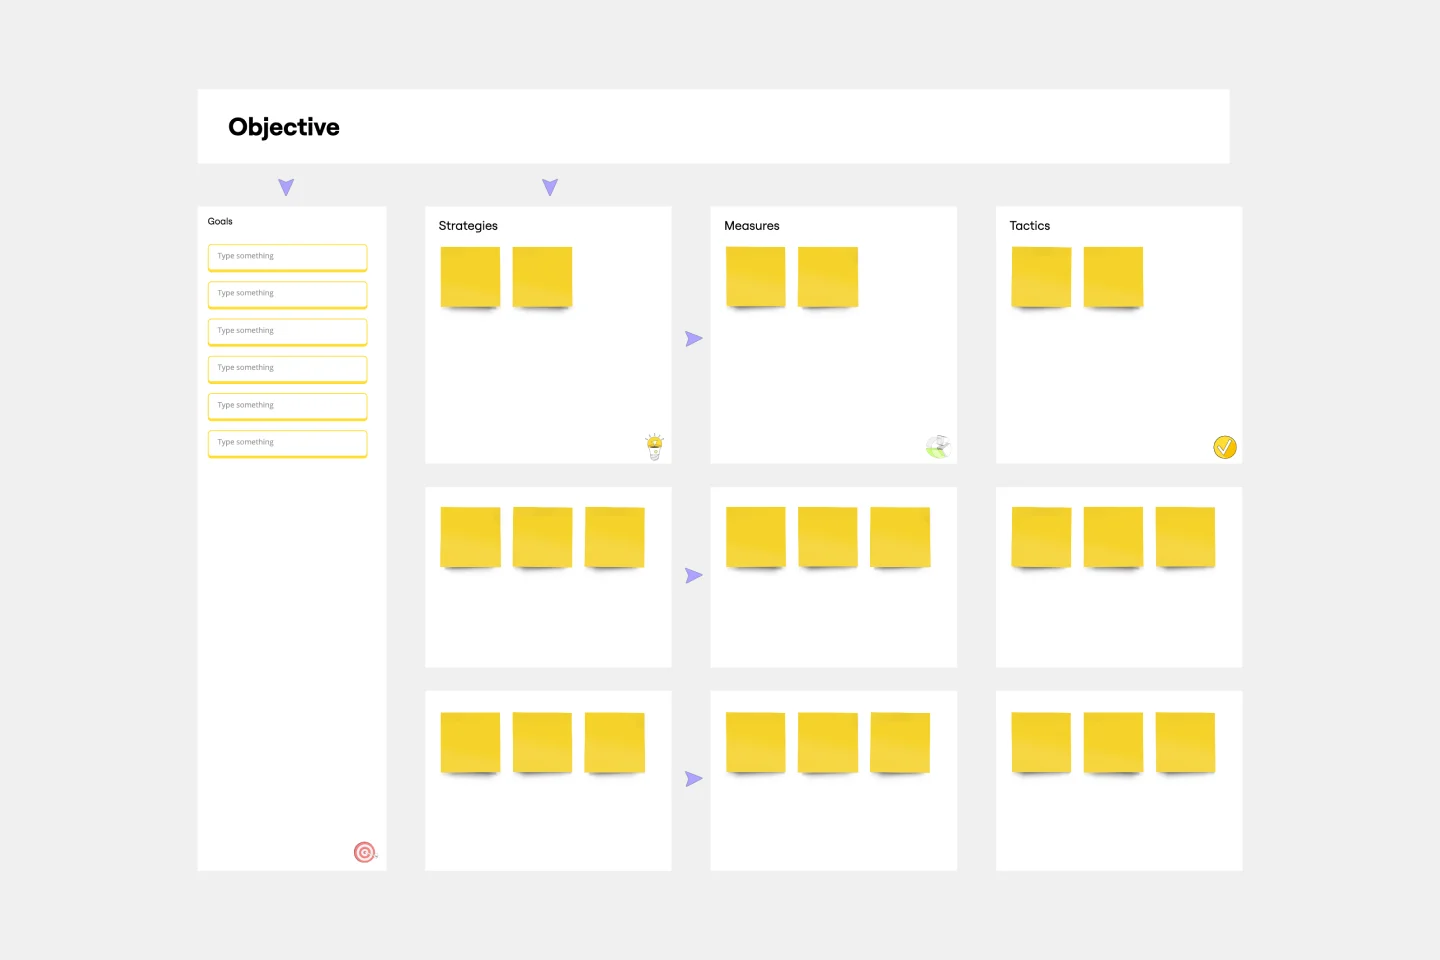
The OGSM template provides a readable framework, systematically breaking down business strategies into Objectives, Goals, Strategies, and Measures. This structured approach ensures that overarching visions are translated into actionable plans, fostering alignment across different teams and initiatives. One standout benefit of using this template is its ability to offer clarity. By clearly delineating between broad objectives and specific measures, stakeholders can easily comprehend and stay focused on the most critical elements of a strategy, ensuring that all efforts are directed toward the desired outcomes.
Porter's Five Forces Template
Works best for:
Leadership, Strategic Planning, Market Research
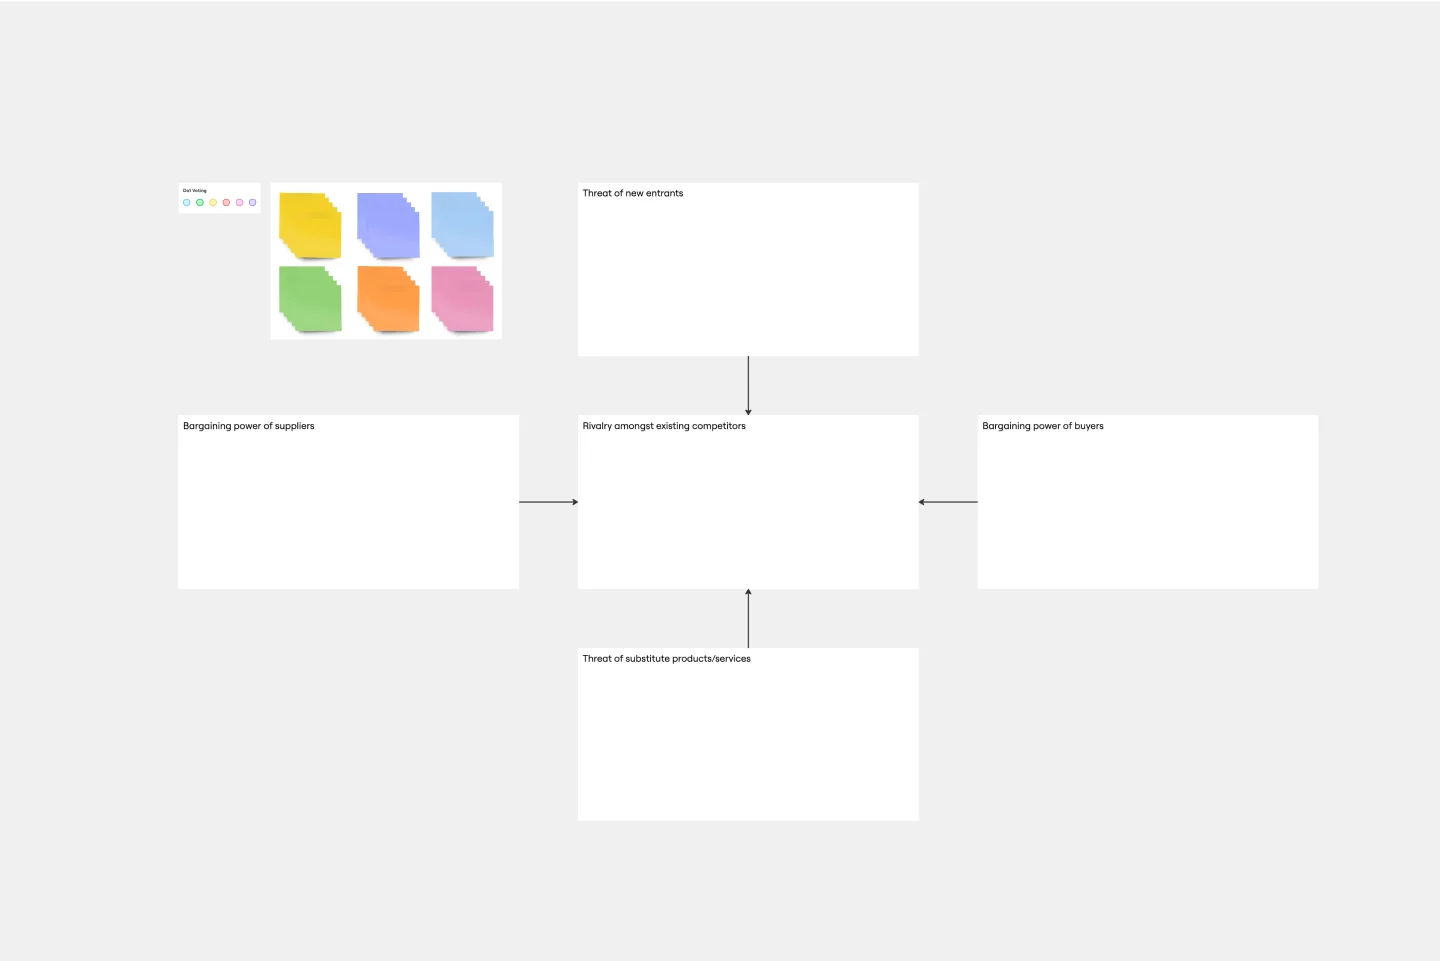
Developed by Harvard Business School professor Michael Porter, Porter’s Five Forces has become one of the most popular and highly regarded business strategy tools available for teams. Use Porter’s Five Forces to measure the strength of your current competition and decide which markets you might be able to move into. Porter’s Five Forces include: supplier power, buyer power, rivalry among existing competitors, the threat of substitute products or services, the threat of substitute products and services, and the threat of new entrants.
App Development Canvas Template
Works best for:
Market Research, Product Management, User Experience
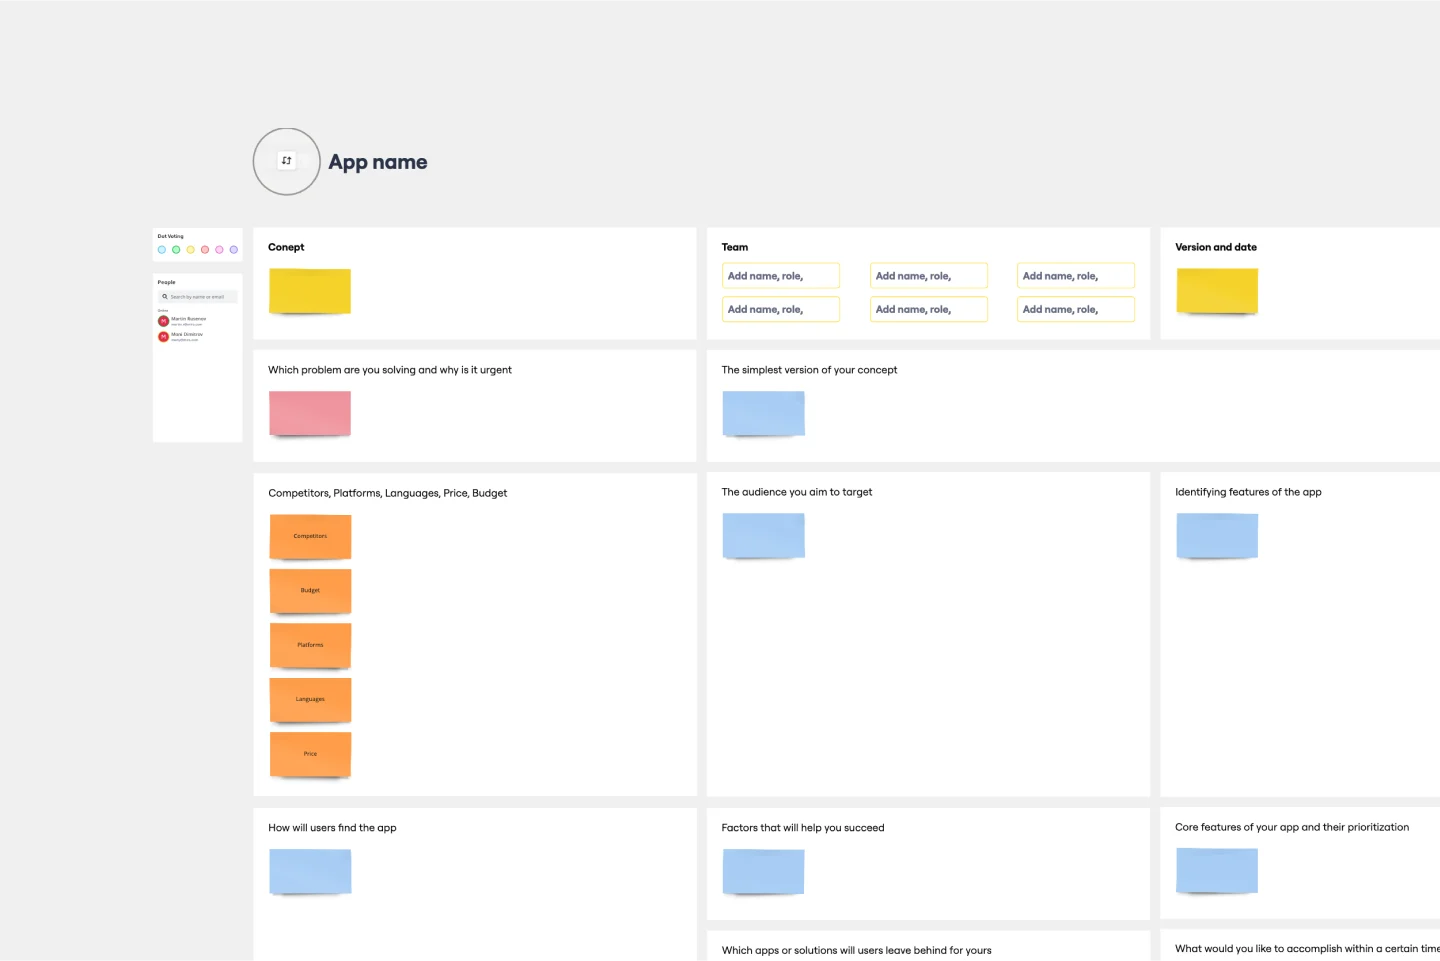
Ever noticed that building a successful app requires lots of players and moving parts? If you’re a project manager, you definitely have. Lucky for you, an app development canvas will let you own and optimize the entire process. It features 18 boxes, each one focusing on a key aspect of app development, giving you a big-picture view. That way you can fine-tune processes and get ahead of potential problems along the way—resulting in a smoother path and a better, tighter product.