Perceptual Map Template
Visually represent customers’ perceptions of your company, brand, product, or service.
About the perceptual map template
What is a perceptual map?
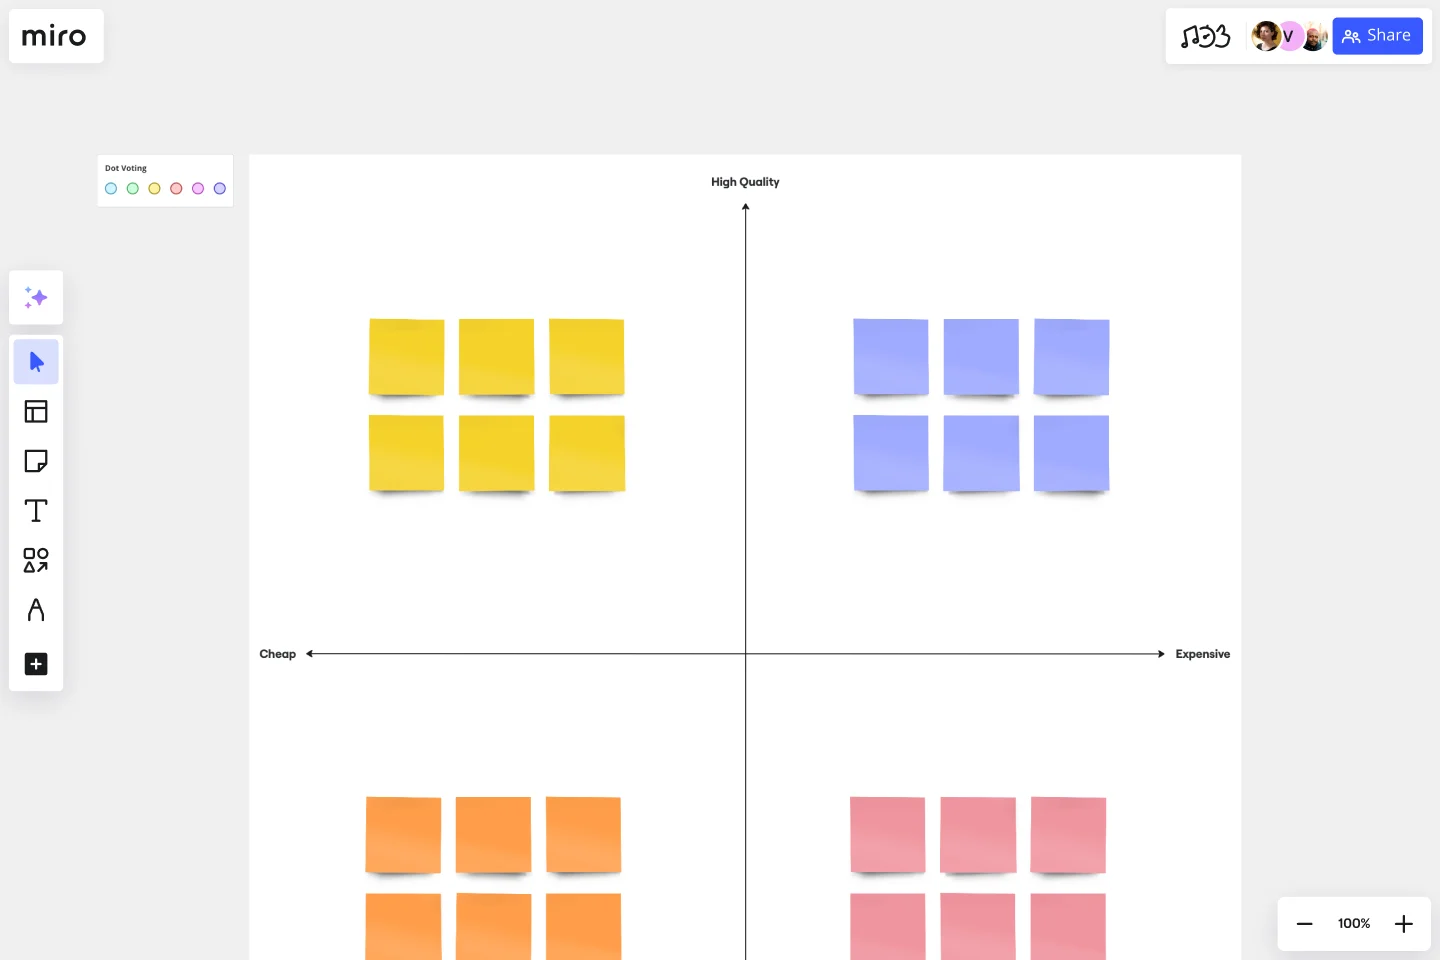
A perceptual map is a visual representation of customers’ or potential customers’ perceptions. Perceptual maps are used to assess organizations, brands, products, ideas, goods, or services.
Perceptual mapping is a powerful diagrammatic technique. To create a perceptual map, you must first draw two or more axes. The axes display your company’s product, brand, or service relative to your competition. Many marketers and product managers choose to use different size circles to represent sales volume or market share of competing products, though this is optional. You can then ask participants to rank competing products relative to each other along these axes. The resulting map gives you insight into how customers feel about competing products in a given market.
What can you use a perceptual map to assess?
You can use a perceptual map to assess a wide range of attributes such as price, performance, safety, and reliability. There are a variety of benefits to using a perceptual map.
Benefit 1 - Gain a better understanding of your product is positioned in a given market. If you’re operating in a dynamic, crowded market, it can be hard to know how your product measures up to the competition. If you’re operating in a small, new market, it can be equally difficult. Perceptual maps are vital for gaining insight into your relative strengths and weaknesses.
Benefit 2 - Discover how customers and potential customers perceive your brand. Many businesses ship goods or services without any view into why their customers bought them -- or why potential customers failed to do so. Perceptual mapping puts you in touch with your customers’ decision-making processes.
Benefit 3 - Assess your competition’s strengths and weaknesses. Since perceptual maps situate your business relative to your competition, it can help you figure out what your competitors are doing right and wrong.
Benefit 4 - Help your business understand gaps in the market. When your business is successful, it can be easy to keep shipping the same (or similar) products year after year without iterating. Perceptual maps help you explore the market and probe for unseen gaps, which might be ripe for exploitation.
Benefit 5 - Understand changes in customer behavior and purchasing decisions. Maybe your customers suddenly stopped buying a certain product, or maybe they started buying that product en masse. Either way, it’s crucial to understand why so you can make decisions going forward. A perceptual map gets at the heart of customer behavior.
Why use a perceptual map?
You can use a perceptual map to understand what your customers think about you and your competitors. This can help you track market trends, identify gaps in the market, and develop your branding and marketing strategies.
Get started with this template right now.
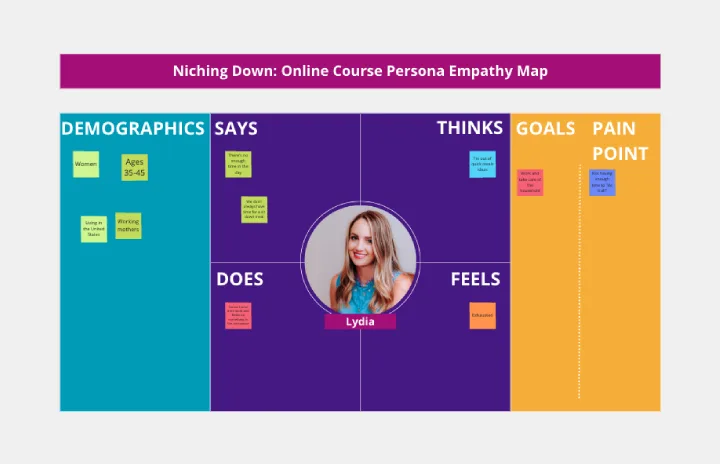
Niching Down: Online Course Persona Empathy Map
Works best for:
Market Research, Research & Design
Niching Down Online Course Persona Empathy Map helps you tailor online courses to specific personas. By understanding their needs and motivations, you can design more effective and engaging course content. Perfect for course developers and educators.
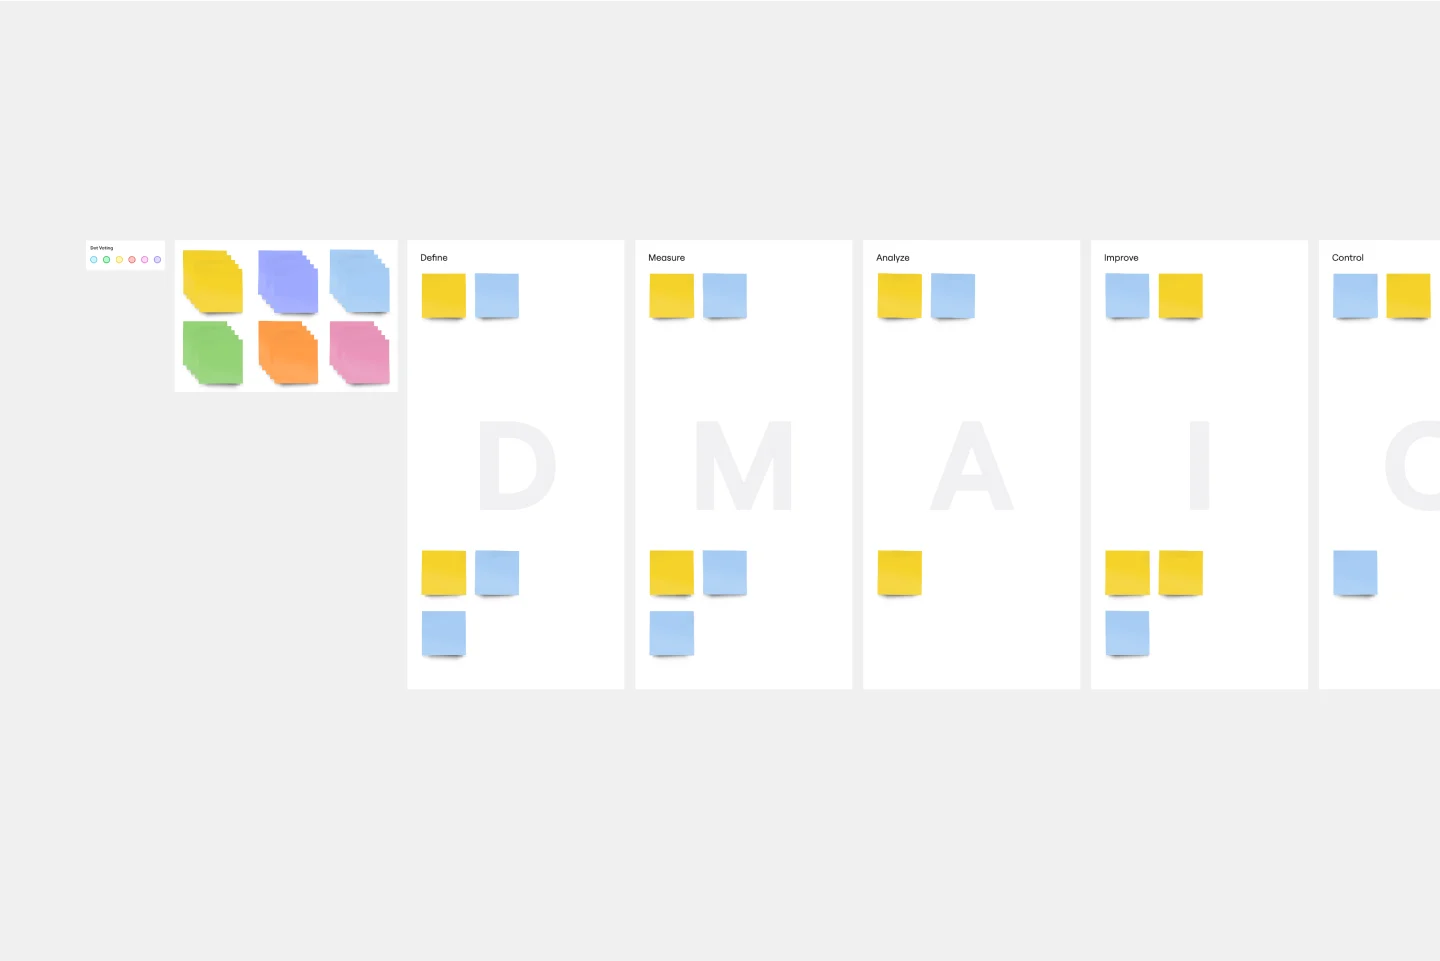
DMAIC Analysis Template
Works best for:
Agile Methodology, Design Thinking, Operations
Processes might not seem like the funnest thing to dive into and examine, but wow can it pay off—a more efficient process can lead to serious cost savings and a better product. That’s what DMAIC analysis does. Developed as part of the Six Sigma initiative, DMAIC is a data-driven quality strategy for streamlining processes and resolving issues. The technique is broken into five fundamental steps that are followed in order: Define, Measure, Analyze, Improve, and Control.
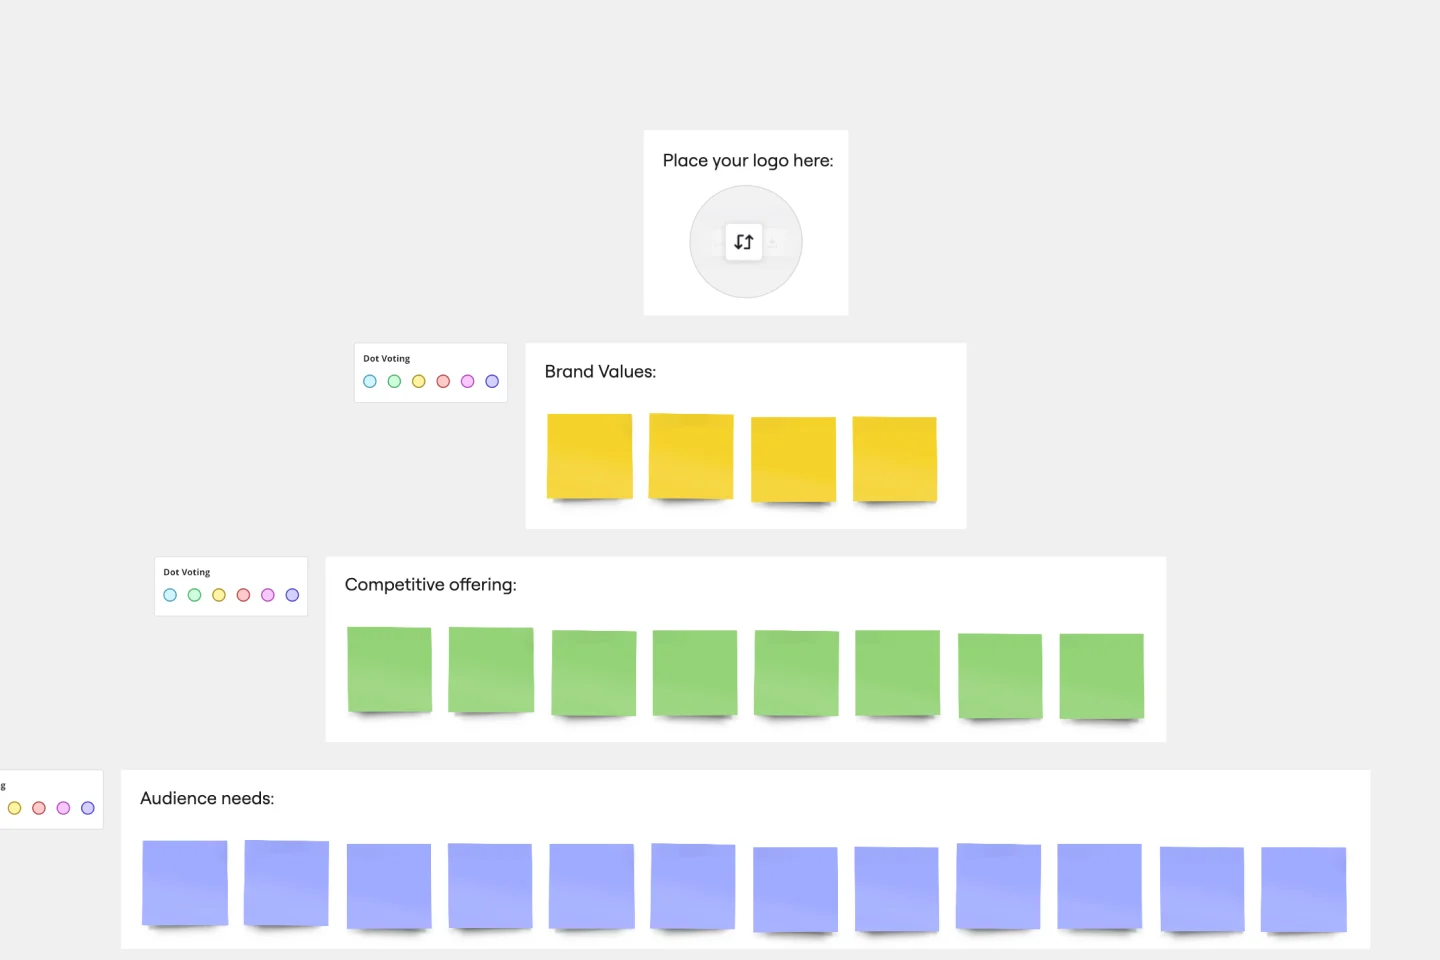
Brand Positioning Template
Works best for:
Strategy, Branding, Planning
The Brand Positioning Template is a valuable tool that helps businesses establish a strong market presence. It brings clarity and focus to a brand's identity and messaging by guiding users through a structured process. This ensures all aspects of a brand's positioning are aligned and thoughtfully considered. The Brand Positioning Template helps businesses articulate their unique value proposition, ensuring their messaging resonates effectively with their target audience and stands out.
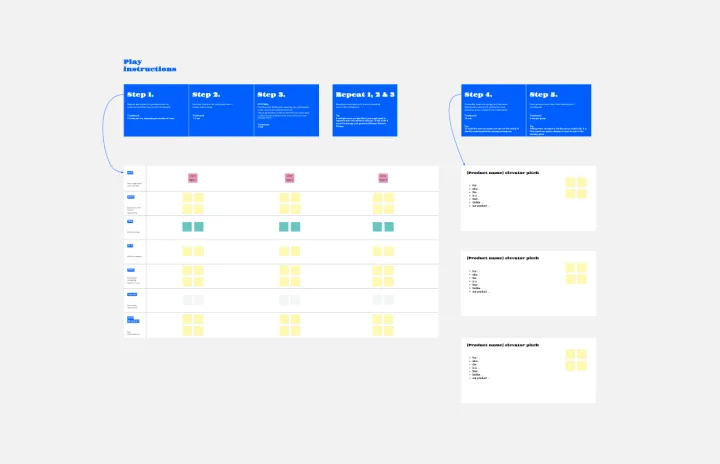
Elevator Pitch Template
Works best for:
Leadership, Marketing
Come together as a team and create a powerful Elevator Pitch with Miro’s template. Move projects forward and get your product idea funded with a killer storyline.
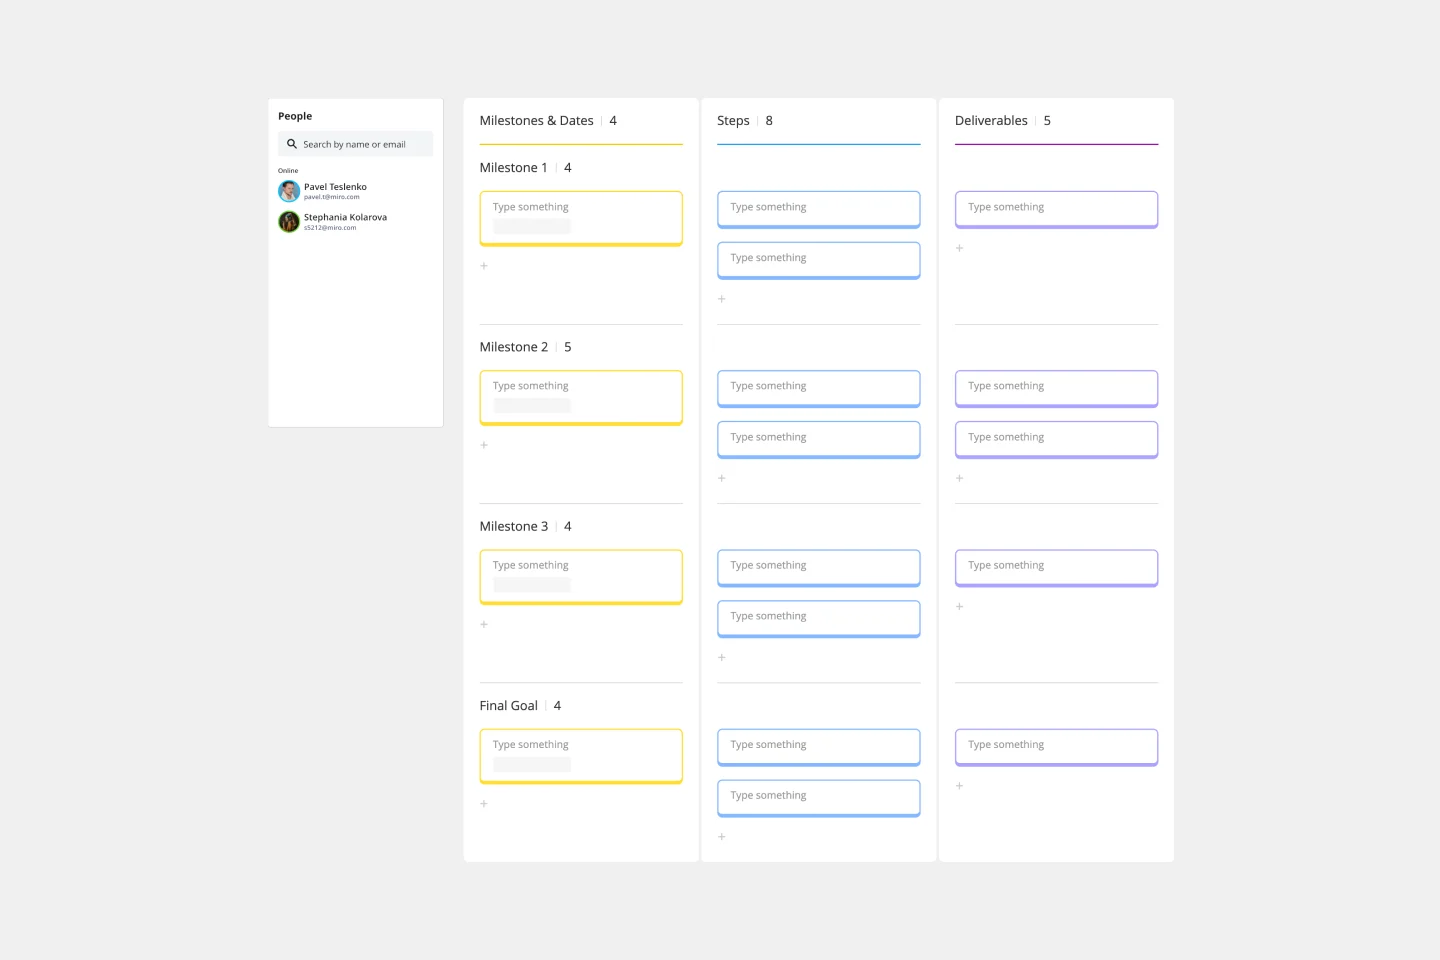
Milestone Chart Template
Works best for:
Project Management, Strategic Planning, Project Planning
When your team is collaborating on a large project, keeping track of the many tasks and multiple timelines can be a challenge. That’s why you need a milestone chart. These visual representations of important project events will make it simple for your team to stay on schedule and reach goals on time. And it’s so easy to get started — just determine the major milestones, use our template to create a milestone chart, and define the key dates and deliverables each milestone will require.
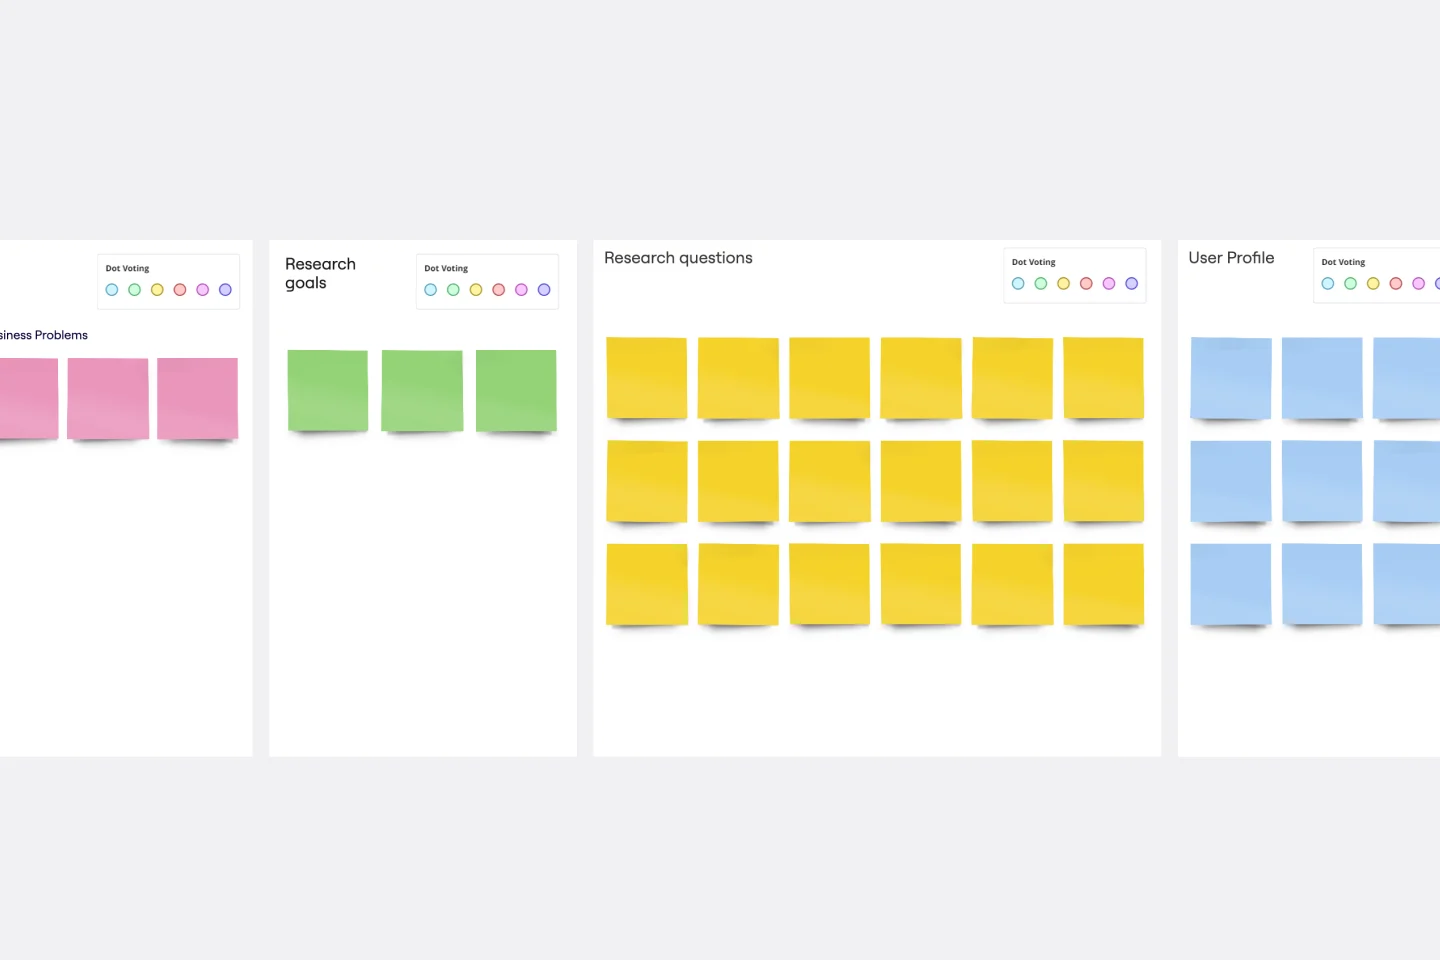
UX Research Plan Template
Works best for:
Market Research, Desk Research, User Experience
A research plan communicates the fundamental information that stakeholders need to understand about a user experience research project: who, what, why, and when. The plan ensures everyone is aligned and knows what they must do to make the UX research project a success. Use the research plan to communicate background information about your project; objectives; research methods; the scope of the project, and profiles of the participants. By using a UX research plan, you can achieve stakeholder buy-in, stay on track, and set yourself up for success.