Pedigree Diagram Template
Map genetic traits to family members with a pedigree diagram.
About the Pedigree Diagram Template
You can identify how traits and diseases are passed from one generation to the next using the pedigree diagram template. Pedigree Diagrams are useful for doctors, veterinarians, farmers, and anyone else working with genes or interested in genetics.
What is a pedigree diagram?
A pedigree diagram is an advanced version of a family tree, that is commonly used to diagram relationships within family members. It shows how genetic traits and diseases are passed from one generation to the next.
You can use a pedigree diagram to see which family members carry a certain trait, like a widow’s peak. Doctors use them to see how diseases are passed from parents to children. Farmers use it in husbandry to track traits in crops and animals.
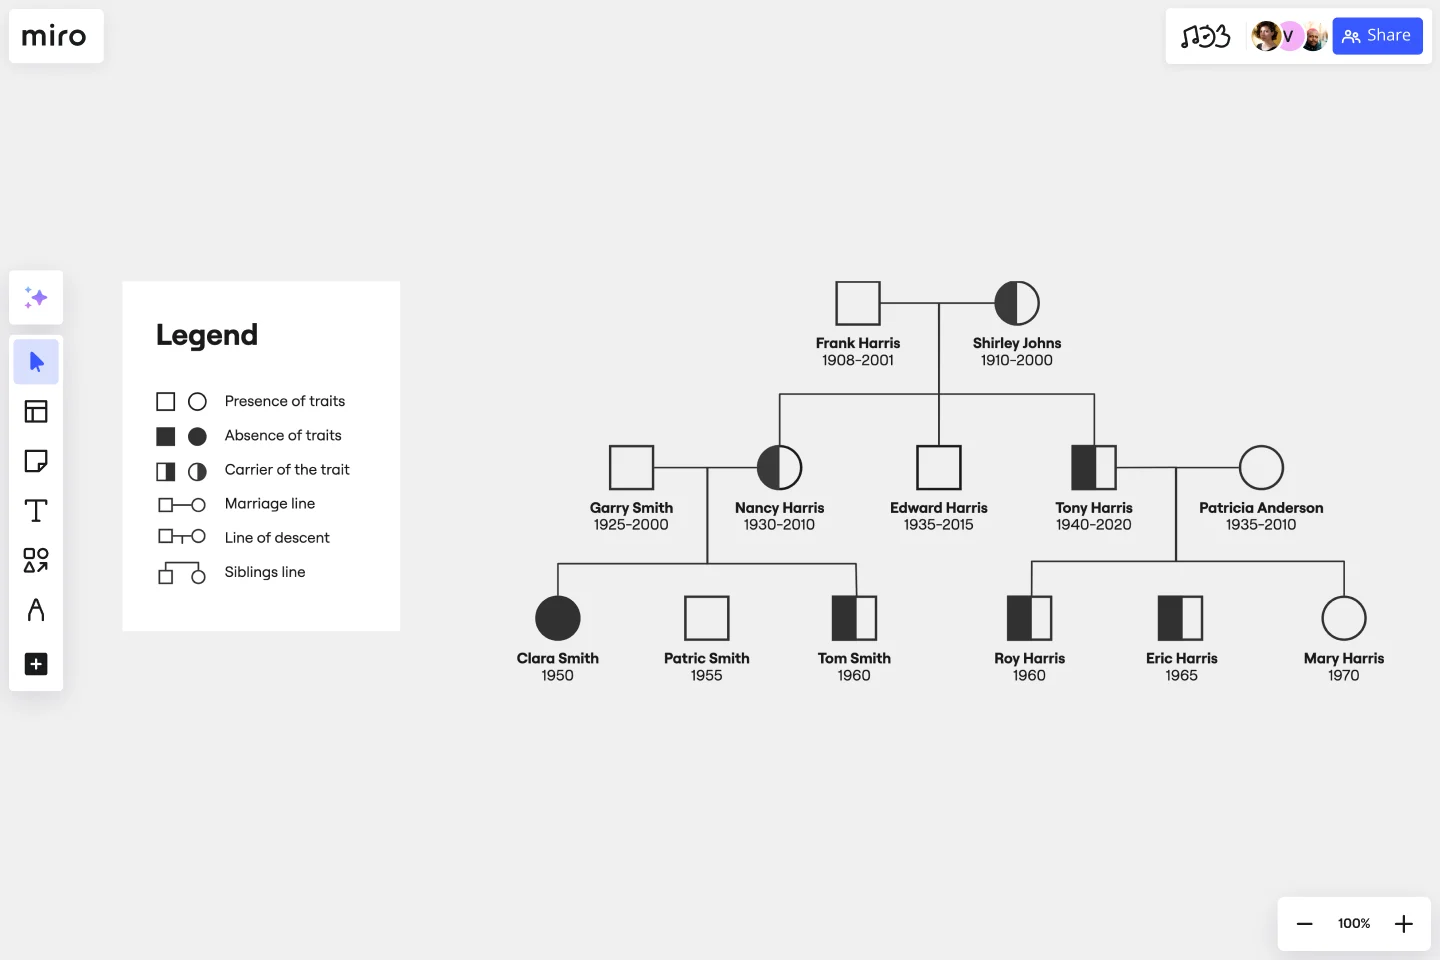
In a pedigree diagram, males are represented by squares; females by circles. Shaded symbols mean someone has a specific trait (e.g., dimples). Unshaded symbols mean an individual doesn’t have a specific trait.
Benefits of pedigree diagrams
Pedigree diagrams can help doctors identify and diagnose diseases.
For example, let’s say someone has a family history of heart disease. A pedigree diagram will tell us whether this individual is likely to have a heart condition. This can help doctors diagnose and treat patients faster, then provide better healthcare.
In science, pedigree diagrams can help understand how traits are inherited.
For example, dimples may pass from father to son in one family, and from mother to daughter in another. Blonde hair might pass from grandparents to grandchildren, but not from parents to children. Pedigree diagrams make patterns like these easy to identify.
Create your own pedigree diagram
Miro’s is the perfect starting point for a pedigree diagram. Get started by opening the template on this page and following the steps below.
Step 1:
Add individuals to your pedigree diagram. Go with as many as you can — or as many as are relevant. Place older generations at the top and younger ones below them.
Males are represented by squares. Females are represented by circles.
You can always use Miro to change symbols around later, so if you make a mistake, don’t worry. Just try to be as thorough as possible.
Step 2:
Connect individuals using lines of marriage and descent. A straight horizontal line represents the marriage between two individuals.
Descent is represented by diagonal and vertical lines that connect a couple from an older generation to a younger individual.
Step 3:
Add dates. This isn’t strictly necessary, but it can help keep track of individuals across generations.
Add dates of birth, death, and/or marriage lines to your pedigree diagram template.
Step 4:
Use symbols to show which family members have or don’t have a specific trait.
For example, let’s say your pedigree diagram shows widow’s peaks. Family members who don’t have a widow’s peak will be represented by unshaded symbols. Family members who do have a widow’s peak will be represented by a shaded symbol.
Once you’re ready to collaborate and receive feedback, use Miro to share your Pedigree diagrams. You may want to also create a family tree to share other details of your family.
Example of pedigree diagram
Let’s imagine the Smith family has a long history of diabetes. But, some members of the family develop the condition, while others don’t.
We can use a pedigree diagram to see the pattern of inheritance, i.e., how the disease is passed from parent to child.
This can help us predict whether a given Smith family member has diabetes or will develop it in the future.
How do you draw a Pedigree Diagram?
Open our Pedigree Diagram template. Map out a family tree using lines to show familial relationships. Once you’re done, identify individual genetic traits using Pedigree Diagram shapes and shading.
What do the symbols in a Pedigree Diagram mean?
A square represents a male; a circle indicates a female. Shaded shapes mean someone has a genetic trait. Unshaded shapes mean an individual doesn’t have a trait. A half-shaded shape means that someone carries a genetic trait without it being visible.
What is the purpose of a Pedigree Diagram?
A Pedigree Diagram is a family tree that shows how genes are passed from generation to generation. It can help us predict the likelihood of a child having a disease or trait, e.g., dimples or diabetes. It can also help us see how traits are passed from parents to children.
Is a circle male or female in Pedigree Diagrams?
In Pedigree Diagrams, a circle is always female. This is universal for all organisms, including trees and flowers. Males are represented by squares.
What do dark circles mean on a Pedigree Diagram?
A dark circle represents a female that has a visible genetic trait. For example, a woman who has her father’s blonde hair or her mother’s dimples might be represented by a dark circle.
Get started with this template right now.
Incident Management Process Flowchart Template
The Incident Management Process Flowchart Template in Miro is designed to streamline and clarify the process of managing incidents within an organization. This template serves as a visual guide that outlines the steps involved in incident management, from the initial declaration to the final review. It is a living document, continuously evolving based on feedback and lessons learned from past incidents, ensuring that the process remains up-to-date with best practices. By defining incidents as disruptions requiring a coordinated response to restore service levels, the template emphasizes the importance of a structured, organized, and timely approach. It covers various phases such as Incident Declaration, Assessment, Response, Communication, and Review, providing a clear framework for teams to follow.
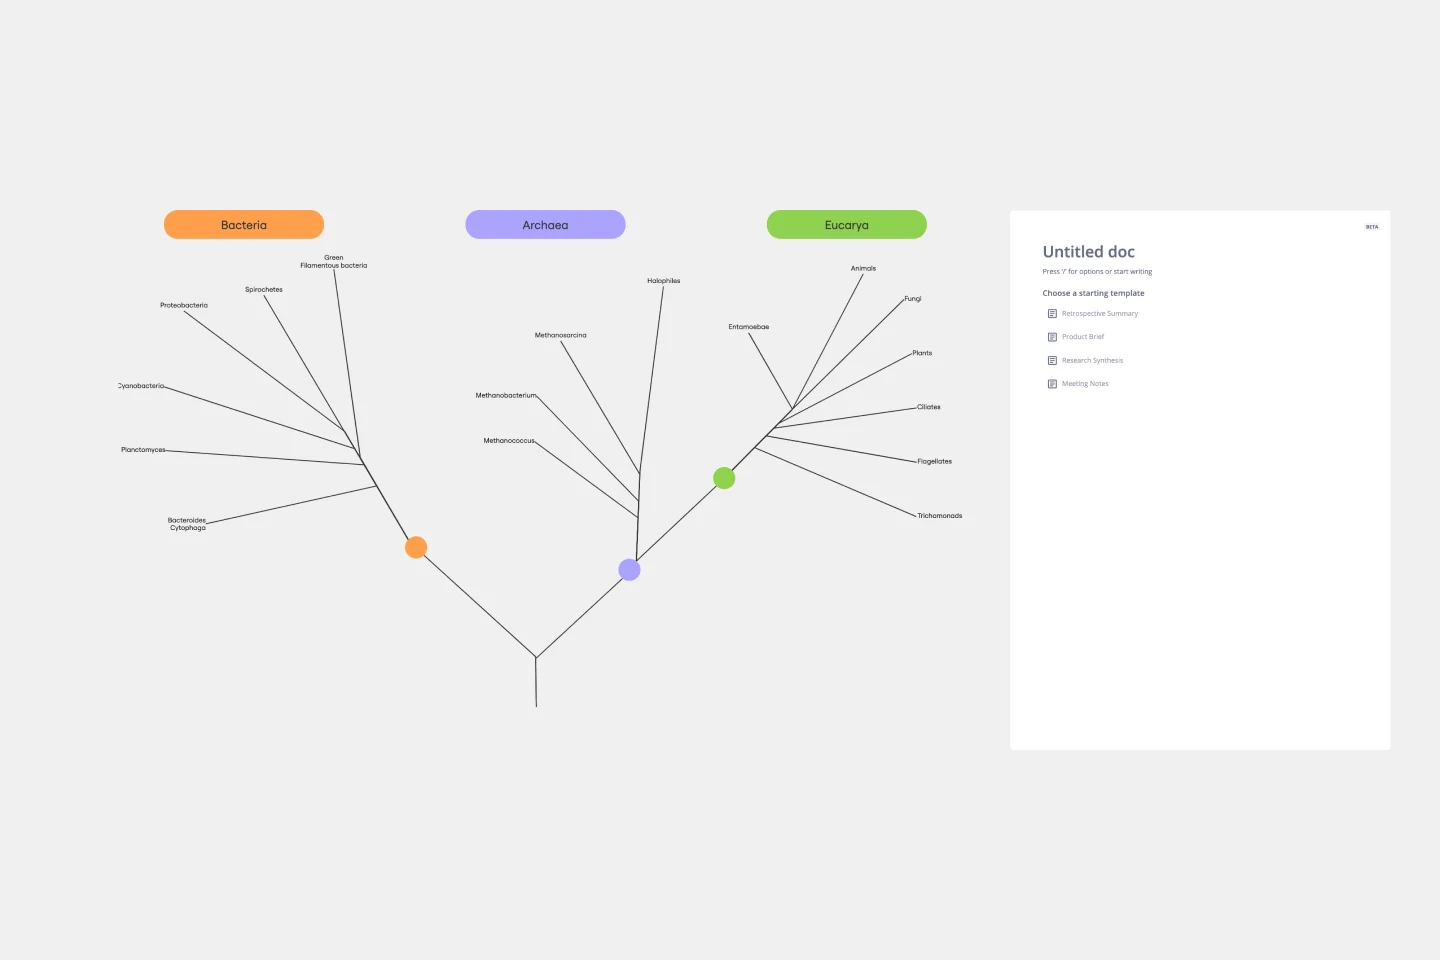
Phylogenetic Tree Template
Works best for:
Diagramming
The Phylogenetic Tree Template is a powerful tool that allows scientists and researchers to visualize evolutionary relationships between species. It is a visual representation of the history of the evolution of life on Earth and helps users identify the relationships between other organisms and their ancestors. The key benefit of this template is that it organizes complex data and makes it more understandable to everyone. Additionally, it offers an efficient way to collect and analyze data, saving time and effort and enabling users to identify significant patterns and relationships in the data.
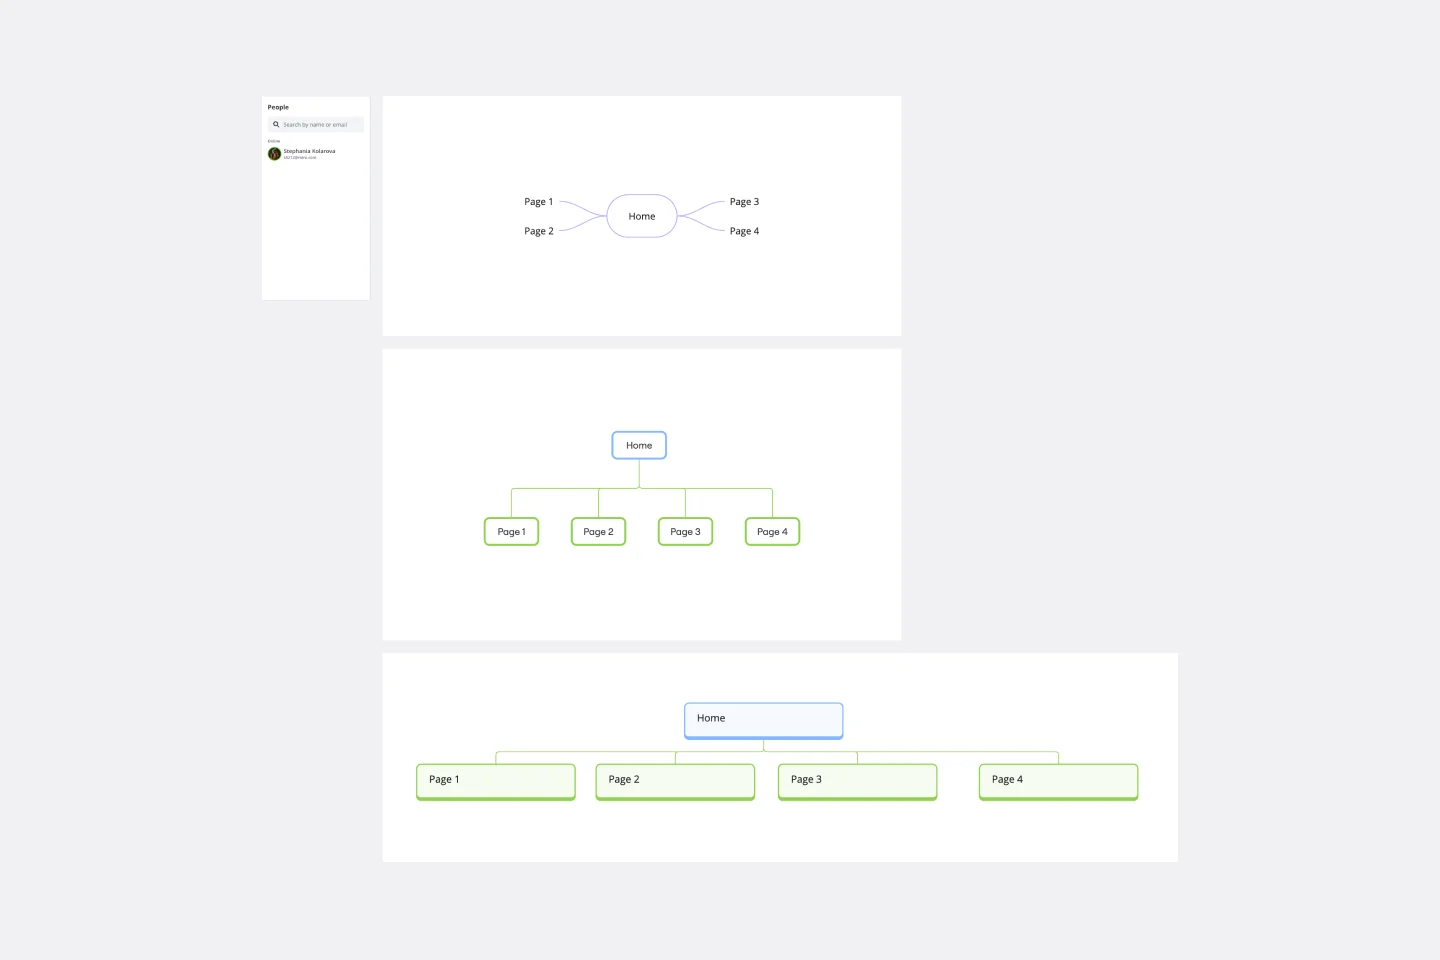
Sitemap Template
Works best for:
Mapping, Software Development, Diagrams
Building a website is a complex task. Numerous stakeholders come together to create pages, write content, design elements, and build a website architecture that serves a target audience. A sitemap is an effective tool for simplifying the website design process. It allows you to take stock of the content and design elements you plan to include on your site. By visualizing your site, you can structure and build each component in a way that makes sense for your audience.
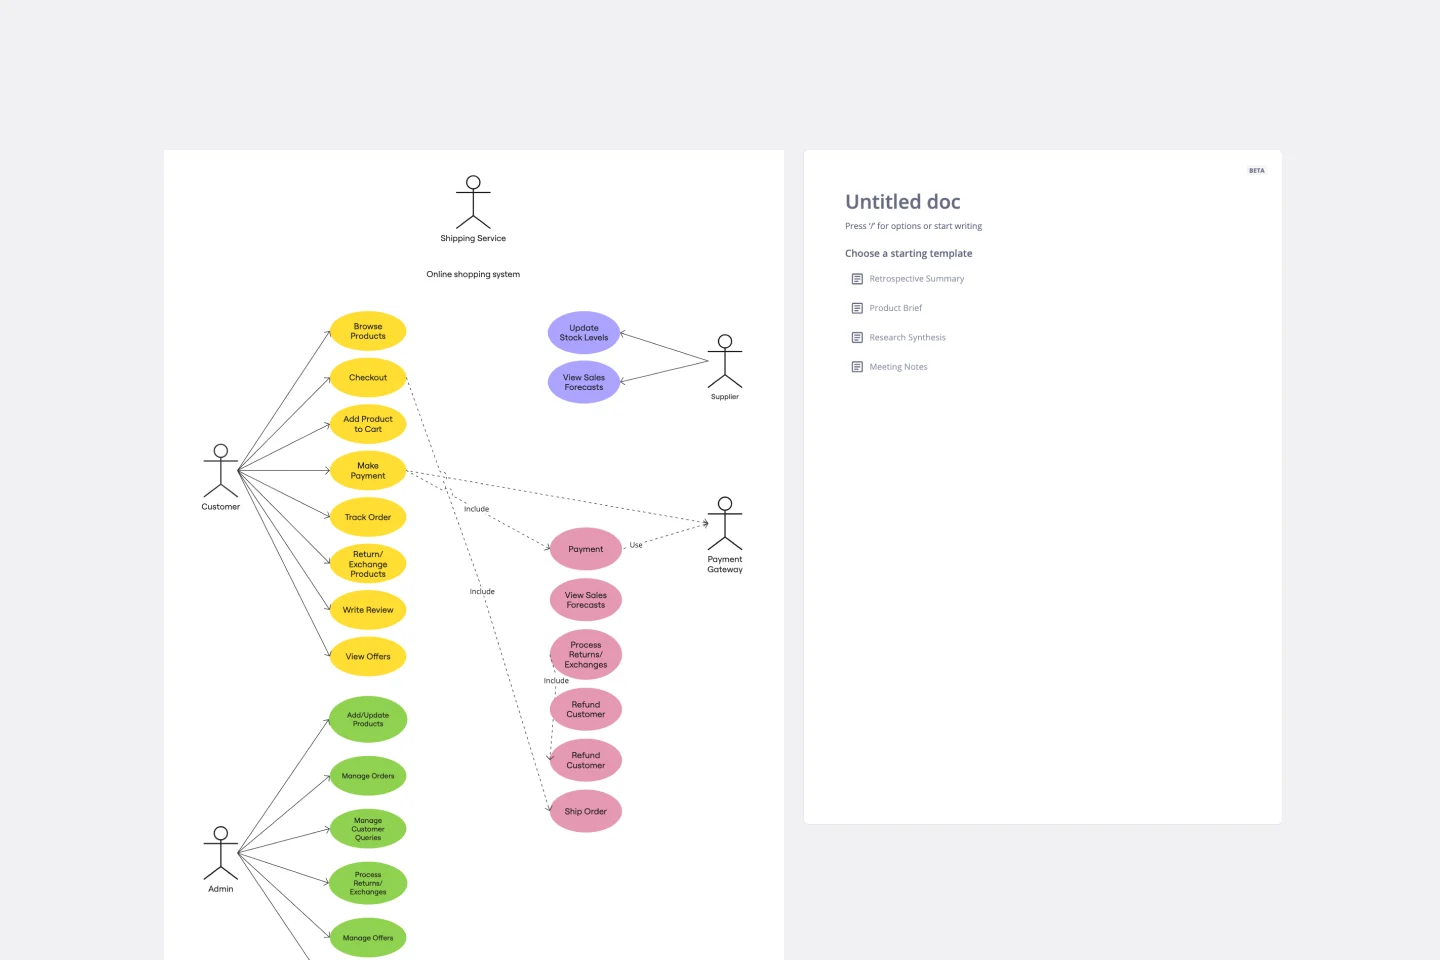
UML Use Case Online Shopping System Template
Works best for:
UML
The Online Shopping System Template simplifies the process of documenting and visualizing how users interact with an online shopping system. It provides a standard way to map out user interactions, such as product listings, inventory management, shopping carts, order processing, payments, and shipping details. By using this template, teams can collaborate effectively in real-time or at different times, adjusting the diagram to meet their project's specific needs. This not only improves clarity and efficiency but also fosters better communication among team members and stakeholders, ensuring a thorough understanding of the system's design and requirements.
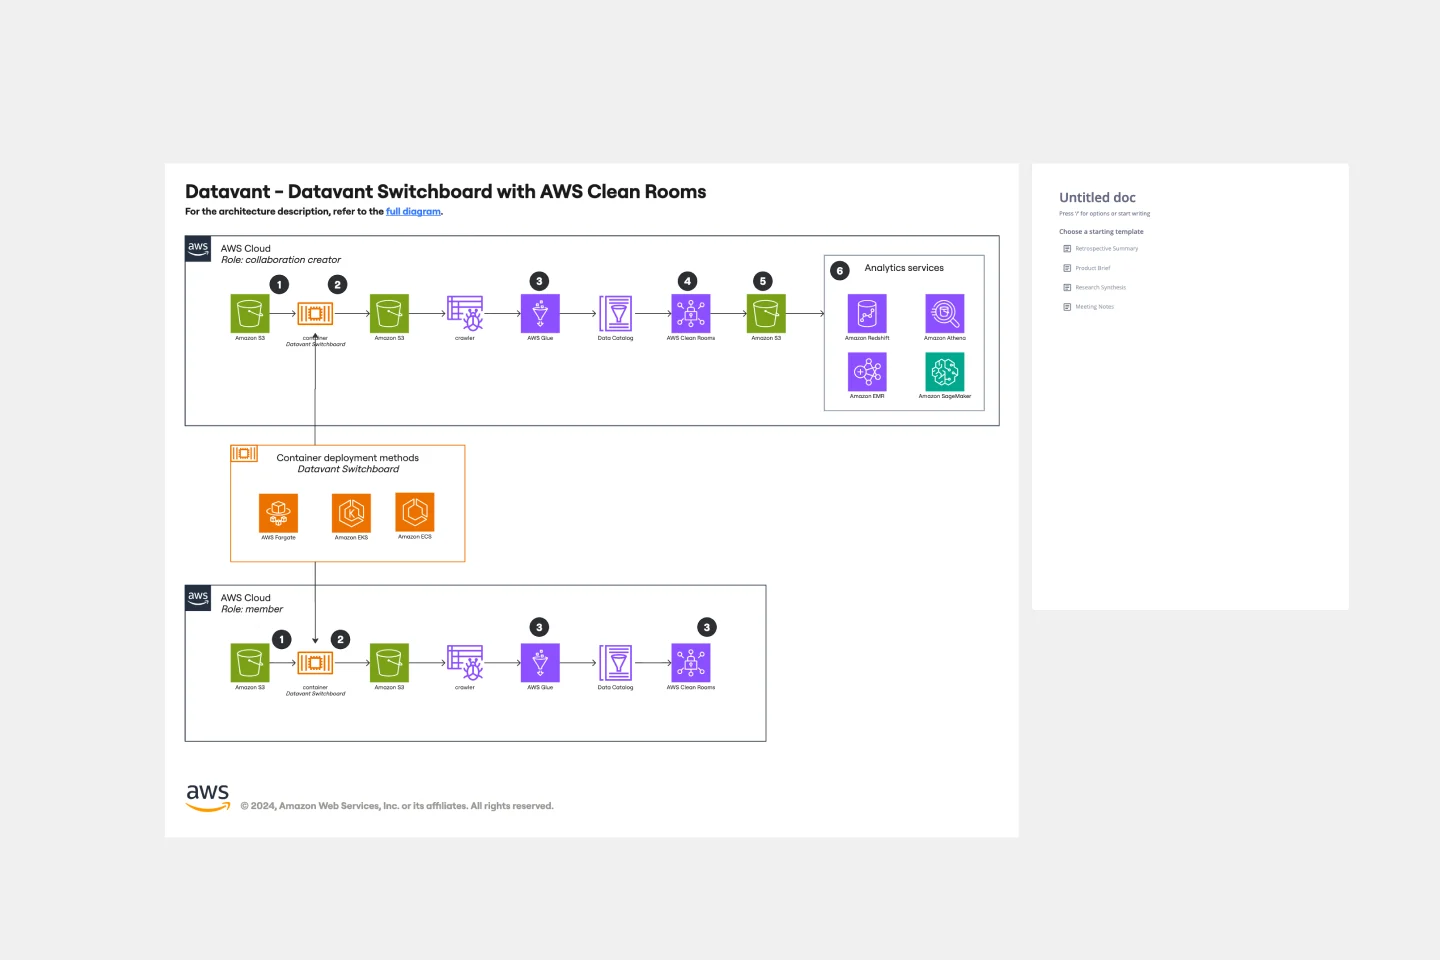
Datavant Switchboard with AWS Clean Rooms Template
Works best for:
AWS
The AWS Datavant Switchboard Clean Rooms Template integrates health data sources using Datavant's secure data connection capabilities and AWS Clean Rooms' scalable data processing environment. It's useful for professionals in engineering, database management, and development. The customizable Miro interface streamlines secure and efficient data handling and team collaboration for a wide range of projects.
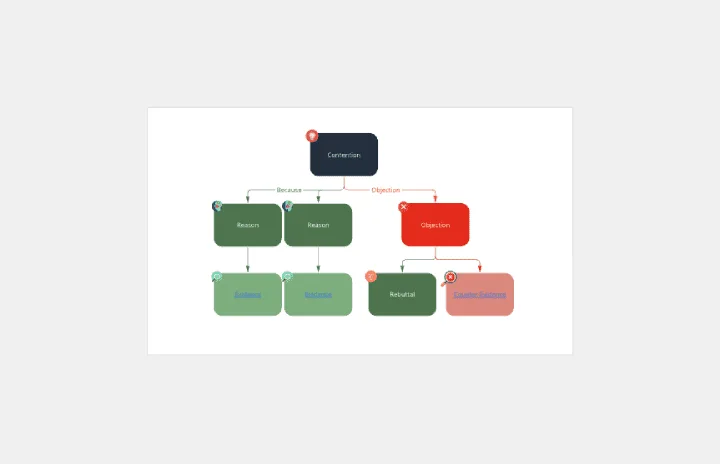
Argument Map
Works best for:
Diagramming
The Argument Map template is a visual tool for structuring and analyzing arguments and debates. It provides a structured framework for capturing premises, conclusions, and logical relationships. This template enables teams to explore complex issues, identify strengths and weaknesses in arguments, and make informed decisions. By promoting clarity and critical thinking, the Argument Map template empowers teams to navigate debates and discussions effectively, fostering consensus and understanding.