Organizational Change Map
Organizational change can be done in many ways.
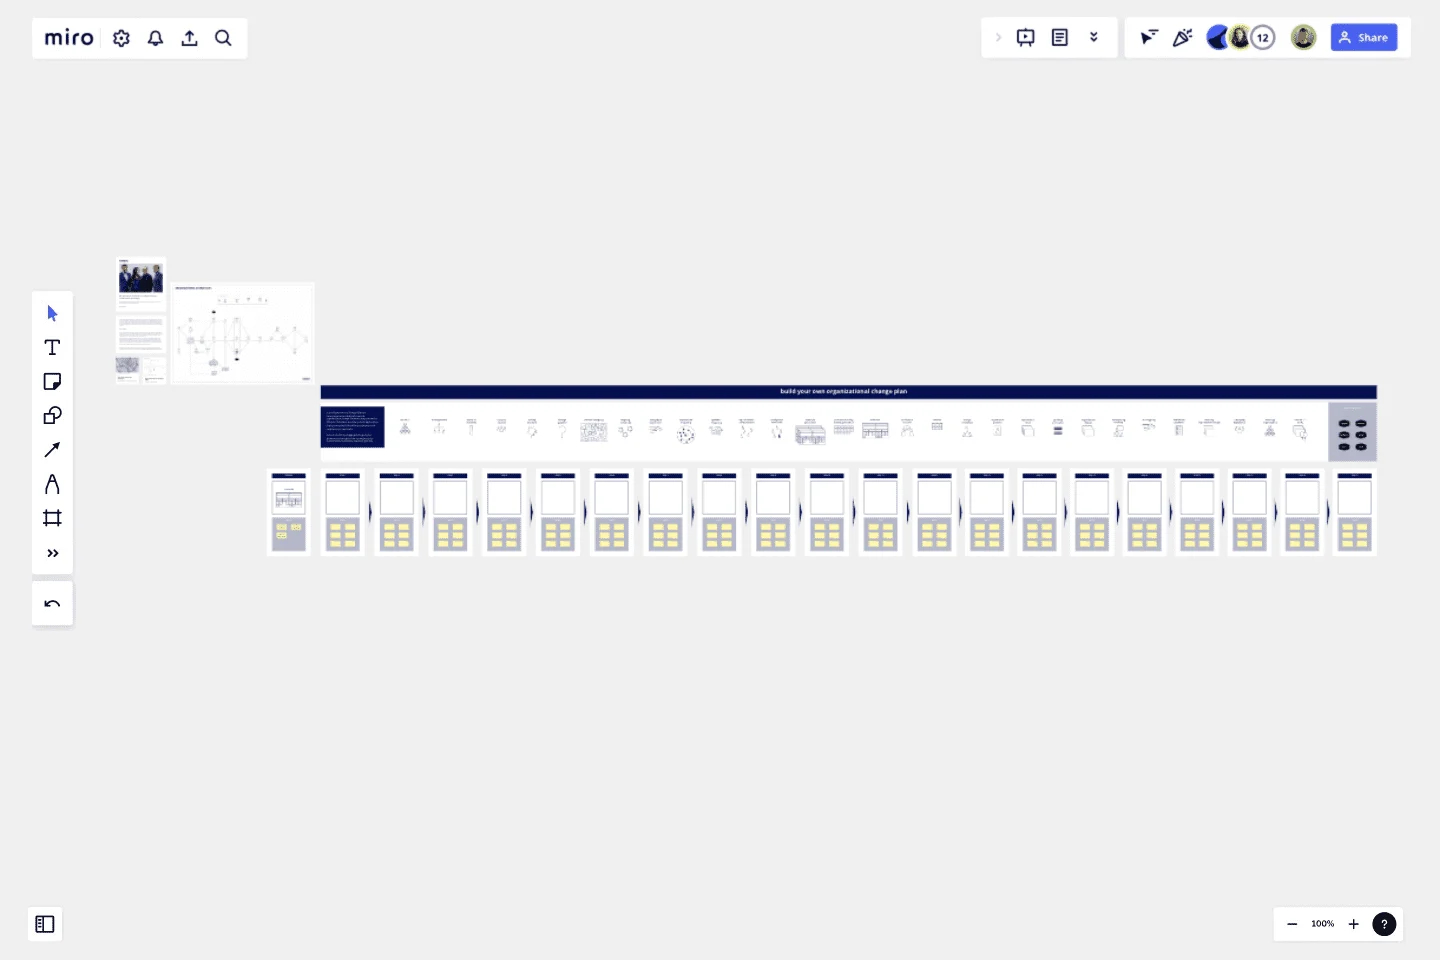
There are many different types of activities that can contribute to a successful reorganization. But how do you start? What elements do you need and how are these things connected to each other? At Fæbric, we have developed a map to facilitate you in your organizational change project. We have designed the map on basis of our experiences in organizational change. You are invited to use it freely. If you have feedback or questions, please reach out to us.
How it works?
On a normal map of for example a country you can see cities and roads. It gives you and overview of different cities you can visit and the different routes you can take. However, the map does not tell you which cities to visit and which routes to take. For this, a guide may advise you, taking your context and preferences into account and accompany you on the road.
The Organizational Change Map works the same as a normal map: It gives you an overview of the different activities and different routes you can take to realize your organizational change. How do these roads connect, what are the advantages and pitfalls of possible short tracks and what are the implications for the organization, the people, and the timing? Based on your preferences and needs, we can advise you which route to take and accompany you along the way.
In the Organizational Change Map we communicate our ideal path towards organizational change. However, every context is different. Therefore, with this Miro template, we offer you the opportunity to play around with the different elements and compose your own route.
Difficulties with designing an approach for your organizational change project? Difficulties with explaining it to your team and stakeholders? With the Miro template you can sketch your own organizational change trajectory.
When to use it?
If you are planning an organizational change project the Organizational Change Map can help you. The Organizational Change Map itself gives you (and your stakeholders) an overview of how activities, that contribute to organizational change, are linked. The Miro template gives you the opportunity to play around with the organizational change elements.
How to use it?
Take a look at the Organizational Change Map and decide on the activities you think are necessary and would like to execute.
Drag the elements of the activities in the right order using the template.
Make notes under the elements if necessary.
Discuss your plan for organizational change with your team and stakeholders!
Make use of available Miroverse templates while executing your organizational change plan.
This template was created by Fæbric.
Get started with this template right now.
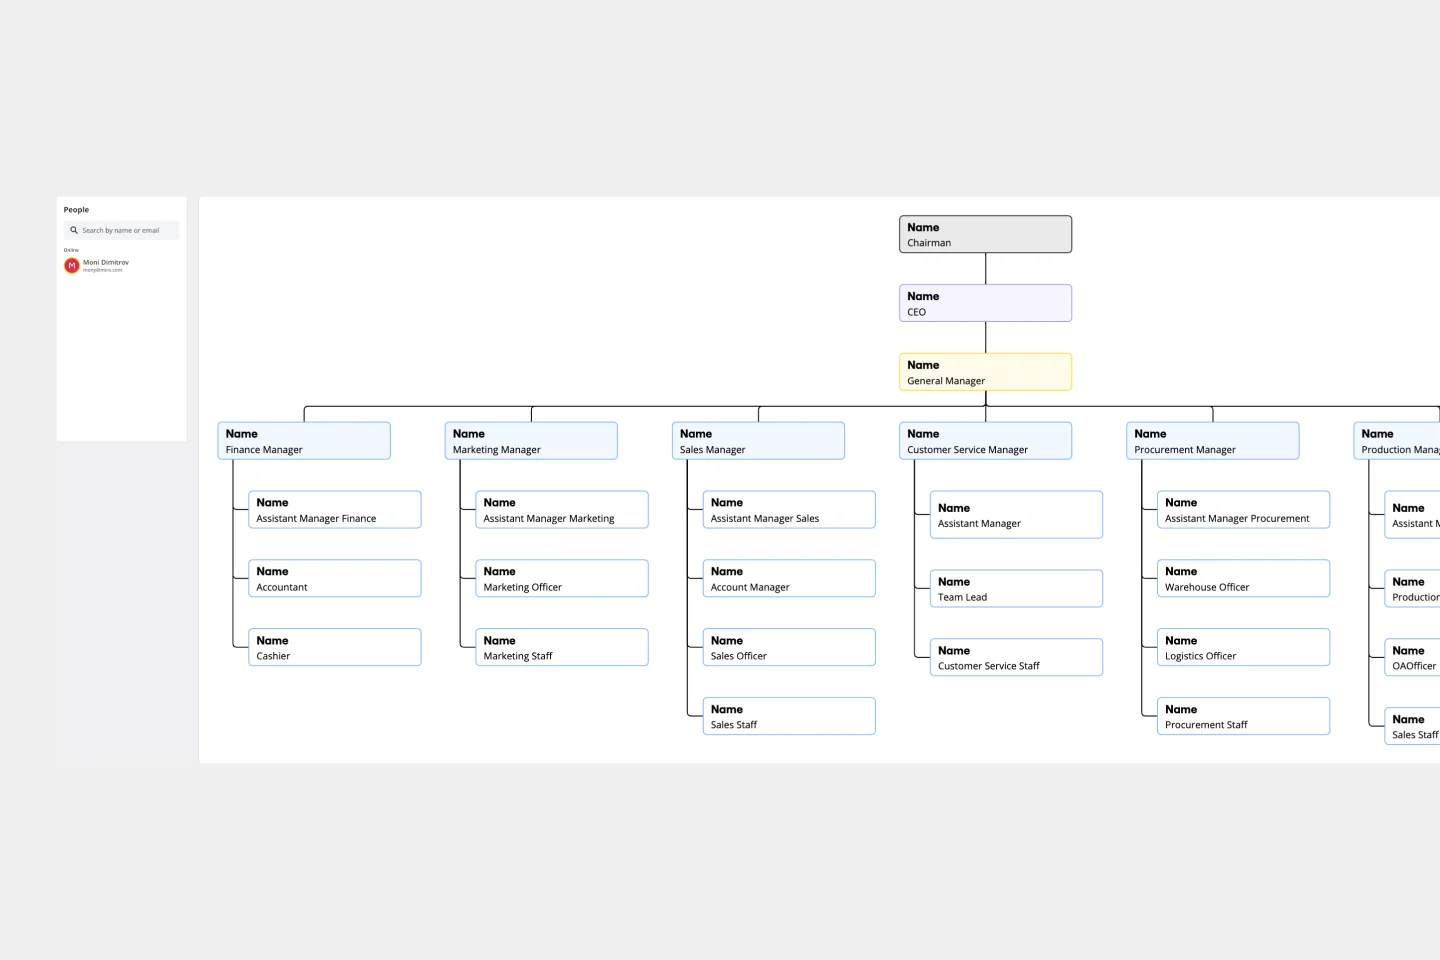
Company Organizational Chart
Works best for:
Org Charts, Operations, Mapping
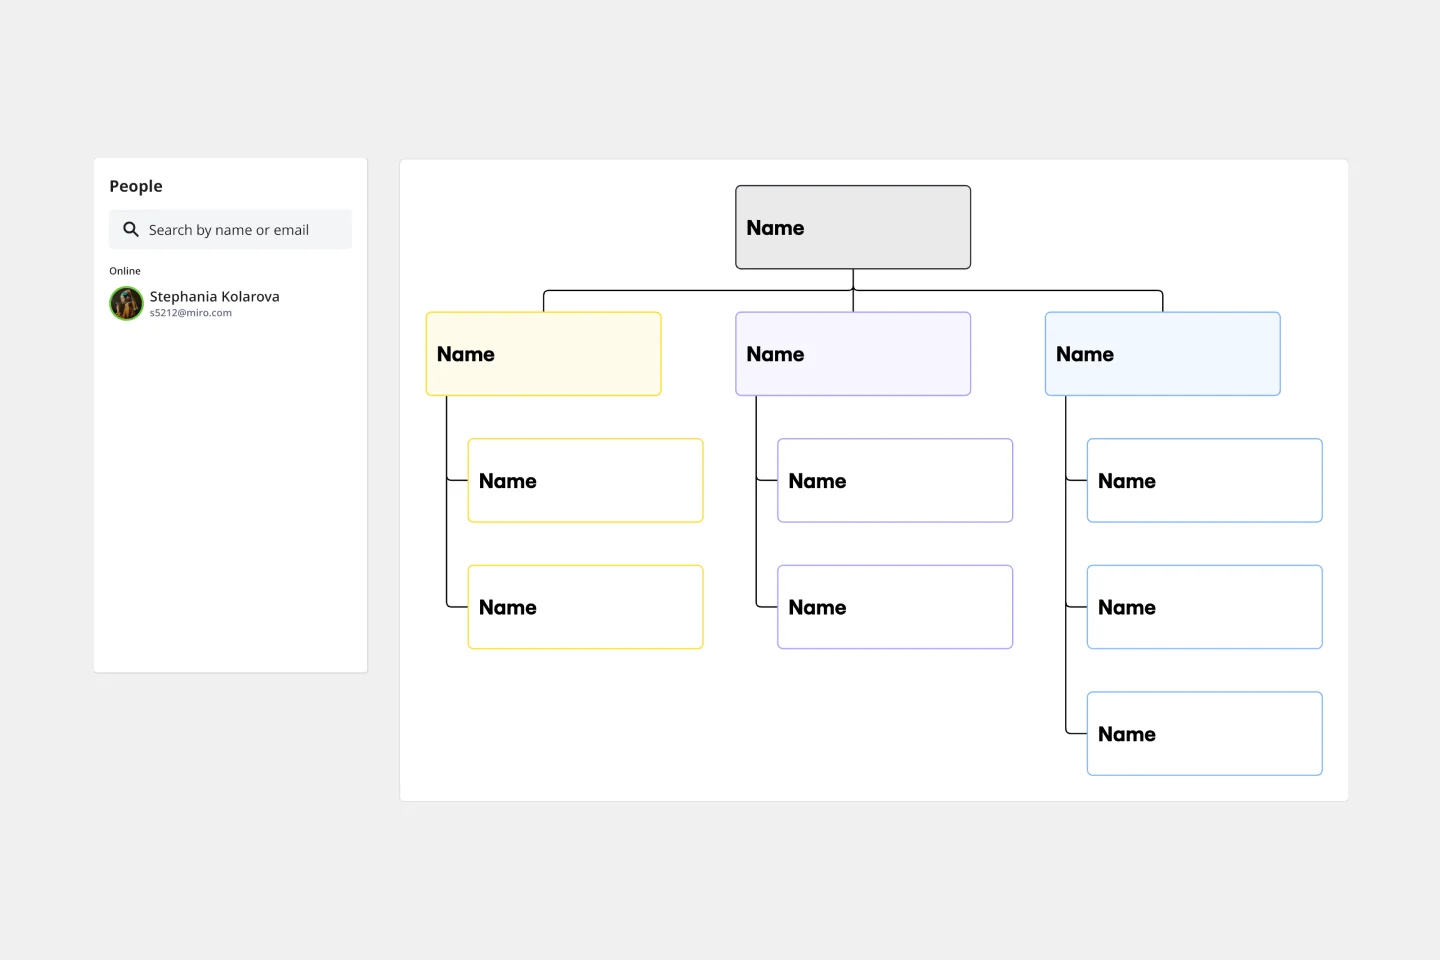
An org chart is a visual guide that sums up a company’s structure at a glance—who reports to whom and who manages what teams. But it does more than just display the chain of command. It also showcases the structure of different departments and informs employees who to reach out to with issues and concerns. That makes it an especially valuable tool for new hires who are getting familiar with the company. Our templates make it easy for you to add your entire team and customize the chart with colors and shapes.
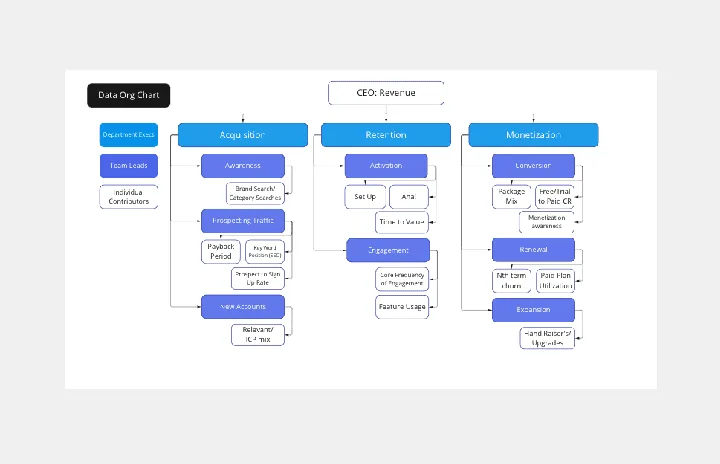
Data Org Chart
Works best for:
Org Charts, Operations, Mapping
The Data Org Chart template provides a visual representation of data-related roles and relationships within an organization. By mapping out data management responsibilities and dependencies, teams can enhance data governance and improve collaboration. With features for customizing data roles and connections, this template empowers teams to optimize data processes and ensure data integrity and compliance.
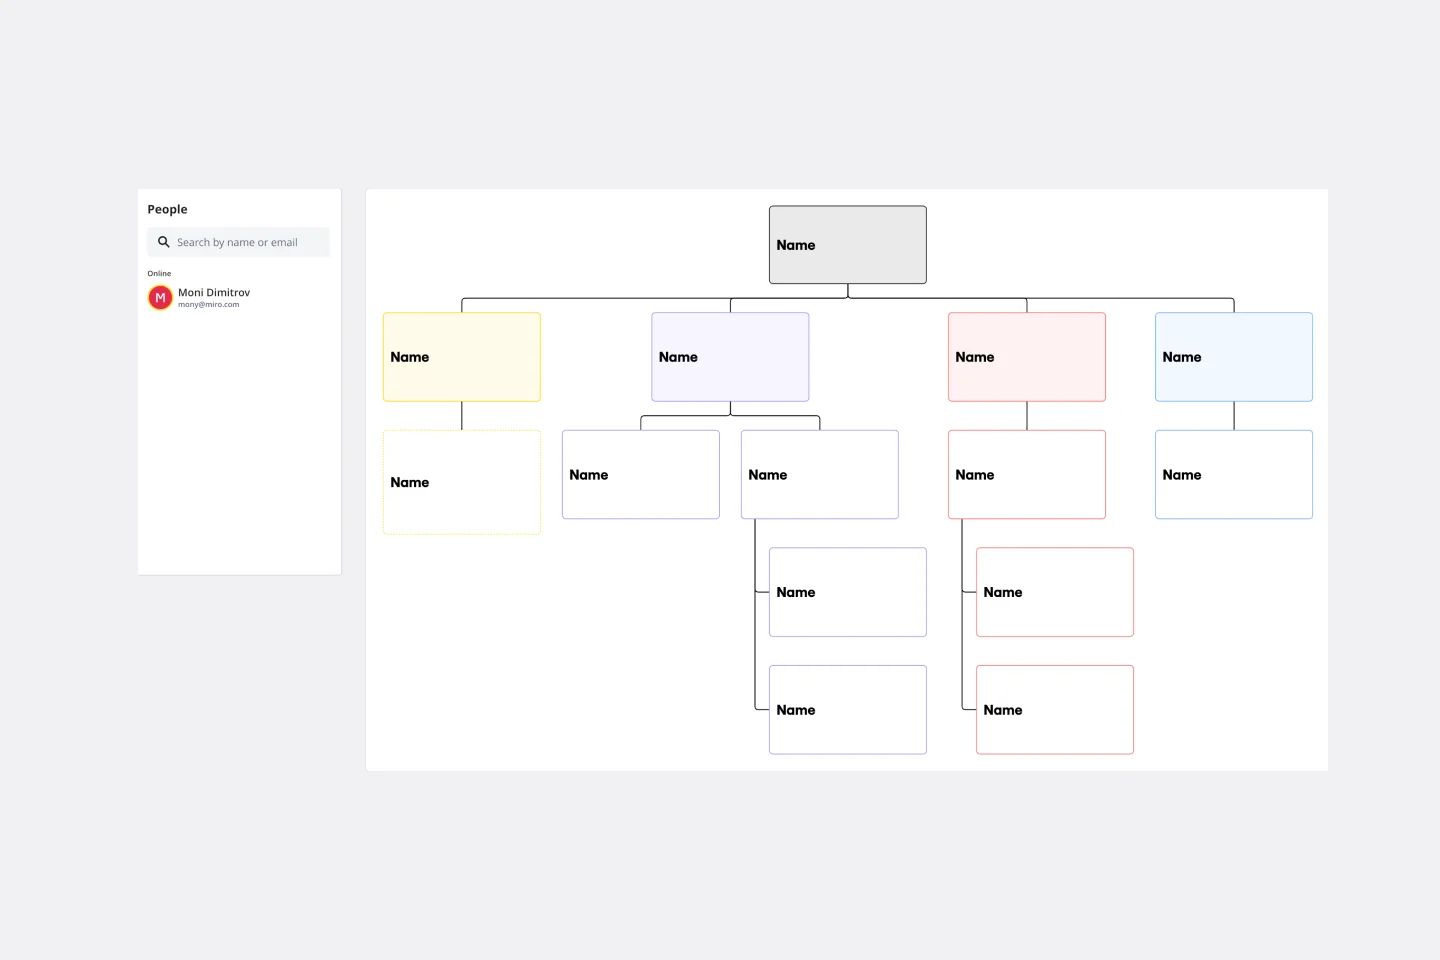
Vertical Organizational Chart
Works best for:
Organizational Charts, Organizational Design
The Vertical Organizational Chart Template is an efficient way to illustrate the hierarchy of an entity in a top-down format. This tool helps represent roles and relationships in a clear manner, starting from the topmost authority and branching downwards. It allows for a better understanding of the flow of responsibilities and communication channels within the organization. One of its most significant advantages is promoting clear communication. Depicting the organization's structure helps avoid misunderstandings and ensures everyone is on the same page regarding the chain of command.
Skill Gap Analysis Org Chart Template
Works best for:
Diagramming
The Skill Gap Analysis Org Chart Template helps organizations optimize their workforce by assessing and addressing skill gaps. It integrates skill analysis with succession planning, identifies leaders, and fosters cross-functional collaboration. This template aligns employee skills with organizational objectives for sustained success.
Circular Org Chart Template
Works best for:
Organizational Chart
The Circular Org Chart Template is an innovative solution that helps represent and visualize complex organizational structures with ease. The key advantage of this template is its ability to present complex hierarchies in a visually appealing and easy-to-understand format. By adopting a circular arrangement, the template provides a comprehensive and holistic view of the organization, making it effortless for teams to comprehend reporting relationships at a glance. The visual clarity offered by this template fosters efficient communication and decision-making, offering a seamless experience for teams to understand their organizational structure. The template's intuitive design and emphasis on visual representation significantly enhance transparency, promoting a deeper understanding of organizational roles and relationships.
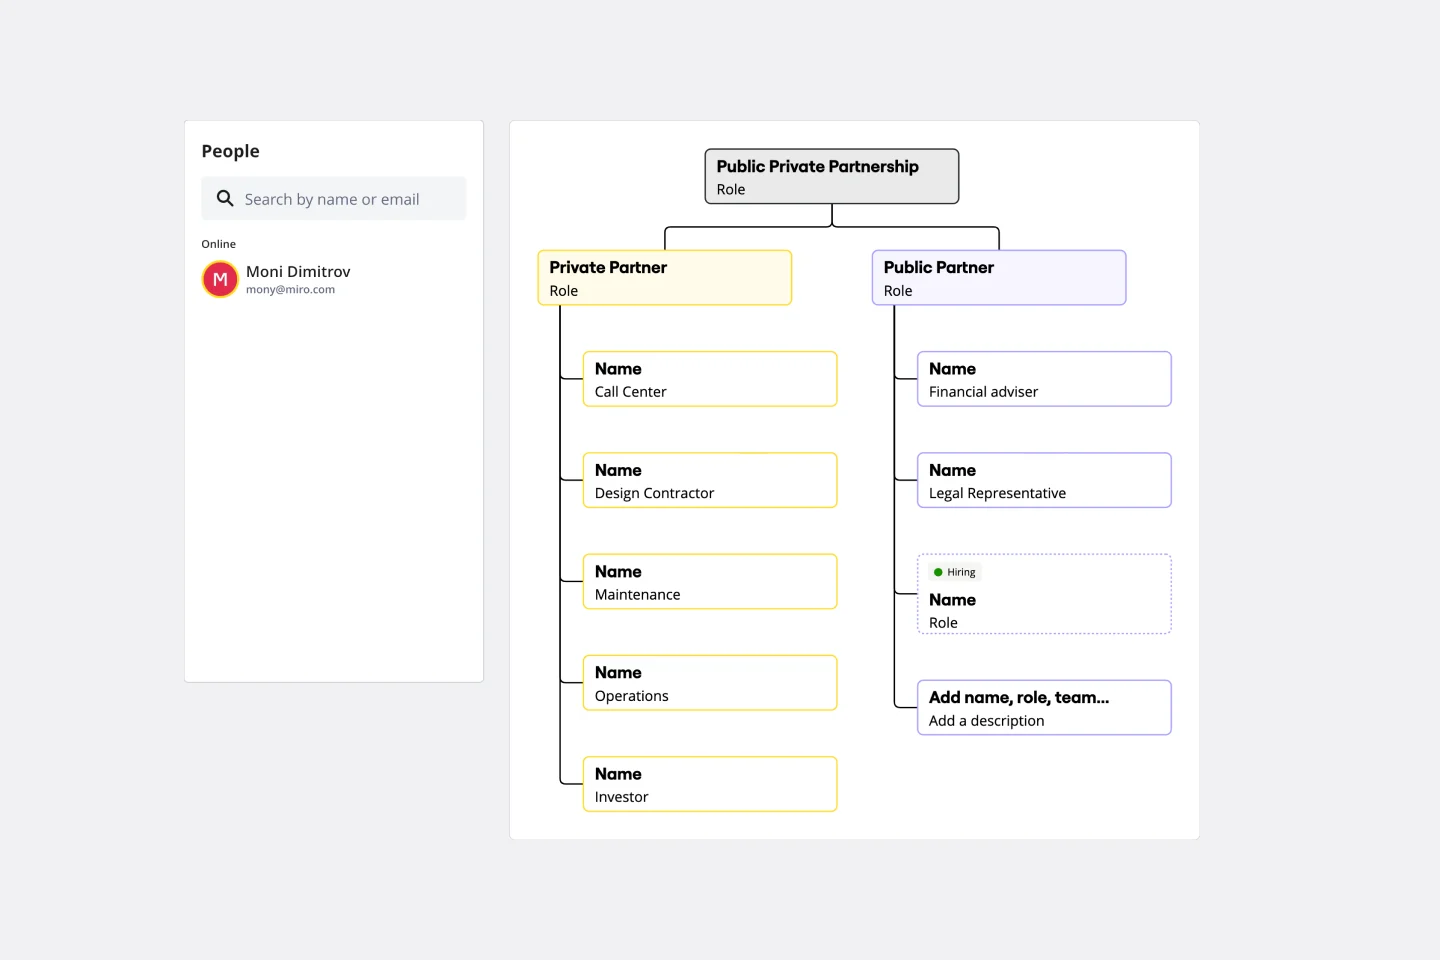
Partnership Org Chart Template
Works best for:
Org Charts, Organizational Design
The Partnership Org Chart Template is an interactive tool that visually represents the intricate network of relationships between business partners. It provides a clear and structured layout that helps users grasp how different entities align and interact within a collaborative ecosystem. One of its standout benefits is the clarity it offers. In the often complex world of inter-organizational relationships, having a straightforward, visual representation of partnerships eliminates ambiguities and ensures all stakeholders are on the same page. This fosters more effective collaboration and strategic planning, making it an essential business tool.