Organizational Chart Template
Visualize roles in your organization and the reporting relationships between them using an Organizational Chart Template. Quickly onboard new team members and bring clarity to teams.
About the Organizational Chart Template
Miro’s organizational chart template is a ready-to-use diagram for leaders and managers to visualize an organization’s structure. That includes the members, the various teams and departments they belong to, and the relationships between them.
An organizational chart – also known as an org chart – comes in handy, especially when companies grow rapidly, as it gets more challenging to keep track of changes in hierarchies and leadership. It also helps everyone stay informed on the company’s structure, team interdependencies, and how cross-functional collaborations happen.
Creating your own chart is easy using Miro’s free org chart template. In the next section, we’ll walk you through how to fill in and customize the organizational chart template.
How to use the organizational chart template
Building an org chart is easy with Miro’s template. Get started by clicking on the blue “use template” button on this page. That’ll allow you to open the organizational chart template in Miro. When you’re in, here are a few steps you can take to set yourself up for success:
1. Define the scope
Like any project you work on, it’s important to define the scope before jumping in. Think about what you hope to use the org chart for, where it will live, and who needs access to it. Asking these questions early on will help you identify the purpose of your chart and the information you need to fill out the org chart template.
It’s also worth asking yourself if you’ll need more than one chart to visualize different levels of the company. In that case, you can easily duplicate the organizational chart template. You can even select all the elements within the org chart template and duplicate them on the same canvas if you’d like to keep everything in one Miro board. Just be sure to label them.
2. Gather information
The next step is to gather information to populate the organizational chart template — members’ names, their roles, what teams and departments they belong to, and how they connect to each other. Depending on the level of detail you’re going for, you might also need headshots of everyone. Reach out to your HR team or conduct a survey within your organization to find what you’re looking for. It’s also worth making sure that all the information you get is up-to-date.
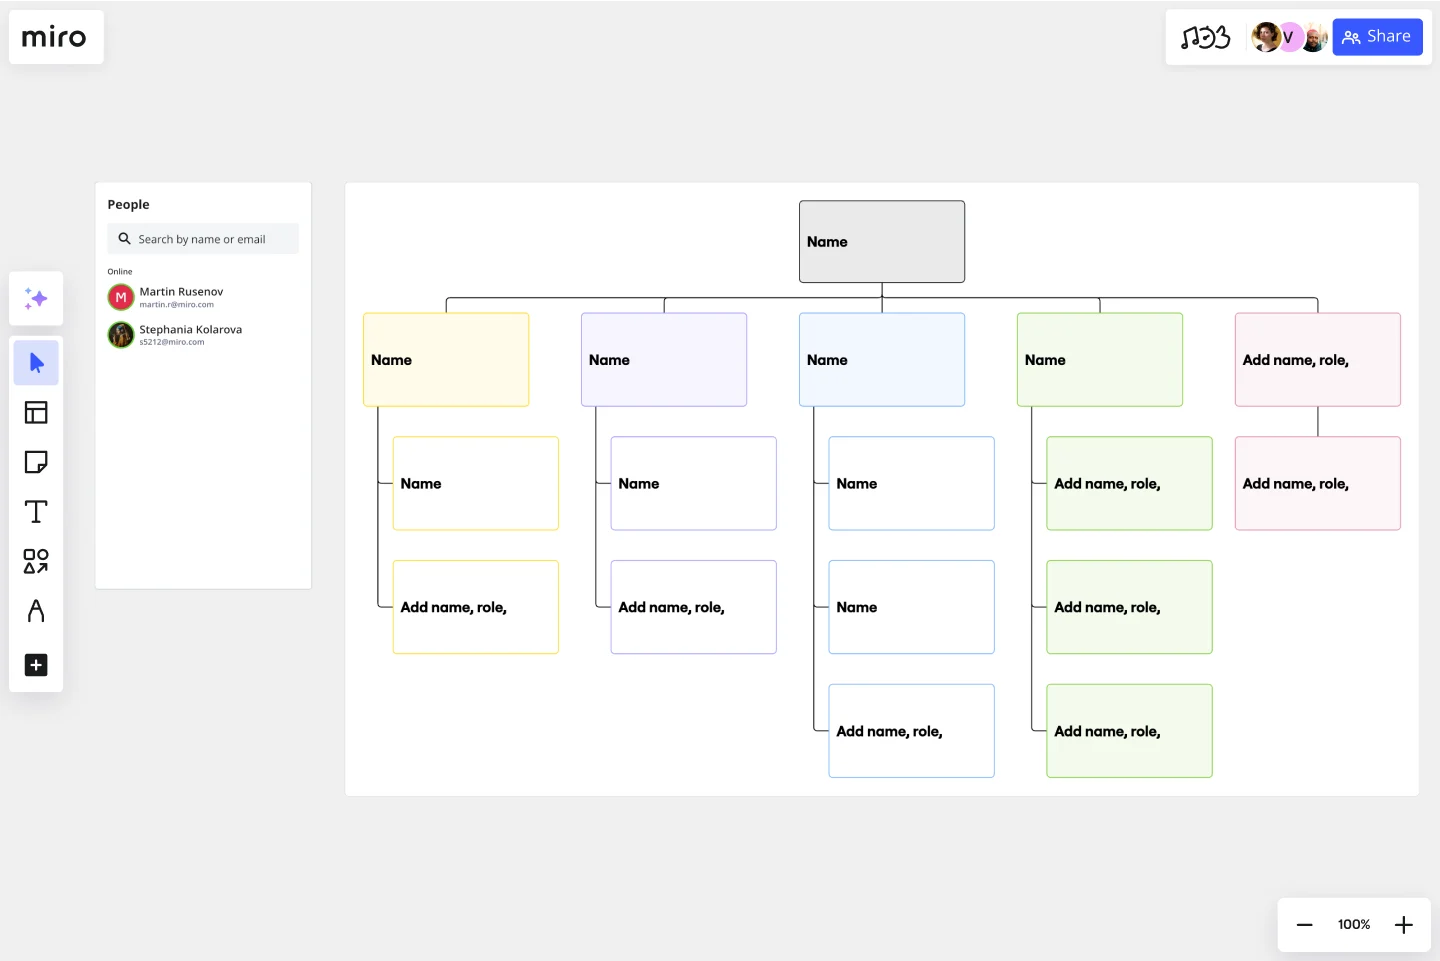
3. Fill in the roles
The organizational chart template comes with pre-made cards. Double-click on any card to start editing it so you can replace the pre-written text with your own. Add names, roles, and any other important information you’d like the card to show upfront. Expand on the card to add any other important details you want to include, such as their email address. Just make sure you’re not sharing anything private.
Alternatively, you can replace the cards with shapes and use text boxes to write down details. If you’d like to add images, drag and drop your files right onto the canvas and move them around as needed.
4. Map out connections between roles
The organizational chart template also comes with pre-made connection lines. These represent the relationships between individuals, teams, and departments. They also visualize hierarchies among roles. To adjust the direction or flow of these lines, click and drag them to where you want them to go. You can also duplicate or remove any connection lines as needed.
5. Customize the template
Customize any elements you’d like, changing the sizes, shapes, and colors to align with your company’s branding style. You may also want to use colors or shapes to indicate levels of authority or different departments. You can also invite your coworkers to collaborate with you online in real-time or have them view your completed org chart template when it’s ready and leave their feedback with comments.
Benefits of an organizational chart template
An organizational chart template makes it easy to visually represent everyone’s job titles and departments — saving you time from having to create an org chart from scratch. But the benefits go beyond getting to share this information quickly. Here are a few key advantages of using an org chart template:
Onboard new hires
By visualizing each role in the organization and who everyone reports to, org charts serve as a clear point of reference for new hires. It helps them quickly learn about who their core team members are, what departments they’ll likely work with, and who the organization’s leaders are.
Manage headcount
An up-to-date org chart helps leaders keep track of current team members — including who’s recently left or joined. This helps them stay on top of headcount, which can help inform decisions about whether they need to hire new employees to manage workload.
Compliance
In some industries, an organizational chart serves as documentation for legal and compliance reasons. Miro’s organizational chart template comes with pre-made cards and connection lines, allowing you to focus on filling in important information and customizing it as you need to.
Is the organizational chart template free to use?
Yes, Miro’s organizational chart template is free, allowing you to start filling it in and making it your own.
Can I edit my completed org chart template?
Yes, you can easily make changes to your org chart template anytime, whether you’re logged in from your desktop, smartphone, or tablet.
How should I structure an organizational chart?
The most traditional way to visualize an organization is using a top-down structure, with C-suite executives at the top of the chart. You might also want to group employees according to product lines and geographies. Other structures include a matrixed organization chart where teams are divided into projects and products, and a flat organizational chart where hierarchies are non-existent and teams are self-managed.
Get started with this template right now.
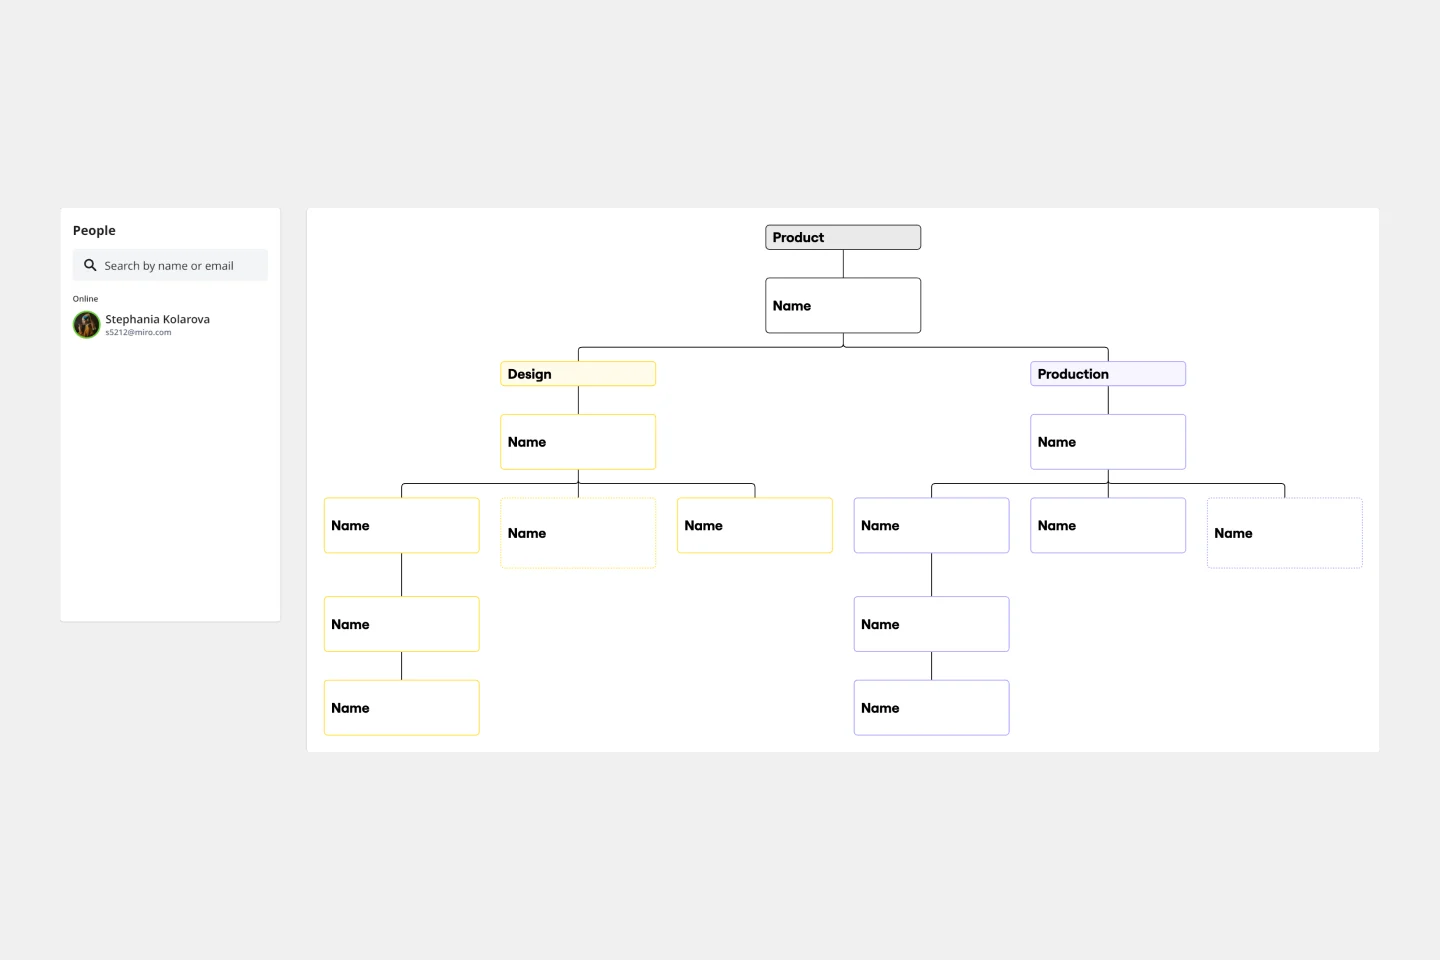
Business Organizational Chart Template
Works best for:
Leadership, Org Charts, Operations
Establishing hierarchy in a business can empower employees—to know their roles and responsibilities, team members, potential cross-functional collaborators, and who to turn to with a specific need. That’s just what a Business Organizational Chart does. And this template makes it simple to build a BOC for your company. The first step is to determine the high-level organizational structure of your company. Then it's easy to create a visual representation of how different employees are interconnected.
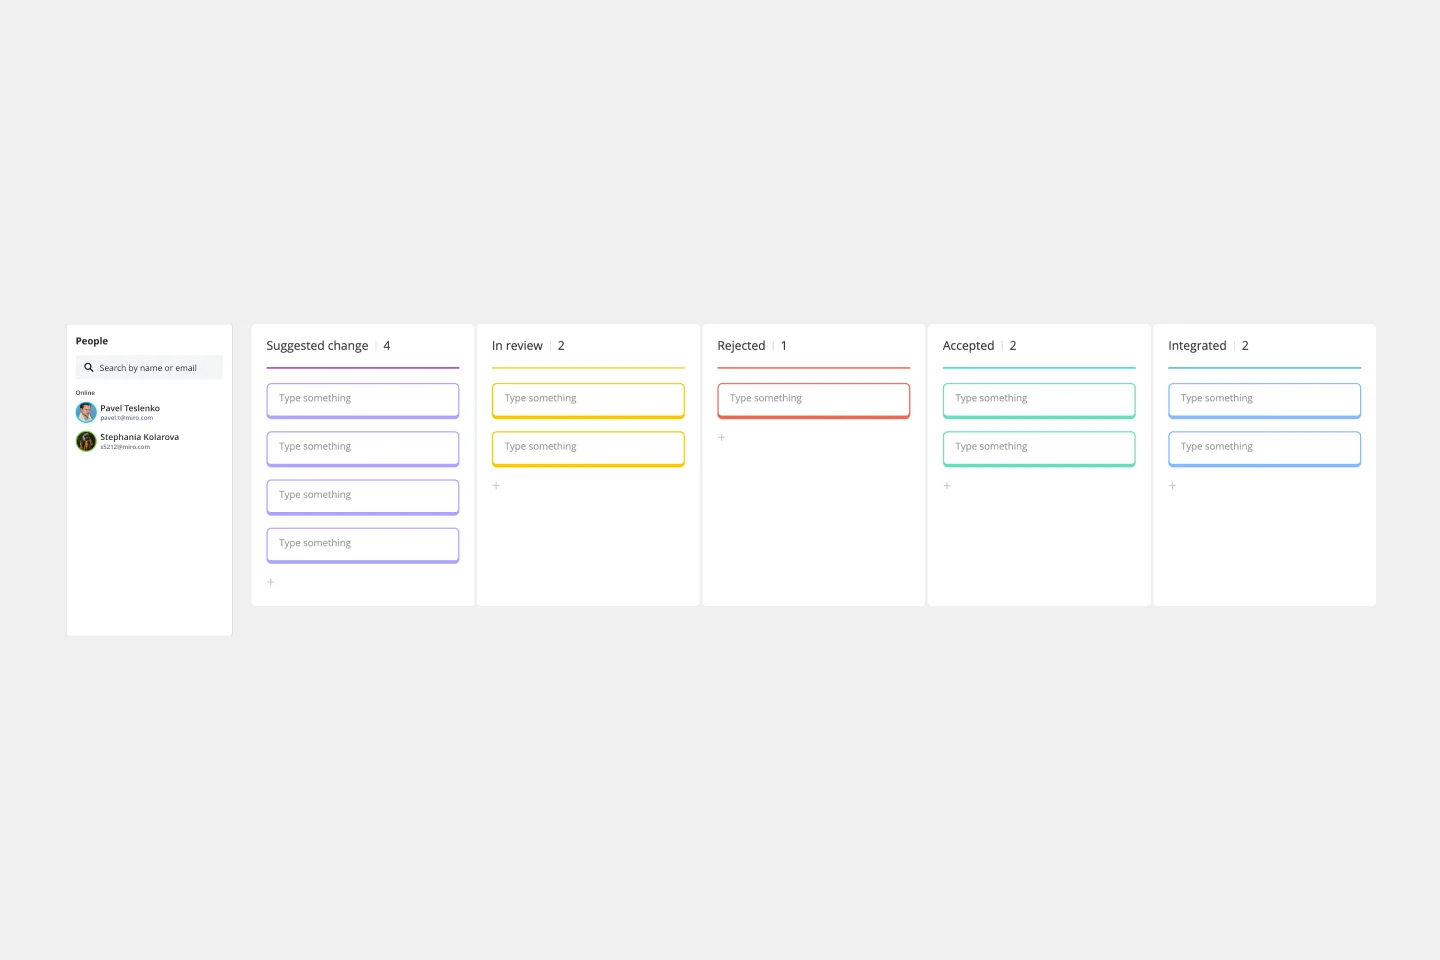
Change Control Process Template
Works best for:
Agile Methodology, Documentation, Product Management
You can predict, research, and plan for every detail of a project to go a certain way—then along comes the unforeseen and modifications are needed. That’s when a change control process comes into play. It helps define the right steps to take, gives stakeholders full visibility, and reduces the chances of errors and disruption. And this template is easy to use and highly effective—for ensuring that proposed changes are reviewed before they’re implemented, and empowering teams to veto changes that might prove unnecessary or disruptive.
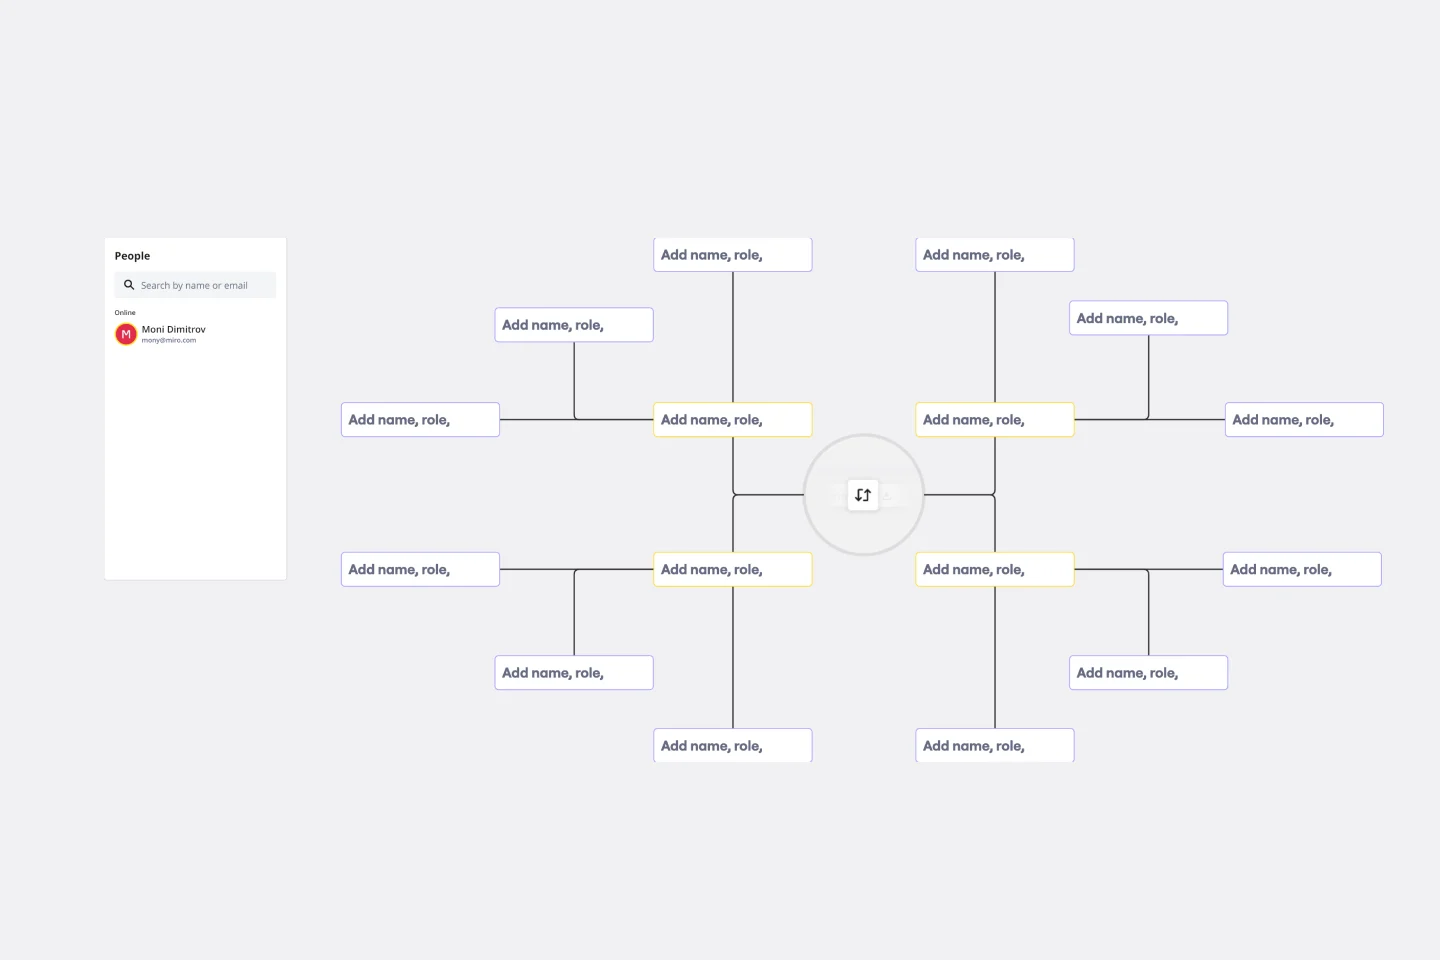
Circular Org Chart Template
Works best for:
Organizational Chart
The Circular Org Chart Template is an innovative solution that helps represent and visualize complex organizational structures with ease. The key advantage of this template is its ability to present complex hierarchies in a visually appealing and easy-to-understand format. By adopting a circular arrangement, the template provides a comprehensive and holistic view of the organization, making it effortless for teams to comprehend reporting relationships at a glance. The visual clarity offered by this template fosters efficient communication and decision-making, offering a seamless experience for teams to understand their organizational structure. The template's intuitive design and emphasis on visual representation significantly enhance transparency, promoting a deeper understanding of organizational roles and relationships.
Funding Tracker Template
Works best for:
Kanban Boards, Operations
For many organizations, especially non-profits, funding is their lifeblood—and meeting fundraising goals is a crucial part of carrying out their mission. A funding tracker gives them a powerful, easy-to-use tool for measuring their progress and staying on course. And beyond helping you visualize milestones, this template will give you an effective way to inspire the public to donate, and help you keep track of those donors. It’s especially useful when you have multiple donations coming from a variety of sources.
Impact Mapping Template
Works best for:
Agile Methodology, Mapping, Agile Workflows
When you’re building products and shipping goods (oh, and everything in between) there’s nothing more important than staying organized and on-task. Impact mapping is a great way to do it. This trusty product planning technique creates a graphical representation of all your goals and the steps it’ll take to reach each one — so you can clearly communicate with your teammates, align on business objectives, and build better roadmaps. Our template will help you do impact mapping for any type of project planning.
Work Breakdown Structure Template
Works best for:
Project Management, Mapping, Workflows
A work breakdown is a project management tool that lays out everything you must accomplish to complete a project. It organizes these tasks into multiple levels and displays each element graphically. Creating a work breakdown is a deliverable-based approach, meaning you’ll end up with a detailed project plan of the deliverables you must create to finish the job. Create a Work Breakdown Structure when you need to deconstruct your team's work into smaller, well-defined elements to make it more manageable.