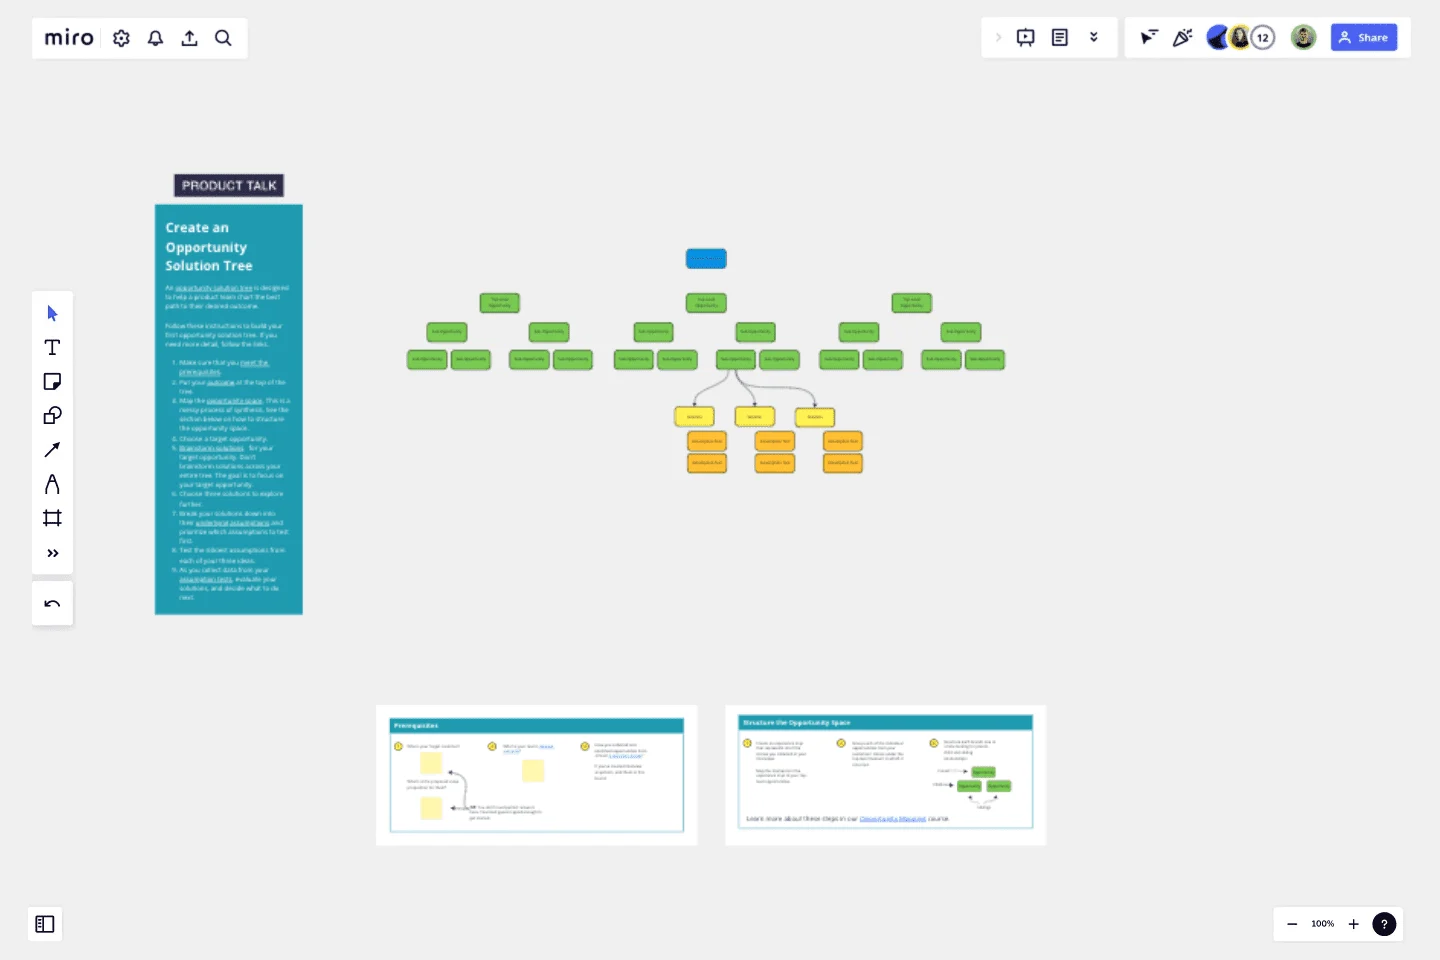
Opportunity Solution Tree
An opportunity solution tree helps a product team chart the best path to their desired outcome—ensuring their proposed solutions address customers' needs in a way that drives business value.
This template includes step-by-step instructions for how to create your first opportunity solution tee. You'll start with a clear outcome, map the opportunity space, choose a target opportunity, brainstorm solutions, and identify assumption tests. Opportunity solution trees help you manage the messy cycles of product discovery. Get started today.
This template was created by Teresa Torres.
Get started with this template right now.
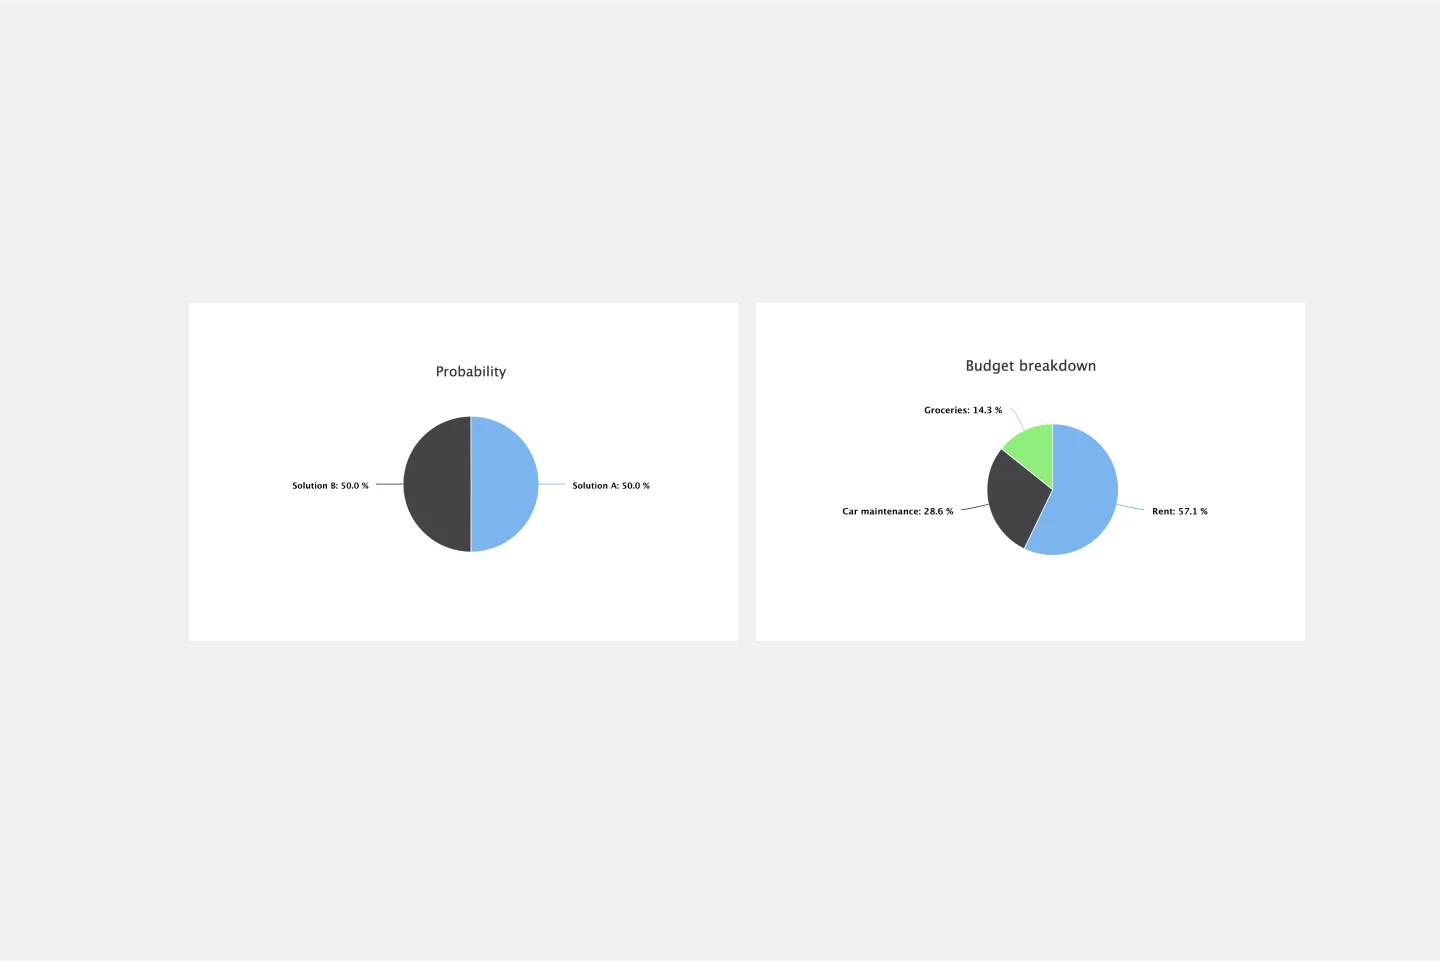
Pie Chart Template
Works best for:
Education, Operations
Pie charts are an excellent way to present relationships between datasets graphically, where you can quickly compare information and see contrast right away. Professionals from many fields use pie charts to support their presentations and enrich their storytelling as it’s one of the most commonly used data charts.
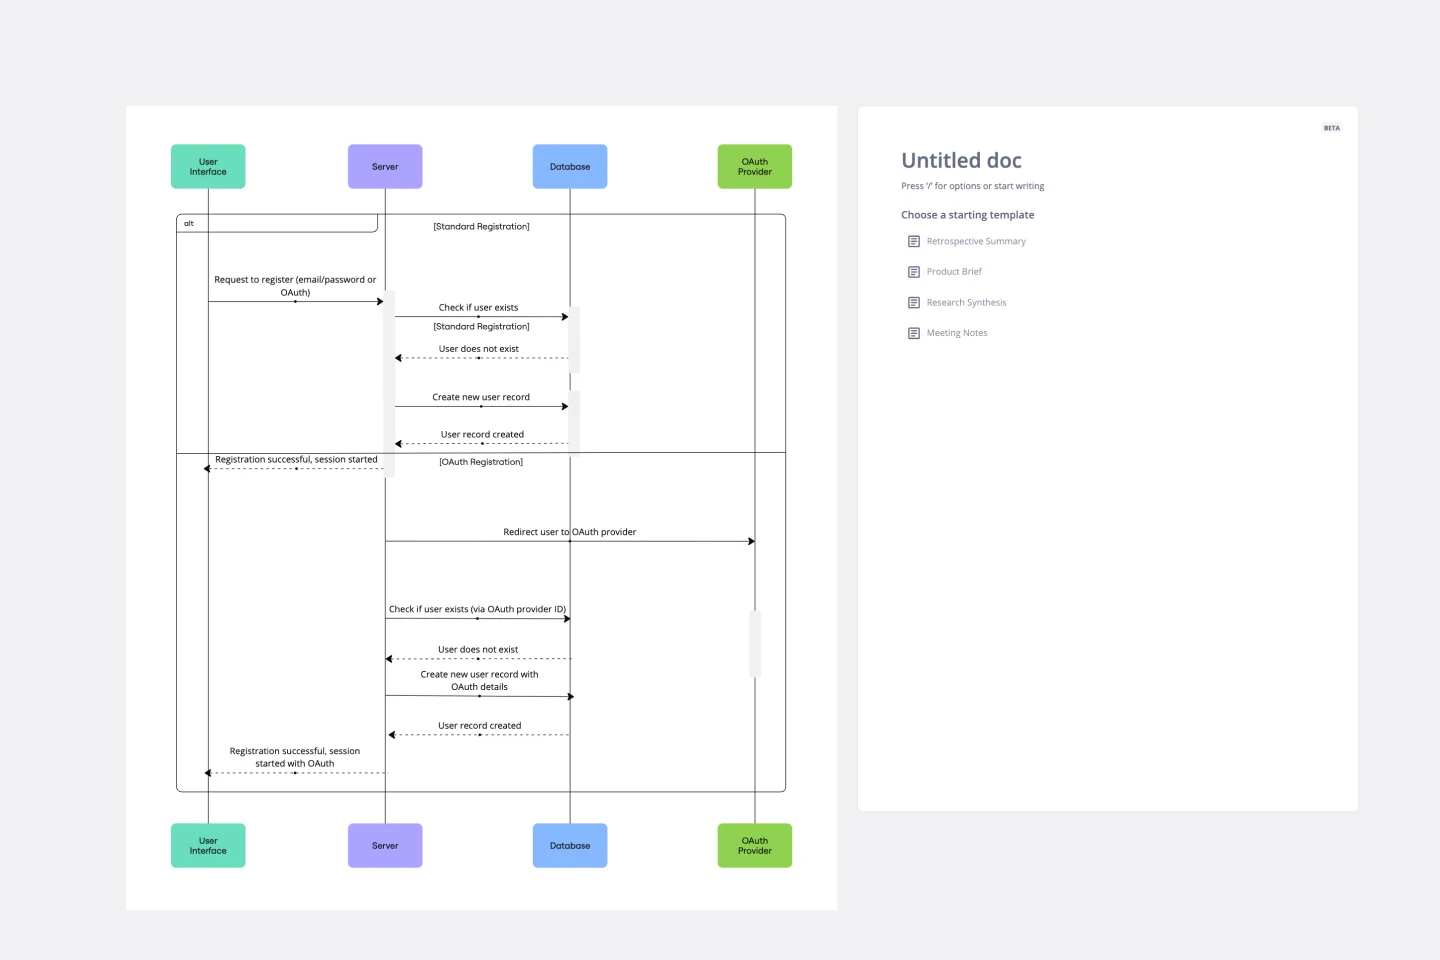
UML Sequence Registration Process Template
Works best for:
UML
The UML Sequence Registration Process Template helps visualize and document user registration processes. It enables the rapid creation of sequence diagrams, which are crucial for enhancing clarity and identifying potential issues early in the design phase. This template not only supports collaborative efforts through Miro's platform, facilitating real-time teamwork, but also ensures a comprehensive system design. Being part of a broader collection of UML diagram templates, it stands as a valuable asset for projects involving registration workflows, contributing to streamlined project execution and effective communication among team members.
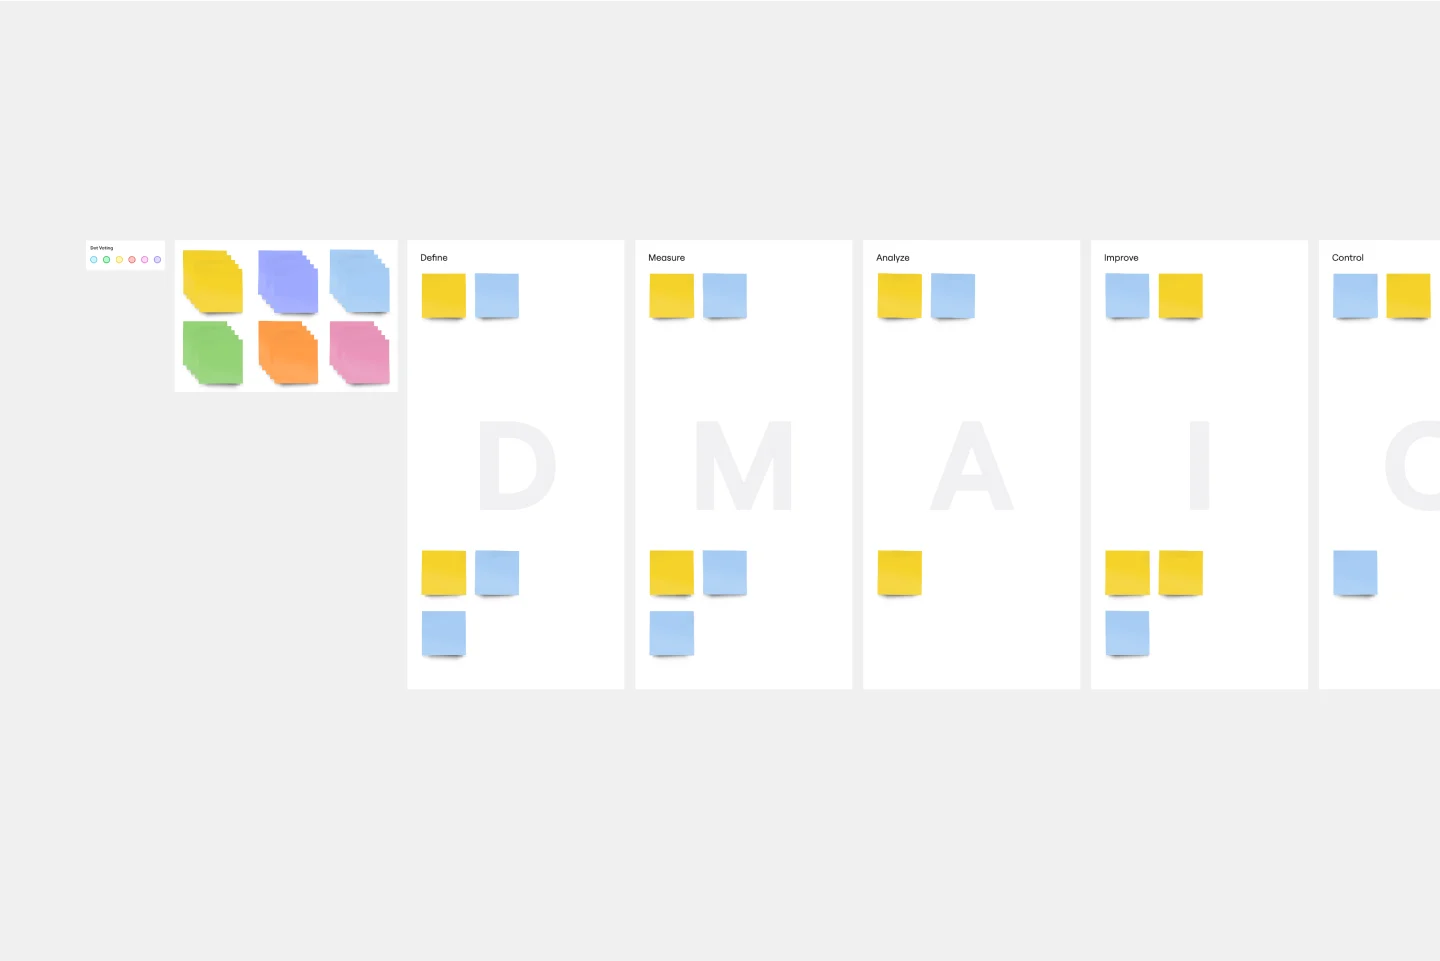
DMAIC Analysis Template
Works best for:
Agile Methodology, Design Thinking, Operations
Processes might not seem like the funnest thing to dive into and examine, but wow can it pay off—a more efficient process can lead to serious cost savings and a better product. That’s what DMAIC analysis does. Developed as part of the Six Sigma initiative, DMAIC is a data-driven quality strategy for streamlining processes and resolving issues. The technique is broken into five fundamental steps that are followed in order: Define, Measure, Analyze, Improve, and Control.
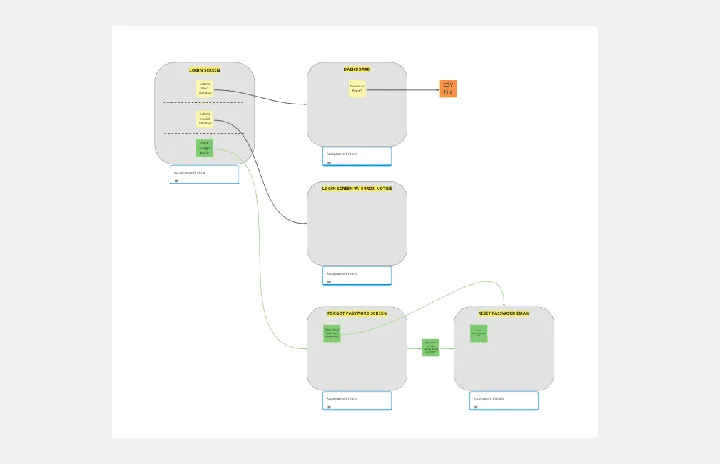
Breadboard (UI Flow Diagram)
Works best for:
Diagramming
The Breadboard (UI Flow Diagram) template offers a visual framework for designing and prototyping user interfaces (UIs) using the breadboard method. It provides elements for arranging UI components and defining user interactions. This template enables designers and developers to create interactive UI prototypes quickly and iteratively, facilitating user testing and feedback. By promoting rapid prototyping and experimentation, the Breadboard (UI Flow Diagram) empowers teams to design intuitive and user-friendly digital experiences effectively.
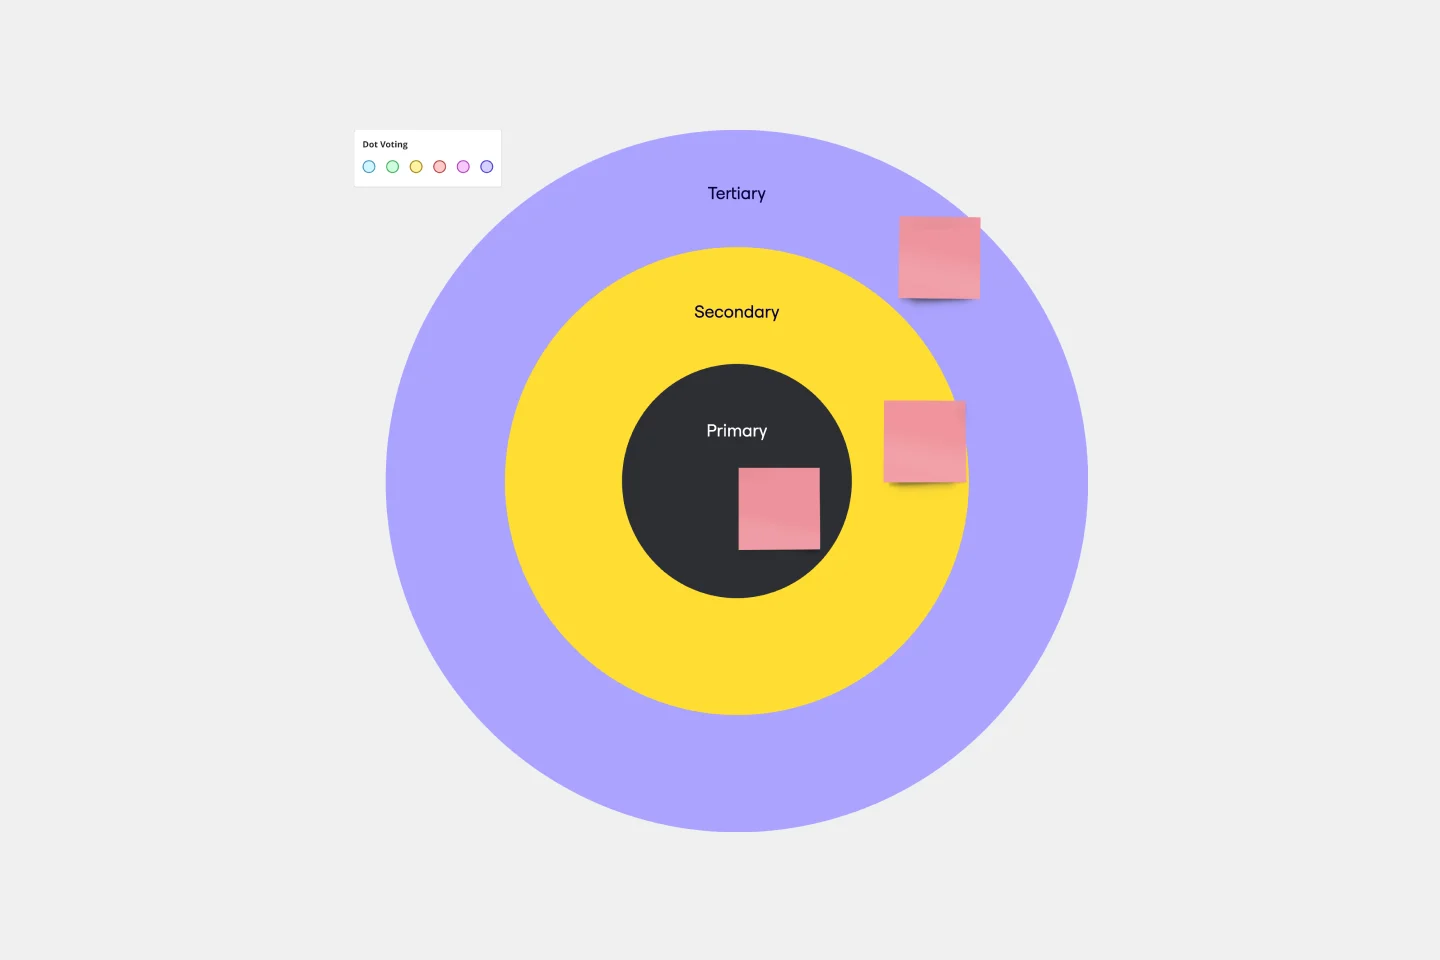
Bull's Eye Diagram Template
Works best for:
Diagrams, Project Management, Prioritization
When you’re a growing organization, every decision can feel like it has make-or-break consequences—which can lead to decision paralysis, an inability to prioritize, inefficient meetings, and even low morale. If that sounds like you, put a Bull’s Eye Diagram to work. True to its name, a Bull’s Eye Diagram uses a model of concentric circles to help companies establish priorities, make critical decisions, or discuss how to remove or overcome obstacles.
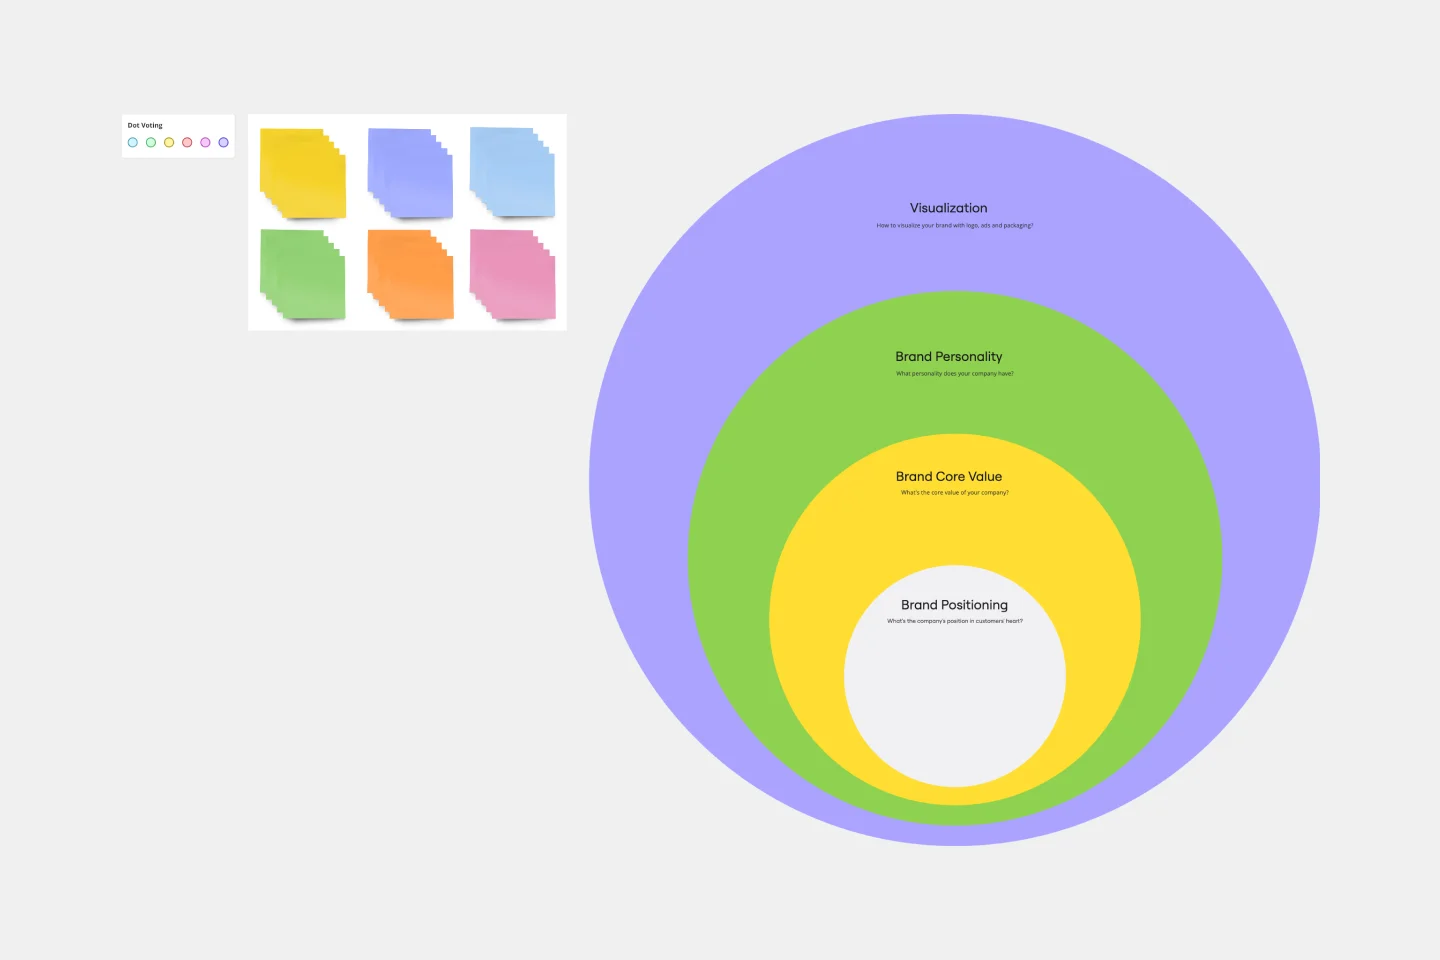
Onion Diagram Template
Works best for:
Diagramming, Mapping and Diagramming
The Onion Diagram Template is a distinct tool designed to visually represent layers of a specific concept, system, or process, akin to the layers of an onion. Each concentric layer of the diagram provides insights into a different aspect or phase of the topic at hand, moving from the core foundational element outwards to more peripheral components. One of the prime benefits of this template is its ability to offer hierarchical clarity. Users can immediately discern the importance, sequence, or interrelation of different elements within a system, facilitating enhanced comprehension and efficient decision-making.