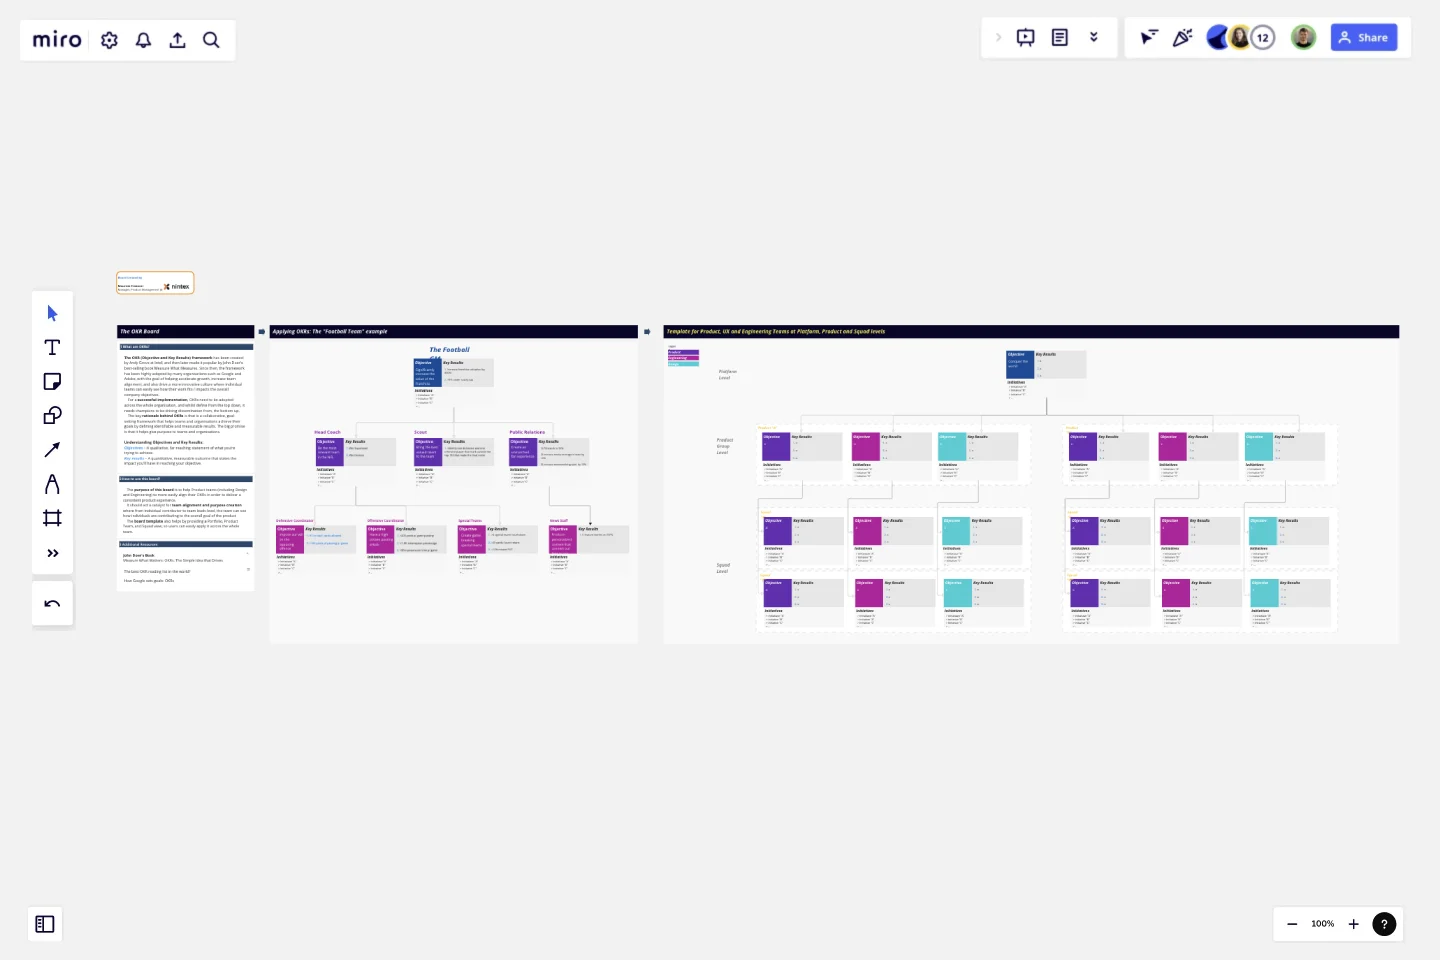
OKR Board for Product, UX and Engineering Teams
The OKR (Objective and Key Results) framework has been created by Andy Grove at Intel, and then later made it popular by John Doer's best-selling book Measure What Measures.
The framework has been highly adopted by many organisations such as Google and Adobe, with the goal of helping accelerate growth, increase team alignment, and also drive a more innovative culture where individual teams can easily see how their work fits / impacts the overall company objectives.
For a successful implementation, OKRs need to be adopted across the whole organisation, and whilst define from the top down, it needs champions to be driving dissemination from, the bottom up.
The key rationale behind OKRs is that is a collaborative, goal-setting framework that helps teams and organisations achieve their goals by defining identifiable and measurable results. The big promise is that it helps give purpose to teams and organisations.
The purpose of this board is to help Product teams (including Design and Engineering) to more easily align their OKRs in order to deliver a consistent product experience.
It should act a catalyst for team alignment and purpose creation where from individual contributor to team leads level, the team can see how individuals are contributing to the overall goal of the product.
The board template also helps by providing a Portfolio, Product Team, and Squad view, so users can easily apply it across the whole team.
This template was created by Mauricio Franzoni.
Get started with this template right now.
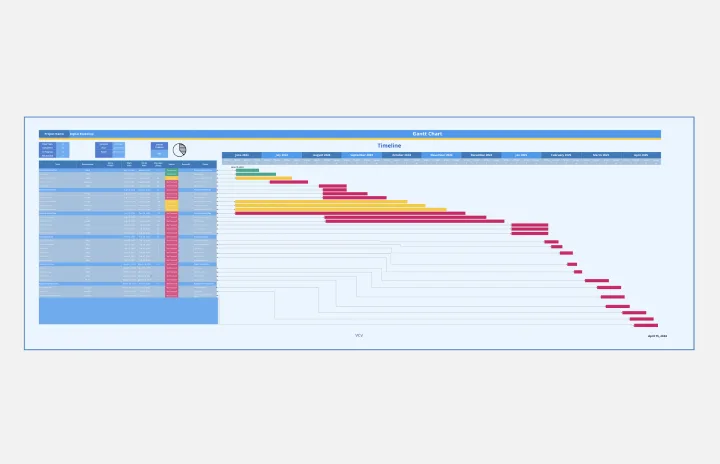
Gantt Chart Project
Works best for:
Strategy, Planning
The Gantt Chart Project template is a versatile tool for managing various types of projects. It provides a clear visual timeline of your project's tasks, deadlines, and dependencies. Use it to plan, execute, and monitor your project's progress, ensuring all activities are aligned and on track. This template enhances team collaboration, improves time management, and helps address potential bottlenecks for successful outcomes.
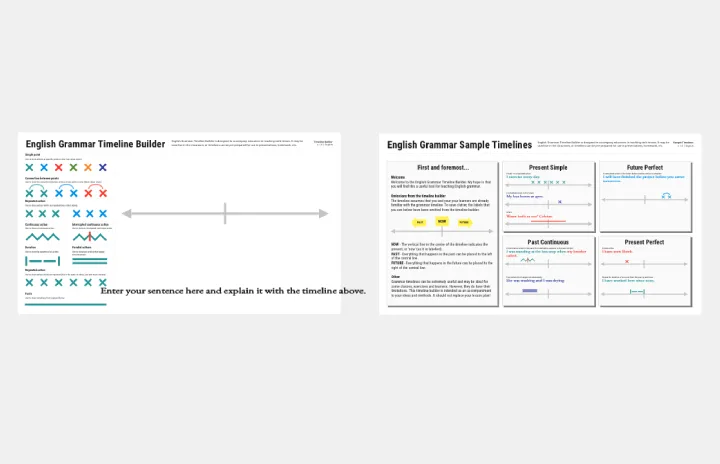
English Grammar Timeline Builder
The English Grammar Timeline template helps you map out the progression of grammar concepts over time. This is a great tool for educators and students to visualize the sequence and relationship between different grammar topics, making learning and teaching more effective.
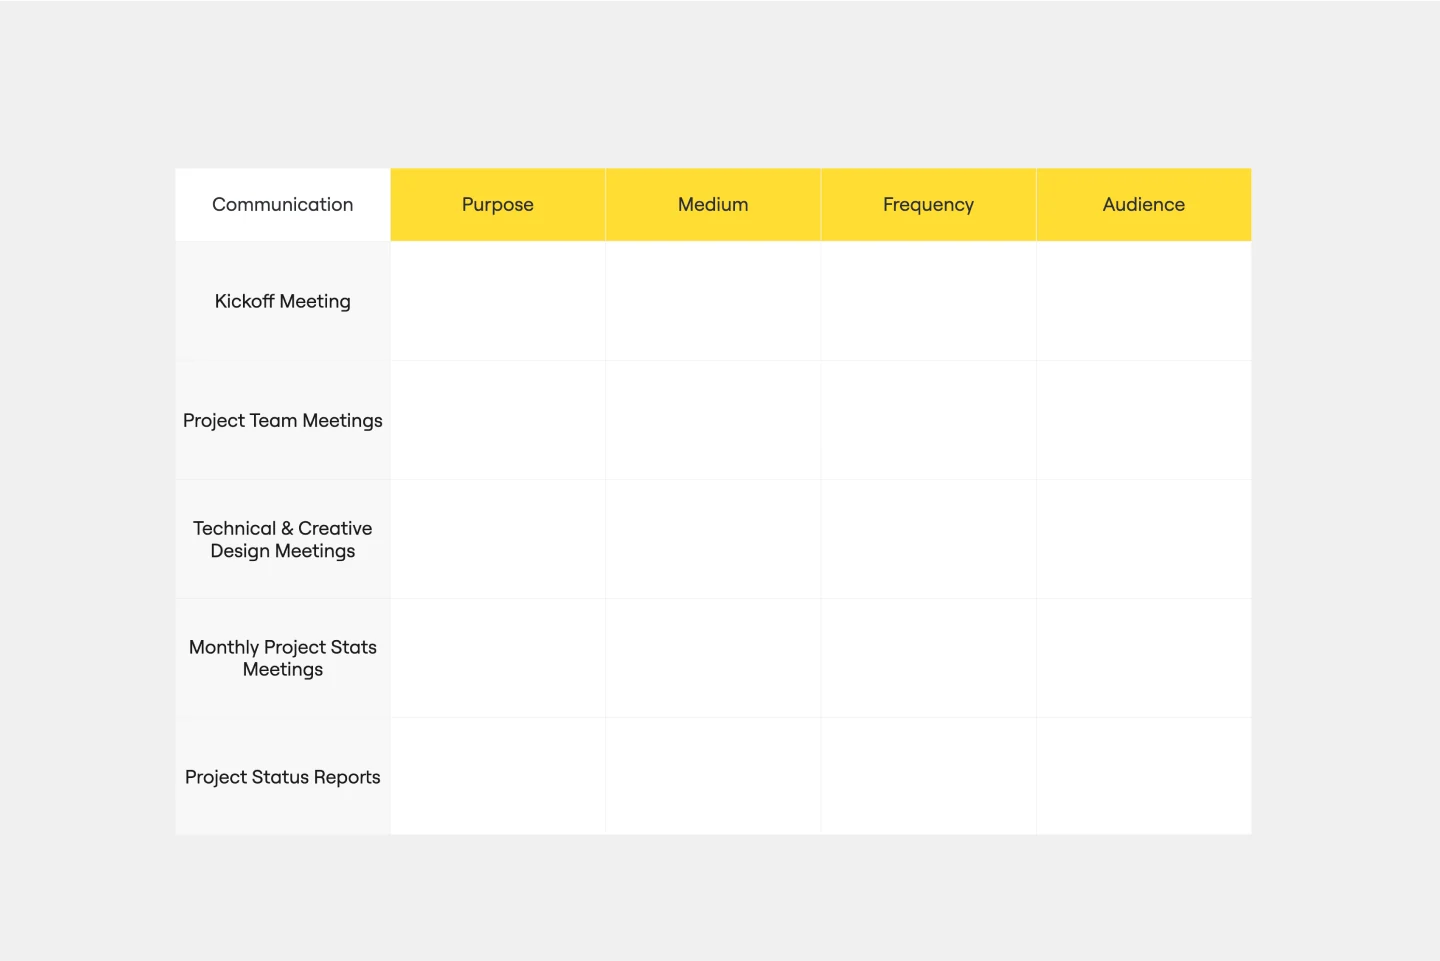
Communication Matrix Template
Works best for:
Project Management, Project Planning, Meetings
The Communication Matrix Template serves as a structured framework for businesses and projects to streamline their communication strategies. By mapping out types of communication, their purposes, mediums, frequencies, and intended audiences, the template ensures that every stakeholder remains informed and aligned. One of its key benefits is the enhanced clarity it brings. By laying out the specifics of each communication touchpoint, the matrix eliminates ambiguity, ensuring that all involved parties know exactly what to expect and when leading to more efficient collaboration and fewer misunderstandings.
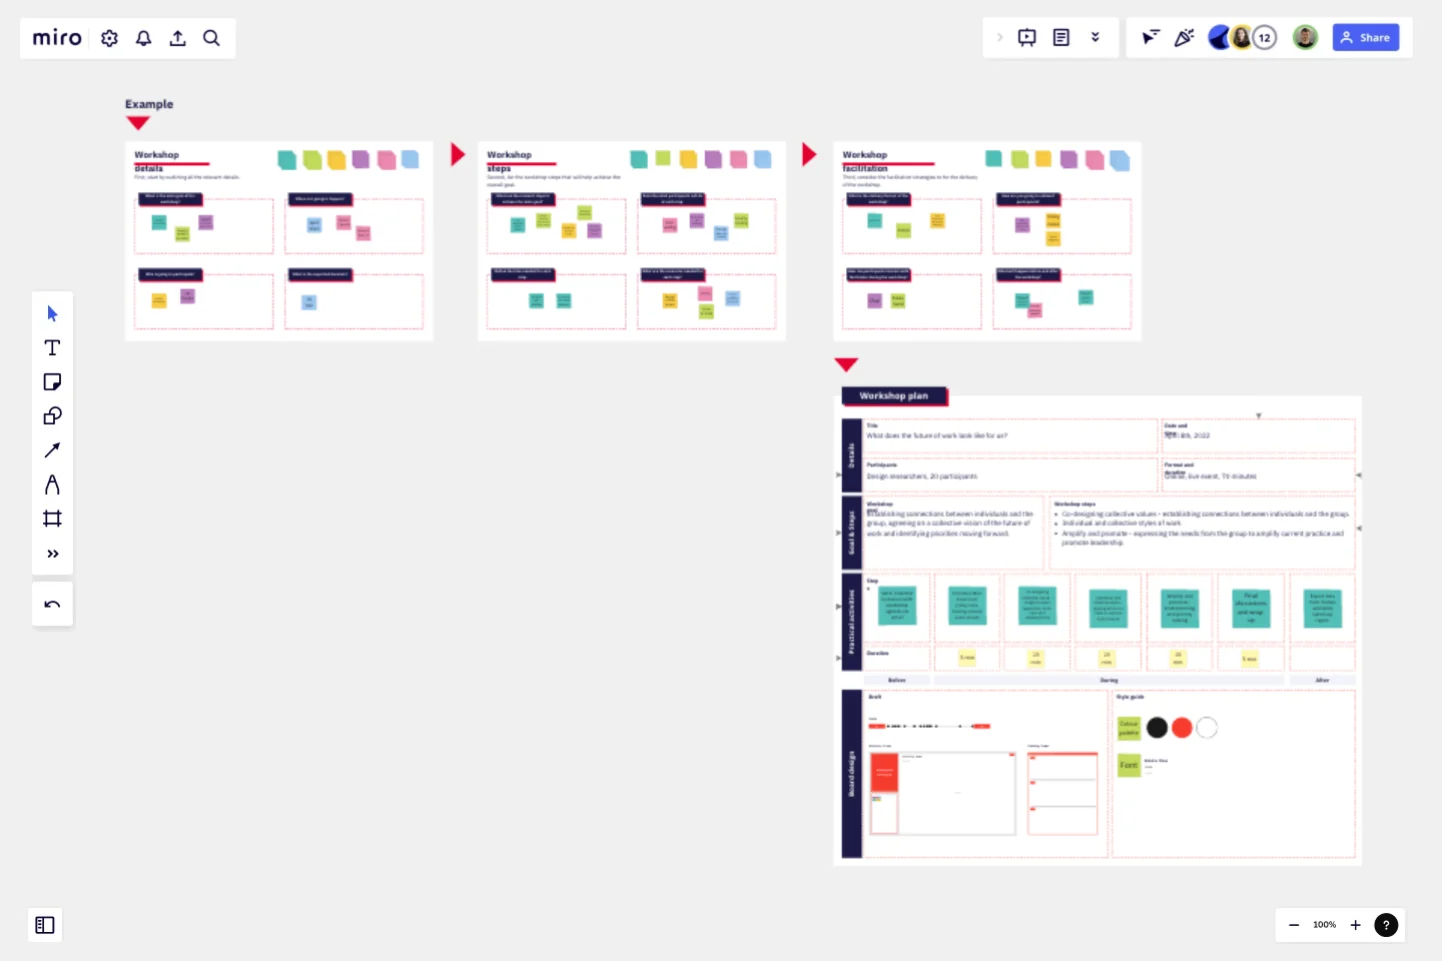
Workshop Planner
Works best for:
Planning, Strategy
Workshop Planner template helps you organize and plan effective workshops. It allows you to outline activities, set timelines, and allocate resources, ensuring your workshops run smoothly and achieve their objectives.
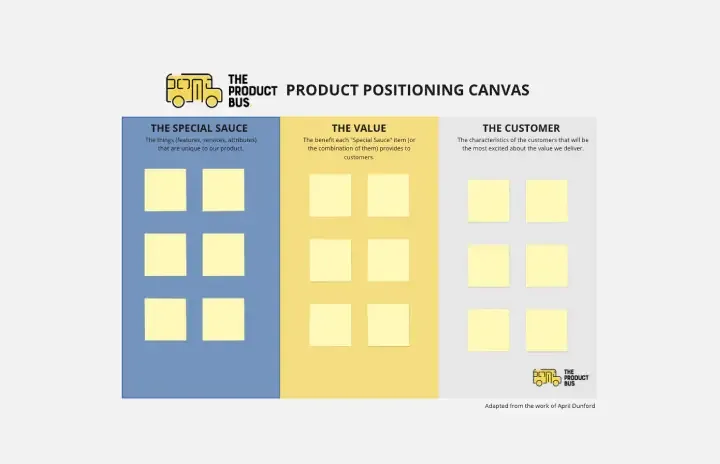
Product Positioning Canvas
Works best for:
Product Management, Planning
The Product Positioning Canvas template aids product managers in defining and communicating product positioning strategies. By analyzing target markets, competitive landscapes, and unique value propositions, this template helps differentiate products in the market. With sections for defining brand attributes, messaging, and market segments, it enables teams to craft compelling positioning statements that resonate with target audiences. This template serves as a guide for aligning product positioning with business objectives and driving market success.
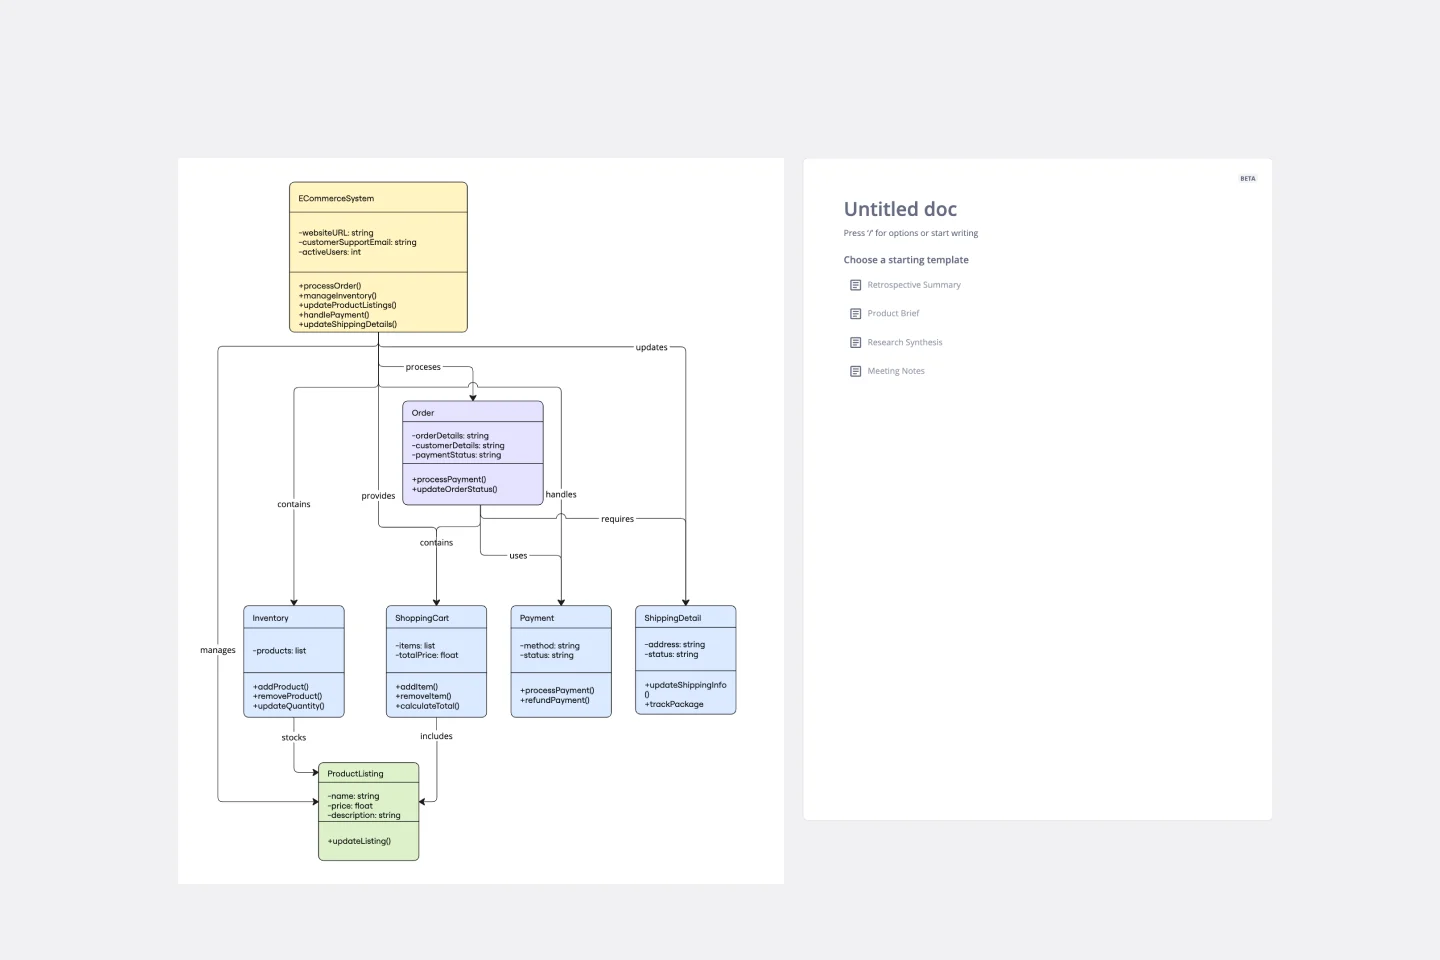
UML Class E-Commerce System Template
Works best for:
UML
The UML Class E-Commerce System Template streamlines the process of creating and visualizing the class structure of an e-commerce system. It provides a comprehensive framework that includes typical online shop features such as product listings, inventory management, shopping carts, orders, payments, and shipping details. This template facilitates a clear understanding of how these elements interact during an online sales transaction, making it an invaluable tool for teams working on e-commerce projects. By using this template, teams can save time, enhance collaboration, and ensure that their system architecture is robust and efficient, ready to adapt to their business's evolving needs.