Login Sequence Diagram Template
Visualize complex login processes, ensuring effective team collaboration and clear documentation with the login sequence diagram template.
About the Login Sequence Diagram Template
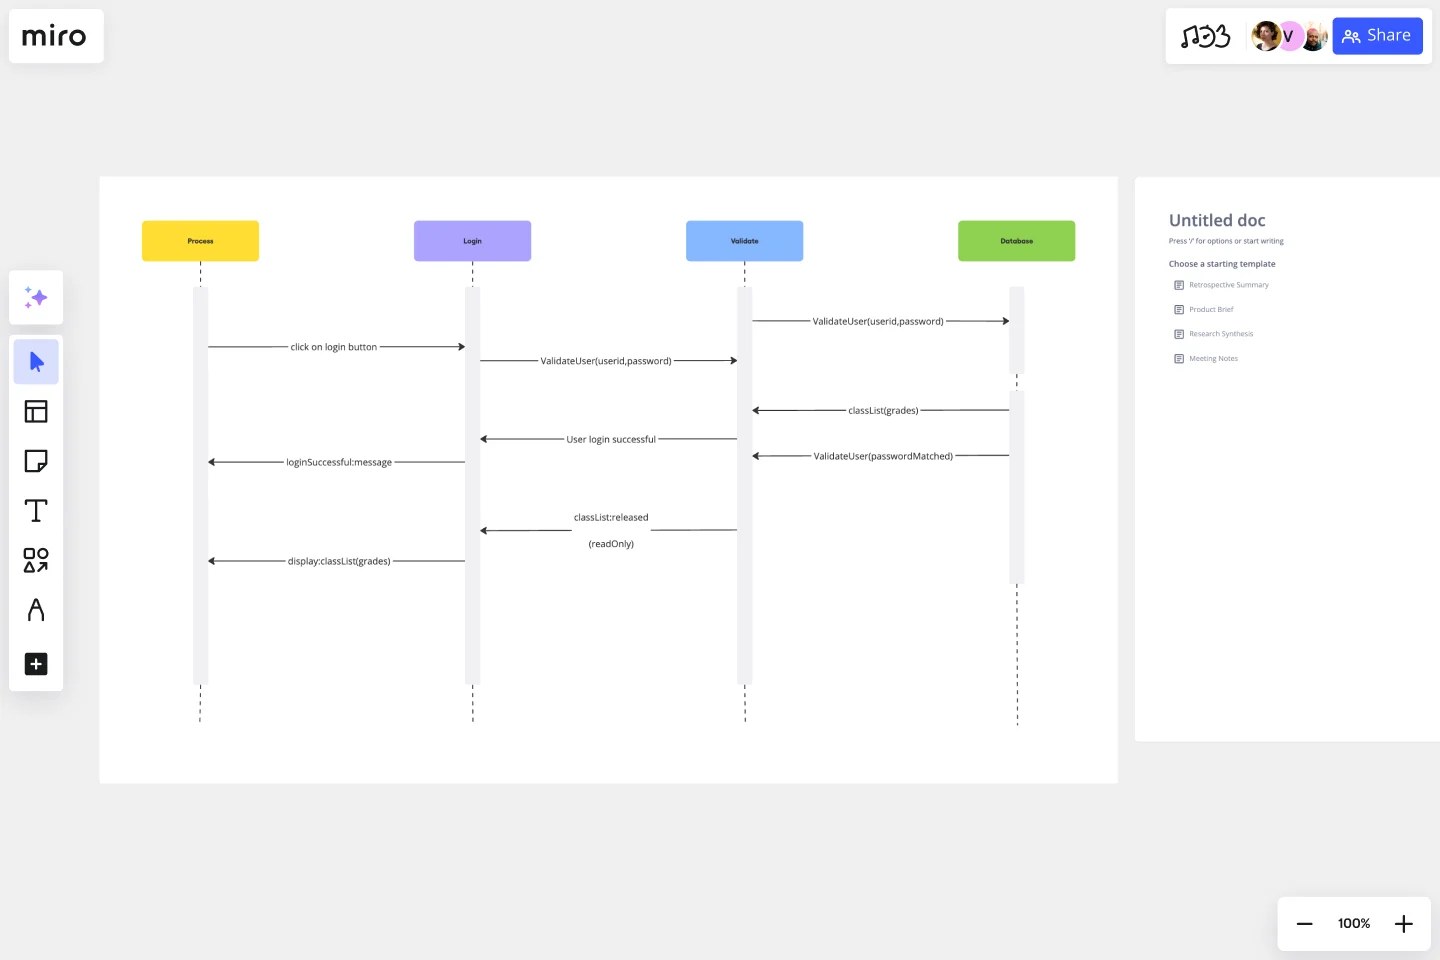
Understanding the user authentication process is crucial for any team optimizing their authentication protocols. That's where the login sequence diagram template comes into play. Sequence diagrams present a clear and dynamic view of how systems and users interact during the login sequence, making it an invaluable resource for planning and troubleshooting authentication protocols.
The login sequence diagram template defines each component involved in the login process, including the user, the user interface, and backend services. It aims to guide the representation of interactions that occur over time during the login process, allowing users to easily trace how and when these components interact, from the initial login request to the final authentication outcome. This framework streamlines capturing these exchanges, making it easier to adapt to specific login sequence nuances and optimize their authentication process.
How to use the login sequence diagram template in Miro
Using the template is a straightforward process:
Customize the components: Click on each element to edit text, allowing the naming of actions and actors to reflect your specific login process. If you want to create the login sequence diagram directly from code, access the PlantUML app.
Incorporate additional artifacts: Drag and drop any related artifacts onto the board to provide context. Whether it's additional notes, images, or documents, these can be easily integrated within the vicinity of your sequence diagram for comprehensive understanding.
Why should you use a login sequence diagram template?
The use of a login process template offers several benefits to a team during software development:
Clear communication: A login process template provides teams with a clear visual representation of complex processes, making communication easier.
Early error identification: Using a template, potential errors in the login sequence can be easily identified and rectified early on in the development cycle.
Efficient collaboration: Team members can collaborate in real-time using the template, reducing misunderstandings and accelerating consensus.
Scalability: The template can be effortlessly extended to accommodate additional scenarios or more detailed sequences as projects expand.
Integration with documentation: The login process template can be incorporated into technical documentation, ensuring consistency across project artifacts and serving as an excellent reference point.
Miro also has a sequence diagram template that you can use for other types of sequence diagrams. If you'd prefer to create one from scratch, Miro's diagramming capabilities and UML shape packs make it the perfect sequence diagram tool no matter your needs.
Can the login sequence diagram template handle multiple authentication scenarios?
Absolutely. The template is designed to be versatile and can be customized to represent a variety of authentication mechanisms, including multi-factor authentication.
Is technical expertise required to change the template?
No, the template is user-friendly, and modifications can be made with just a few clicks. It is intuitive enough for people across different expertise levels to use effectively.
How does the template facilitate better understanding among non-technical stakeholders?
By visualizing the login process, the template makes the sequence and its components easily understandable, allowing non-technical stakeholders to grasp complex interactions without needing to understand the underlying code.
Are the changes made to the template in real-time?
Yes, any alterations or additions to the template are updated in real time, allowing for immediate feedback and collaborative editing.
Get started with this template right now.
Datavant Switchboard with AWS Clean Rooms Template
Works best for:
AWS
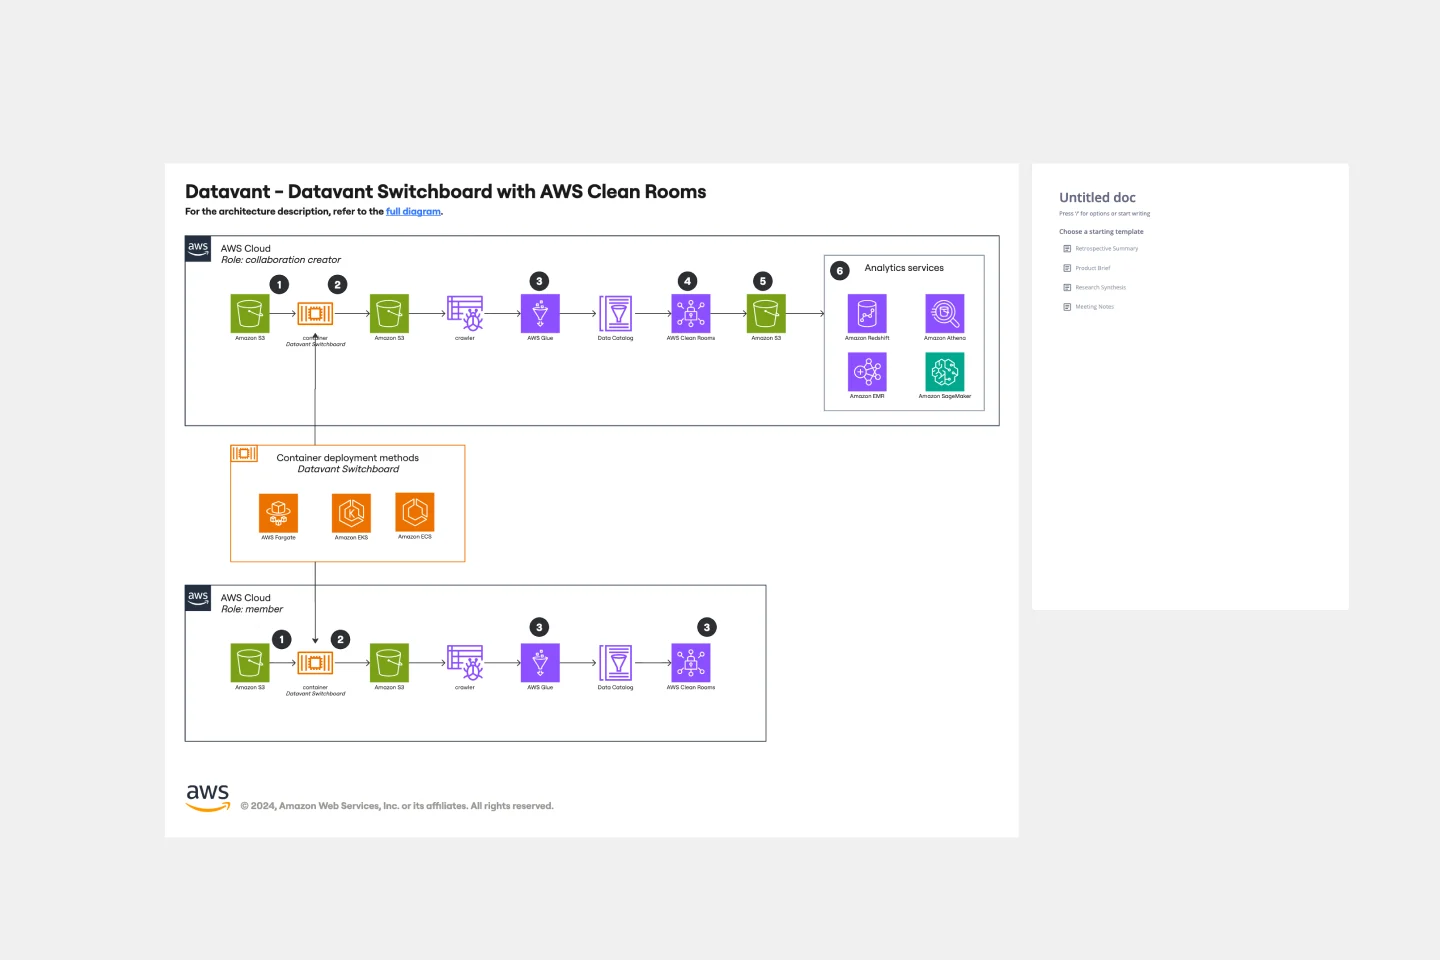
The AWS Datavant Switchboard Clean Rooms Template integrates health data sources using Datavant's secure data connection capabilities and AWS Clean Rooms' scalable data processing environment. It's useful for professionals in engineering, database management, and development. The customizable Miro interface streamlines secure and efficient data handling and team collaboration for a wide range of projects.
User Flow Example
Works best for:
Flowcharts, Mapping, Diagrams
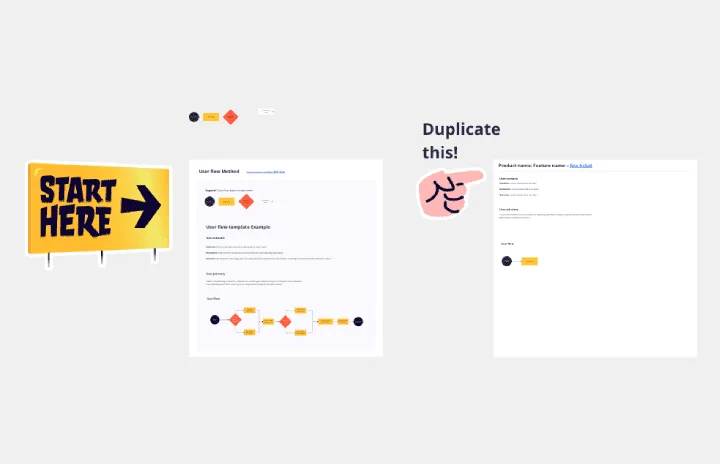
The User Flow Example template offers a visual representation of a typical user flow within a digital product or service. It provides elements for documenting user interactions, navigation paths, and decision points along the user journey. This template enables UX designers and product teams to understand user behavior, identify pain points, and optimize the user experience. By providing a concrete example of user flow, the User Flow Example template serves as a valuable reference for designing intuitive and engaging digital experiences that meet user needs effectively.
Venn Diagrams by Dave Westgarth
Works best for:
Venn Diagram
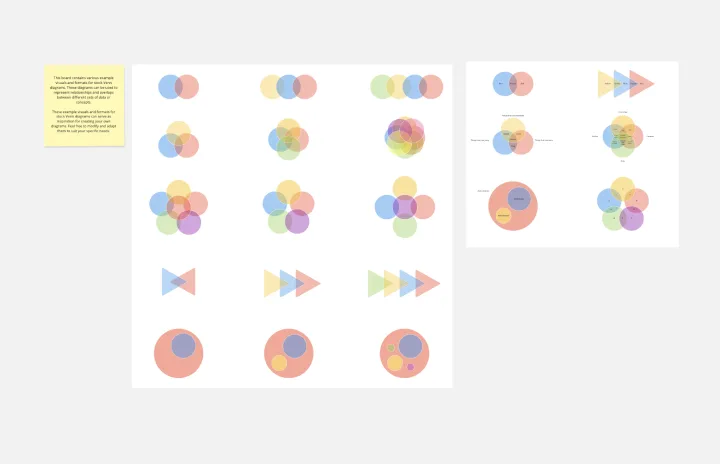
Visualize relationships and intersections clearly with the Collection Venn Diagram template. This tool is perfect for comparing multiple sets of data, identifying commonalities, and showcasing unique elements. Use it in presentations, research, and data analysis to make complex information more digestible. Ideal for educators, researchers, and analysts seeking to present data insights effectively.

20/80 Process Diagram - EOS Compatible
Works best for:
Diagramming
The 20/80 Process Diagram - EOS® Compatible template is a visual tool for mapping out processes and workflows aligned with the Entrepreneurial Operating System (EOS®) methodology. It provides a structured framework for identifying core processes and key activities that drive business outcomes. This template enables organizations to streamline operations, clarify roles and responsibilities, and enhance accountability. By promoting alignment with EOS® principles, the 20/80 Process Diagram empowers teams to achieve organizational excellence and drive sustainable growth.
Data Flow Diagram Template
Works best for:
Flowcharts, Software Development, Diagrams
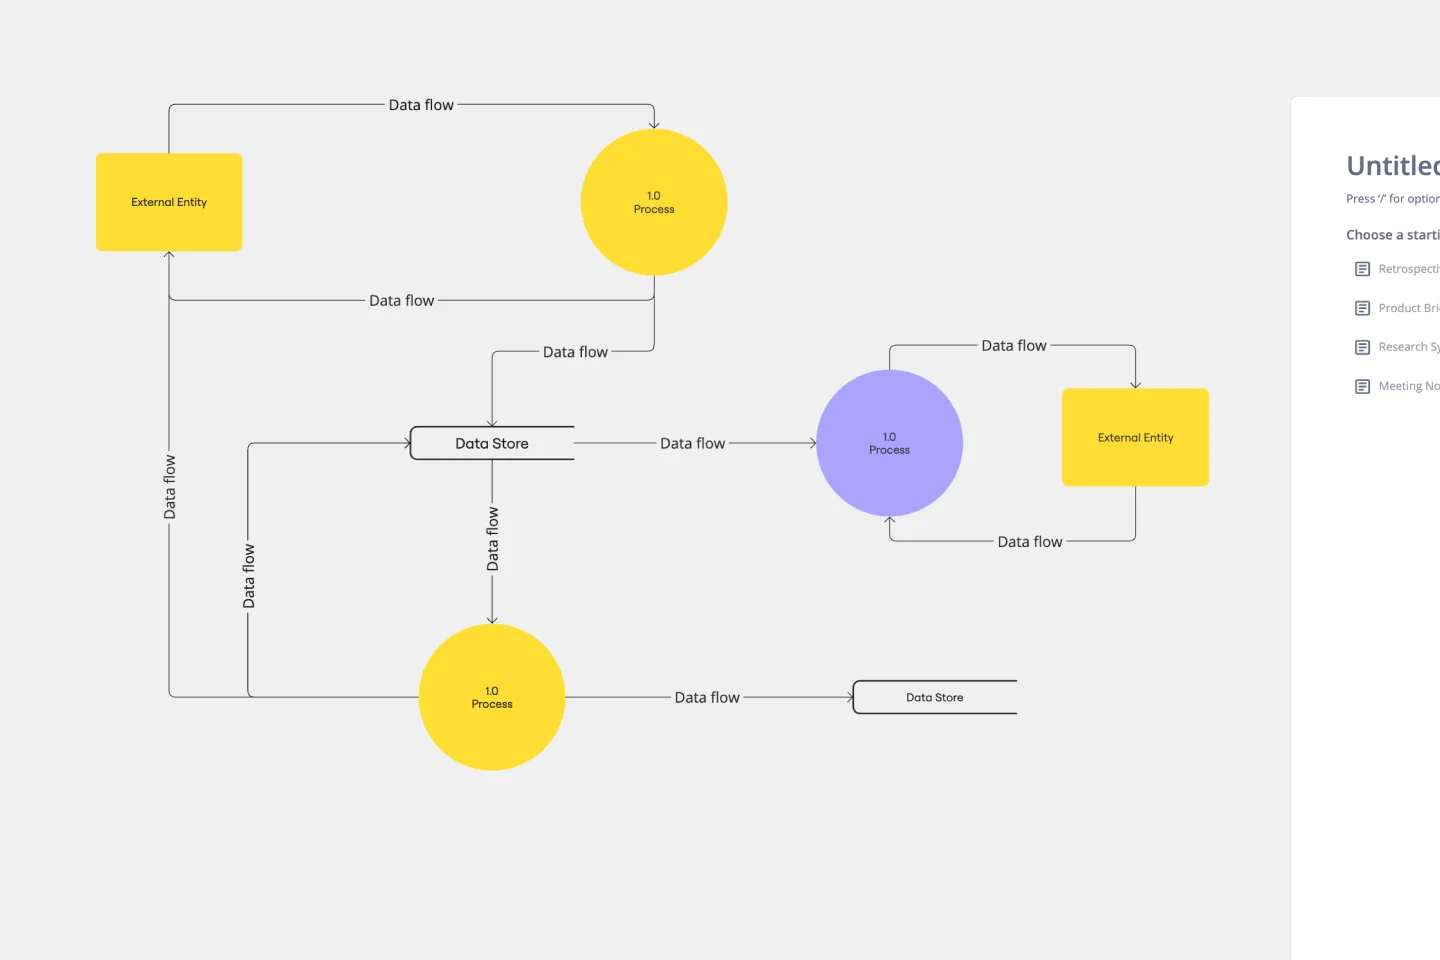
Any process can get pretty complex, especially when it has multiple components. Get a better grasp of your process through a data flow diagram (DFD). DFDs create a simple visual representation of all components in the flow of data and requirements in an entire system. They’re most often used by growth teams, data analysts, and product teams, and they’re created with one of three levels of complexity—0, 1, or 2. This template will help you easily build the best DFD for your process.
BPMN 2.0
Works best for:
Diagramming
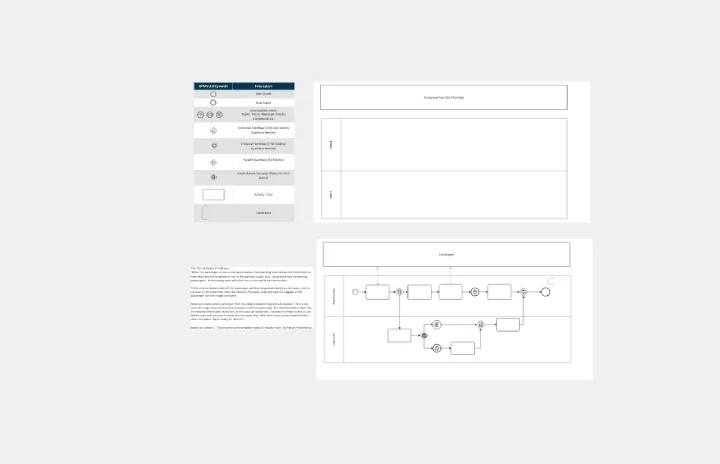
The BPMN 2.0 template offers a visual notation for modeling business processes using the Business Process Model and Notation (BPMN) standard. It provides elements for defining process flows, activities, and decision points. This template enables teams to document and analyze business processes systematically, facilitating process optimization and automation. By promoting standardization and clarity in process modeling, the BPMN 2.0 template empowers organizations to improve efficiency, agility, and compliance in their operations.