Likert Scale Template
Use our 5 (or 7) Point Likert Scale to measure attitudes, knowledge, values and opinions with a greater degree of nuance.
About the Likert Scale Template
The Likert scale is a rating system you can use to measure complex, subjective data such as how people feel about your product, service, or experience. This template makes it easy to conduct user interviews and gather feedback.
With the Likert scale template, users can pick out a possible response to a statement or question that’s either expressed in words or numbers.
Examples of responses include a range such as “strongly agree,” “neutral,” “agree,” “disagree” or “strongly disagree,” or “strongly satisfied” to “strongly dissatisfied.”
You can also use numbers, such as 1 = “strongly agree,” 2 = “agree,” and so on.
Tips for using the Likert scale template
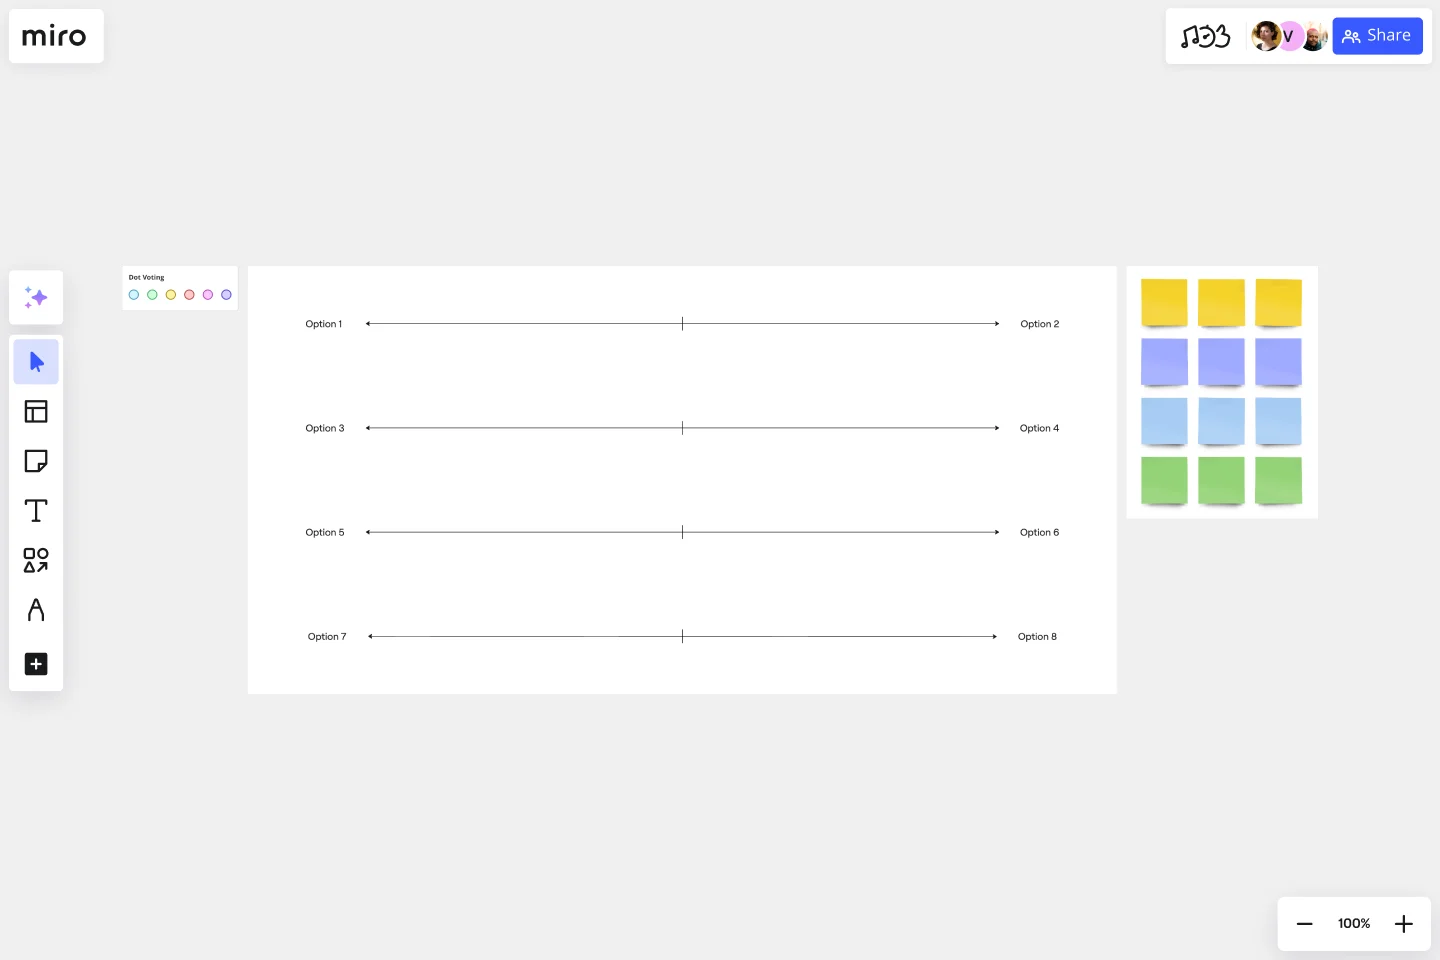
The Likert scale is either a five (or seven) point scale of response options that asks your customer or interview subject to agree or disagree with a statement.
The scale assumes that the intensity of someone’s attitude or opinion is linear, ranging from strongly agree to strongly disagree, and assumes that attitudes can be measured.
For example, each of the five (or seven) responses would either be counted in terms of how often a sentiment was expressed or have a numerical value that would be used to measure the attitude being explored.
Likert data can be a reliable source to point to how people think and feel, as long as you’re aware of the when-in-doubt-just-agree tendency.
To reduce the impact of this bias, researchers can...
Phrase questions as statements: presenting facts for customers to align with (or reject) can offer insight into different pieces of your business. Accordingly, the score averages give you a general measure of satisfaction that you can track over time and try to improve.
Include and evaluate both positive and negative statements, in pairs, for consistency: instead of measuring one-off sentiments, see if your customers are reliably in agreement, disagreement, or neutral in more than one instance.
When to use the Likert scale template
Researchers across disciplines, from UX to marketing to customer experience, can use a Likert scale to measure statements of agreement.
Depending on your product, service, or experience, the scale can also be used to measure:
Agreement: Strongly agree → Strongly disagree
Frequency: Often → Never
Quality: Very good → Very bad
Likelihood: Definitely → Never
Importance: Very important → Unimportant
To get a more accurate measurement of everyone’s responses, it’s worth asking people to agree or disagree with multiple statements. You can then combine or average a person’s responses.
How to use the Likert scale template
Get started by selecting the Likert scale template, then take the following steps to make one of your own:
Decide what you’d like to measure. This is the foundation for your research. Ensure that what you’re measuring can be scaled on the strength of opinions, attitudes, feelings, or experiences. Customers should see two clear extremes (positive and negative) and a neutral midpoint.
Create or edit the indicator statements or questions. The scale works best when you’re trying to find customer insights that can’t be understood with just one answer. An example statement could be, “The number of items on the takeaway menu overwhelms me.” Every statement (or each question) is trying to dig into what your customer actually feels.
Decide on Likert response scales. At a minimum, you can aim for a 5-point scale. At maximum, a 7-point scale. Any less or any more can compromise readability. Choose simple, clear language with different categories, such as “Agree - Disagree,” “Helpful - Not Helpful,” “Always - Never.” You can add or delete sticky notes (which can act as points and categories) accordingly.
Pre-test with your team. Share the Miro board with your team to test any unclear questions, awkwardly worded statements, or duplicate categories. Ask your team if every element on the scale can help you gather actionable feedback. If not, revise or delete that element.
Test (and re-test) as needed. Invite participants onto your board and ask them to respond to each statement or question. Data collection should be a process that you keep fine-tuning over time. Start with a small sample group of participants representing a larger group you’re trying to learn about. Refine – or expand – your point scale and category language as you get user feedback and calculate results.
Organize and import Likert Scale survey results visually from other sources. Import survey results as needed on your Miro board, to share and review with your team.
Get started with this template right now.
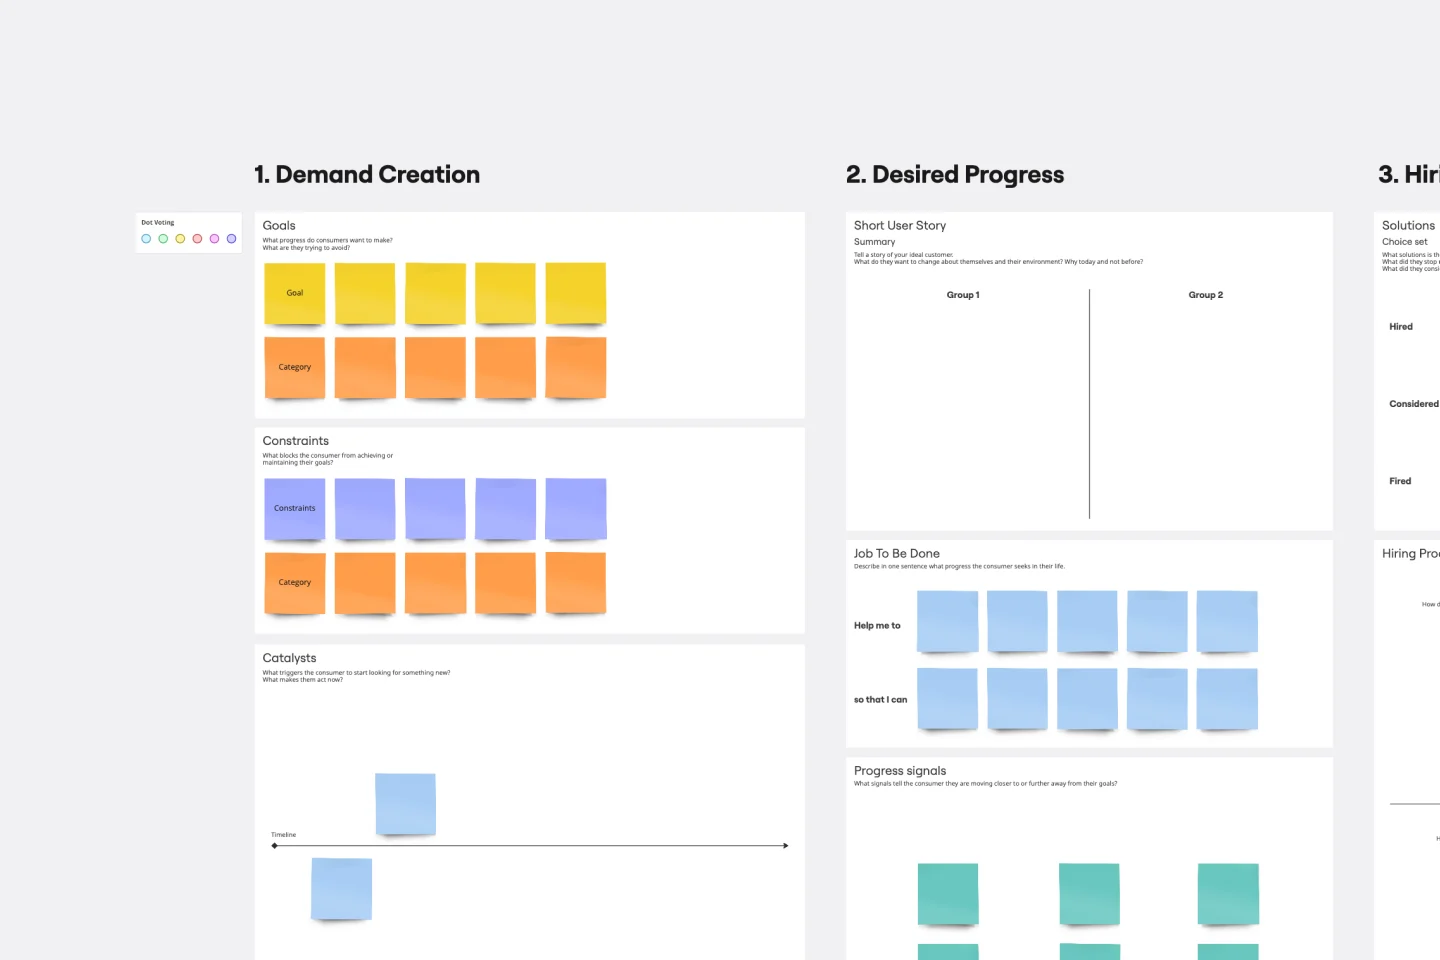
Jobs to be Done template
Works best for:
Ideation, Design Thinking, Brainstorming
It’s all about a job done right — customers “hire” a product or service to do a “job,” and if it's not done right, the customer will find someone to do it better. Built on that simple premise, the Jobs To Be Done (JTBD) framework helps entrepreneurs, start-ups, and business managers define who their customer is and see unmet needs in the market. A standard job story lets you see things from your customers’ perspective by telling their story with a “When I…I Want To…So That I …” story structure.
Cost-Benefit Analysis Template
Works best for:
Leadership, Decision Making, Strategic Planning
With so many day-to-day decisions to make—and each one feeling high-stakes—it’s easy for all the choices to weigh a business or organization down. You need a systematic way to analyze the risks and rewards. A cost benefit analysis gives you the clarity you need to make smart decisions. This template will let you conduct a CBA to help your team assess the pros and cons of new projects or business proposals—and ultimately help your company preserve your precious time, money, and social capital.
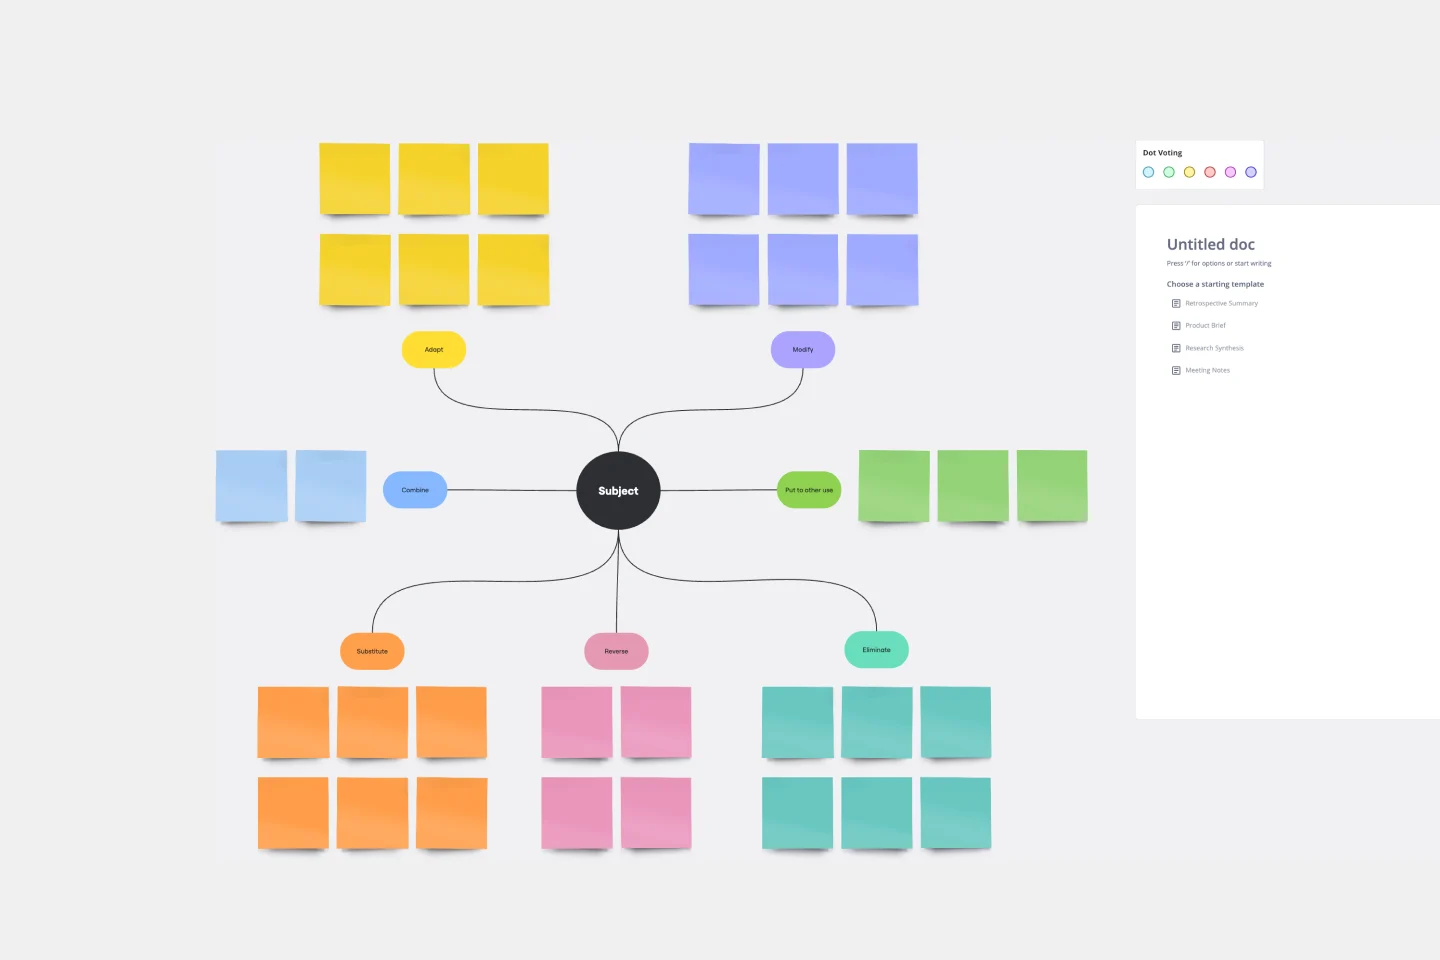
SCAMPER Model
Works best for:
Ideation, Operations, Brainstorming
Is your team in a rut? Have you had a lingering problem that can’t seem to be solved? First introduced in 1972, SCAMPER. is a brainstorming method developed by Bob Eberle, an author of creativity books for young people. This clever, easy-to-use method helps teams overcome creative roadblocks. SCAMPER walks you through seven questions that are meant to encourage your team to approach a problem through seven unique filters. By asking your team to think through a problem using this framework, you’ll unlock fresh, innovative ways to understand the problem you’re trying to solve.
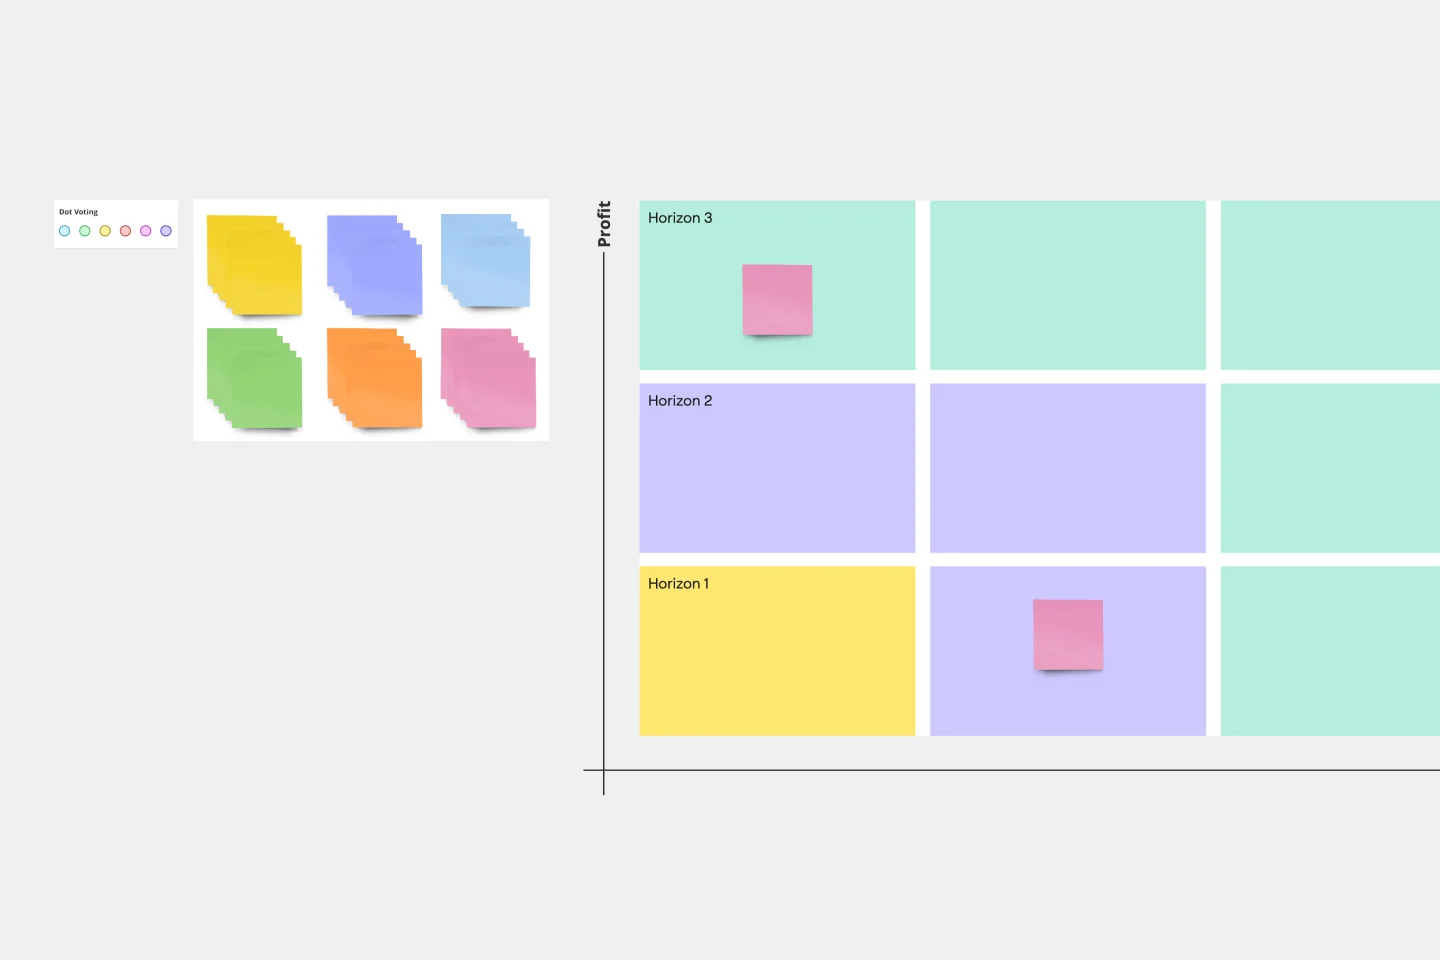
3 Horizons of Growth Template
Works best for:
Leadership, Strategic Planning, Project Planning
Featured in The Alchemy of Growth, this model gives ambitious companies a way to balance the present and the future—in other words, what’s working in the existing business and what emerging, possibly-profitable growth opportunities lie ahead. Then teams across the organization can make sure that their projects map to and support the organization’s goals. The 3 Horizons of Growth model is also a powerful way to foster a culture of innovation—one that values and depends on experimentation and iteration—and to identify opportunities for new business.
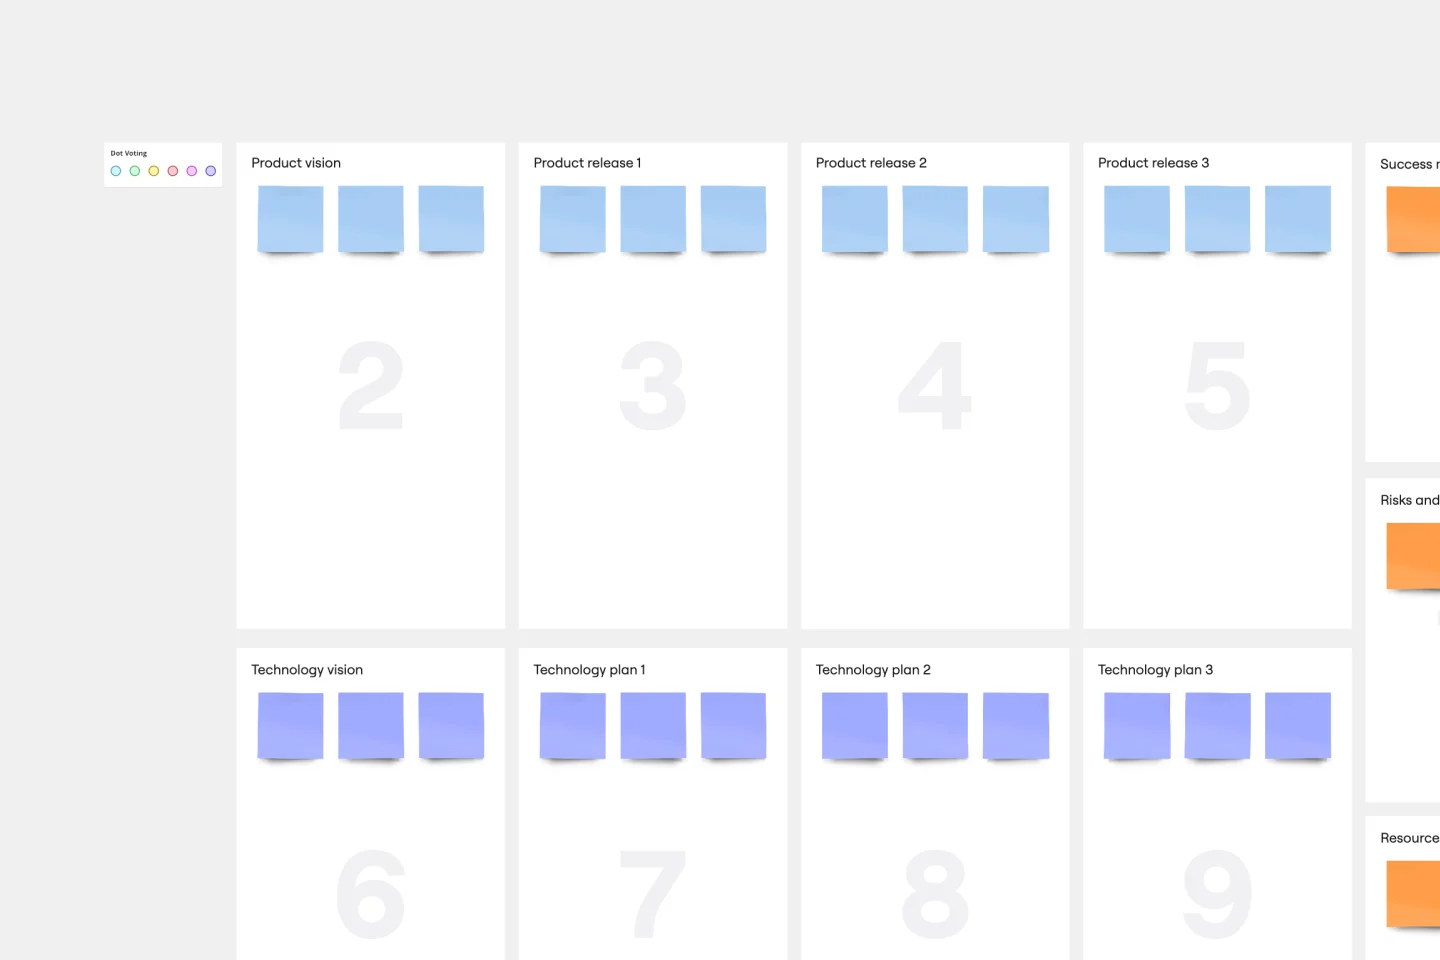
Technology Product Canvas Template
Works best for:
Product Management, Meetings
Originally created by Prem Sundaram, the Technology Product Canvas allows product and engineering teams to achieve alignment about their shared roadmap. The canvas combines agile methodologies with UX principles to help validate product solutions. Each team states and visualizes both product and technology goals, then discusses each stage of the roadmap explicitly. This exercise ensures the teams are in sync and everyone leaves with clear expectations and direction. By going through the process of creating a Technology Product Canvas, you can start managing alignment between the teams -- in under an hour.
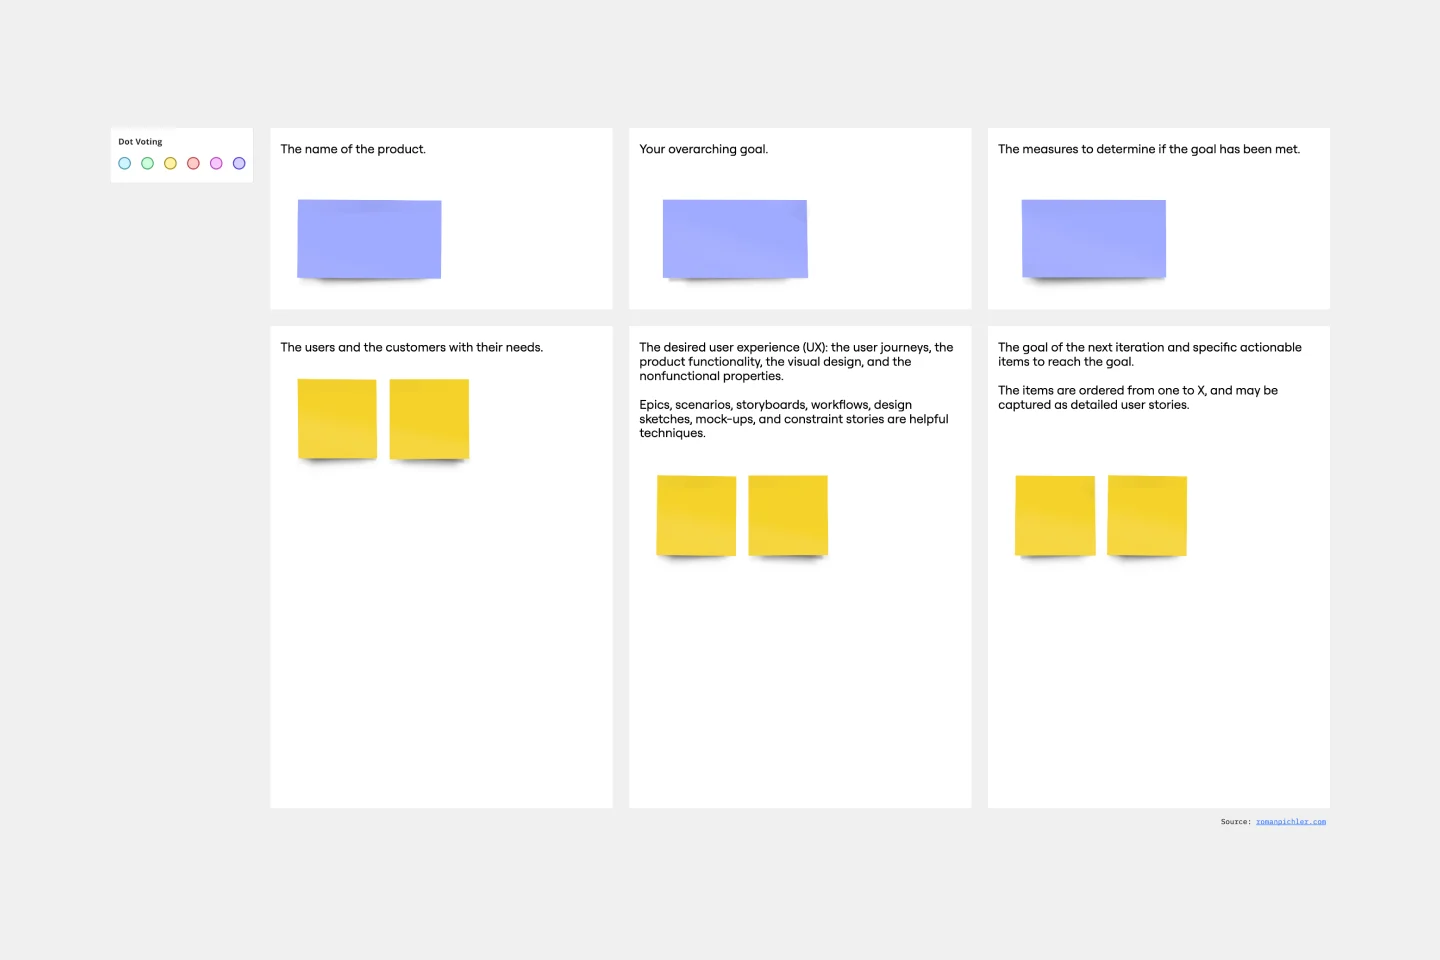
Product Canvas Template
Works best for:
Desk Research, UX Design
Product canvases are a concise yet content-rich tool that conveys what your product is and how it is strategically positioned. Combining Agile and UX, a project canvas complements user stories with personas, storyboards, scenarios, design sketches, and other UX artefacts. Product canvases are useful because they help product managers define a prototype. Creating a product canvas is an important first step in deciding who potential users may be, the problem to be solved, basic product functionality, advanced functionalities worth exploring, competitive advantage, and customers’ potential gain from the product.