Kubernetes Architecture Diagram Template
Visualize the deployment of your applications with Kubernetes Architecture Diagram template and optimize your processes.
Available on Enterprise, Business, Education plans.
About the Kubernetes Architecture Diagram Template
A Kubernetes Architecture Diagram template is where you can visually represent the deployment, scale, and management of containerized applications. You can use a Kubernetes Architecture Diagram template to manage apps and ensure there is no downtime in production.
This Kubernetes Architecture Diagram for K8 architecture helps you and your team manage the deployment of applications. This template can be used to organize applications and easily map out Kubernetes decentralized architecture.
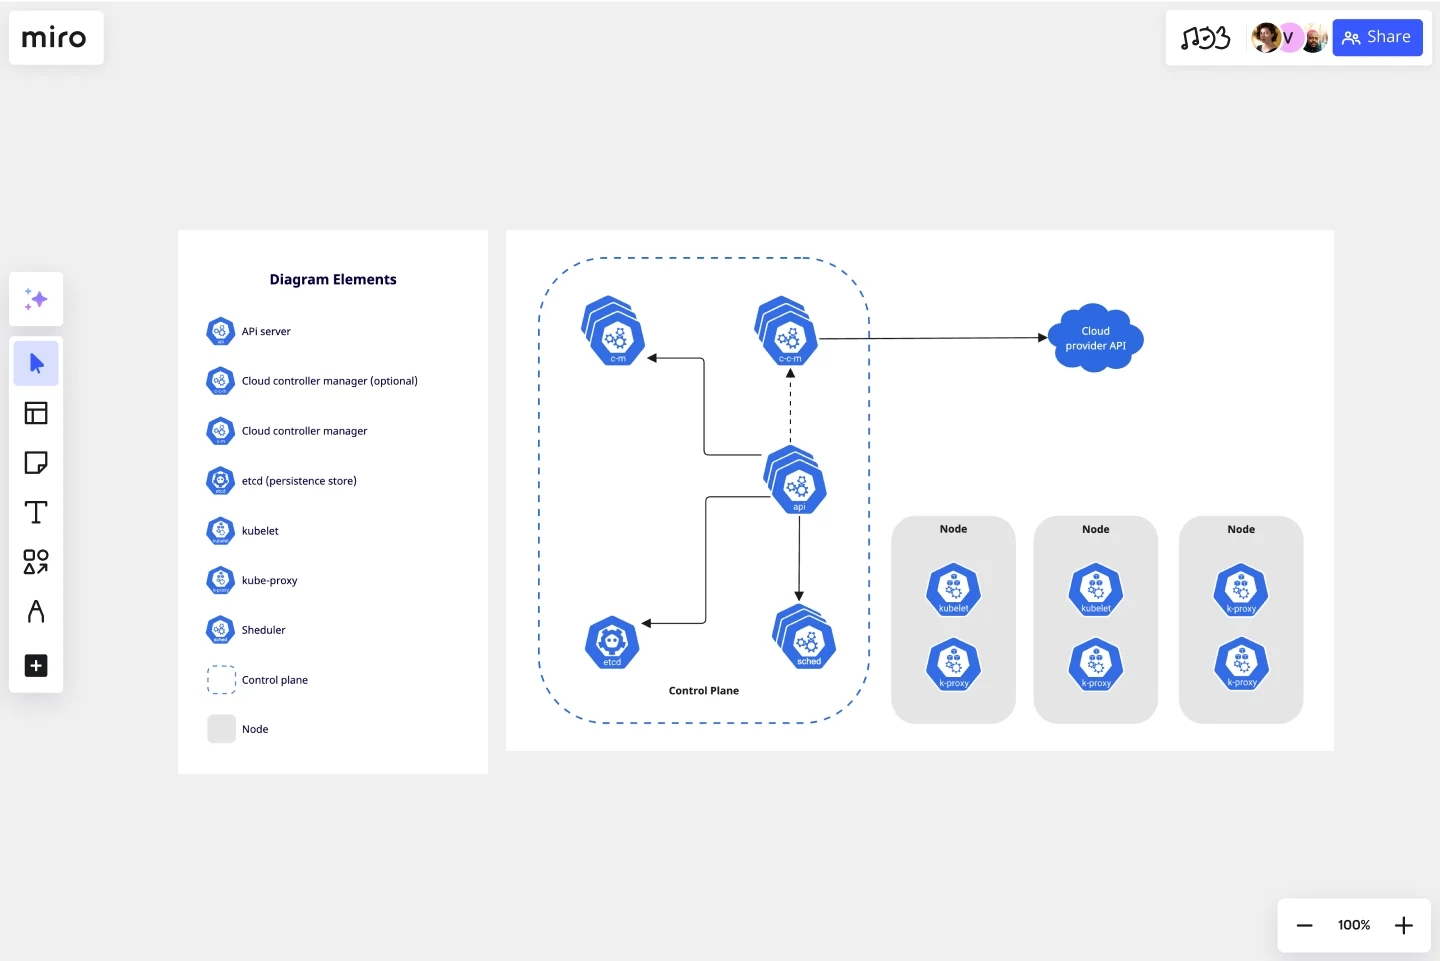
Kubernetes cluster architecture and components
When you deploy Kubernetes, you get a cluster which is a node that runs containerized applications.
Developers use containers because they provide extra benefits such as agile app creation, deployment, and continuous development and integration. Containers are coordinated automatically and monitored constantly, and the K8s architecture makes it easy to deploy and scale containerized applications.
The components of a Kubernetes Architecture Diagram template are:
Cloud controller manager: links your cluster to the cloud provider
Controller manager: makes global decisions about the cluster
Etcd (persistent store): backs store for all cluster data
Kubelet: runs each node in the cluster
Kube proxy: network proxy that runs in each node of the cluster
Scheduler: watches for newly created Pods with no assigned node, and selects a node for them to run on
Control place: runs controller processes
Node: provides Kubernetes runtime environment
How do I create a Kubernetes Architecture Diagram template?
A Kubernetes Architecture Diagram template allows you to visualize the deployment of apps.
To create a basic Kubernetes diagram with Miro, you can follow these steps:
Define your Kubernetes Architecture cluster.
List your Kubernetes components, using our set of Kubernetes Icons.
Organize your diagram, adding the components.
Add connection lines between the component shapes and set the arrows in the direction of the flow.
Format and customize your Kubernetes Architecture Diagram template.
In Miro, you can quickly build a Kubernetes Diagram from scratch using our design tools and icons set, or use our Kubernetes Architecture Diagram template and customize it as you see fit.
Miro is the perfect cloud and network diagram tool with many available shape packs, icons, and templates, ranging from Kubernetes architecture to AWS to Cisco, and many more!
How to create a Kubernetes diagram using this template?
In Miro you can create a Kubernetes Architecture Diagram using our template from our Templates Library or build your own diagram from scratch. Add Kubernetes icons by selecting our icons set on the left sidebar, connecting them with connector lines, and placing arrows in the flow direction. Miro’s collaborative whiteboard allows you to work together in real-time or asynchronously. Try it for yourself to see how it can work for you.
Why is it important to diagram Kubernetes architecture?
Developers create a Kubernetes Architecture Diagram to better manage and deploy application containers and continuously improve development, integration, and app deployment. Having a Kubernetes diagram helps to work across teams and to keep collaboration seamlessly when managing applications.
Get started with this template right now. Available on Enterprise, Business, Education plans.
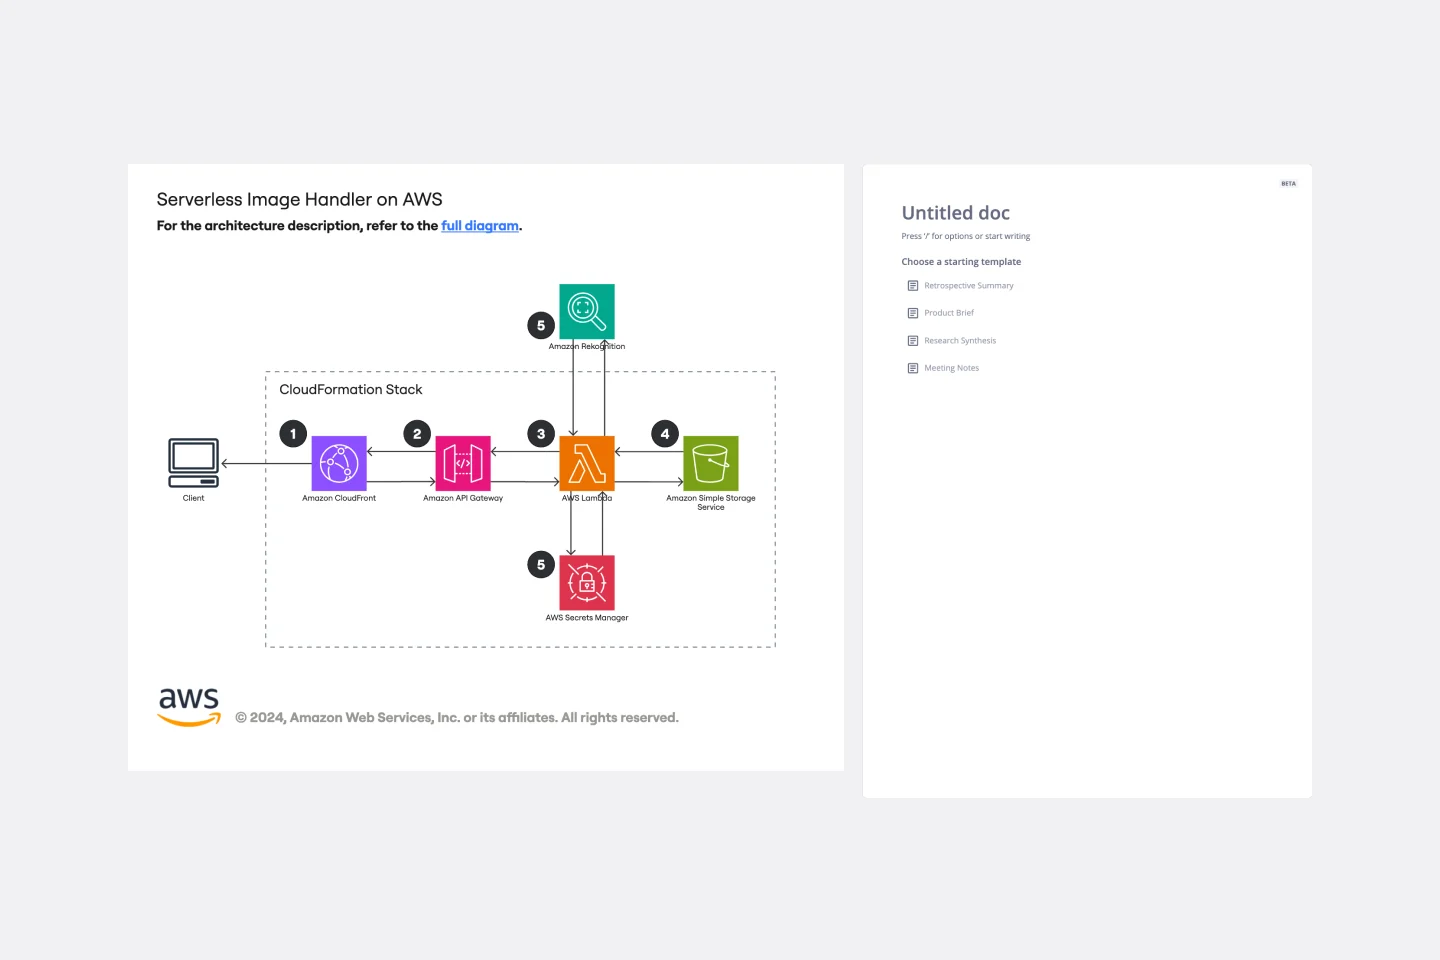
Serverless Image Handler on AWS Template
Works best for:
AWS
The Serverless Image Handler on AWS template is designed to facilitate the management and transformation of images in cloud-based projects without the need for server infrastructure management. It is particularly useful for applications and projects that require dynamic image management, offering benefits like efficiency, scalability, and seamless integration with AWS services. By incorporating this template into Miro boards or projects, teams can streamline their workflows, especially when dealing with digital assets or dynamic content, ensuring that their image-handling needs are met efficiently as they scale.
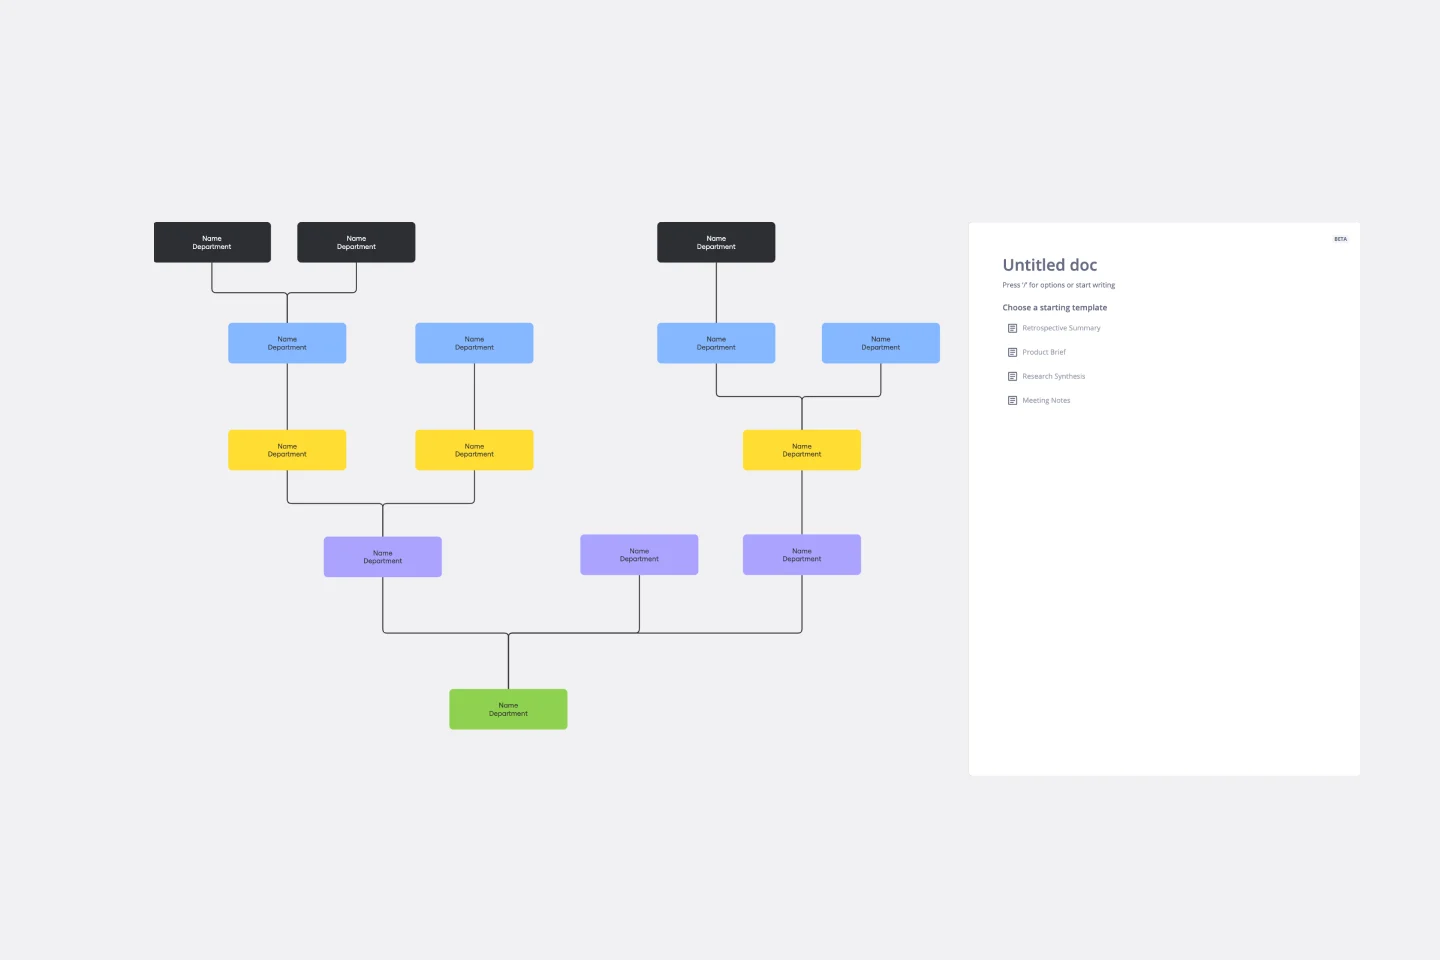
Inverted Org Chart Template
Works best for:
Org Charts, Organizational Design
The Inverted Org Chart Template is a tool that reimagines the traditional hierarchical model by placing frontline employees at the top of the organizational structure. This innovative approach highlights the crucial role played by those who interact with customers directly, ensuring that their insights and contributions are not only recognized but also celebrated. One of the key advantages of this template is that it fosters a feedback-driven environment. Prioritizing frontline workers promotes a culture where valuable insights from the ground can quickly reach the top of the hierarchy, streamlining decision-making processes and ensuring that strategies are based on real-world experiences.
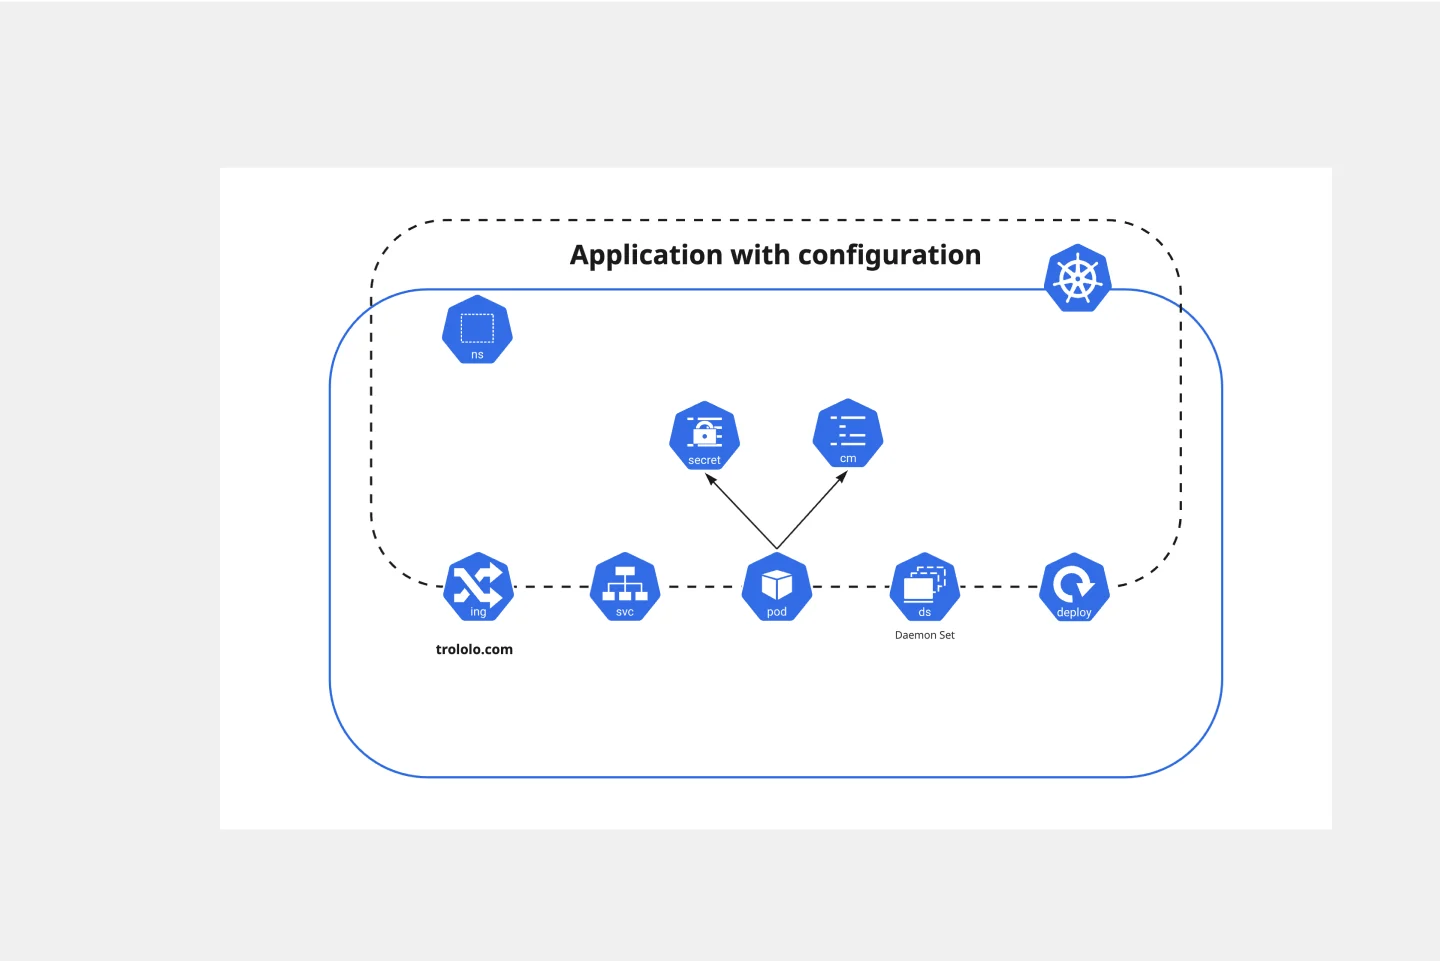
Kubernetes Application Template
Works best for:
Software Development, Diagrams
Use the Kubernetes Application template to manage enterprise-ready containerized applications better. You can now get your team more agile when dealing with portability, licensing, and consolidated billing. The Kubernetes Application template allows you to run deployments anywhere, facilitating the management of your applications. Try it out and see if it’s the best fit for you and your team.
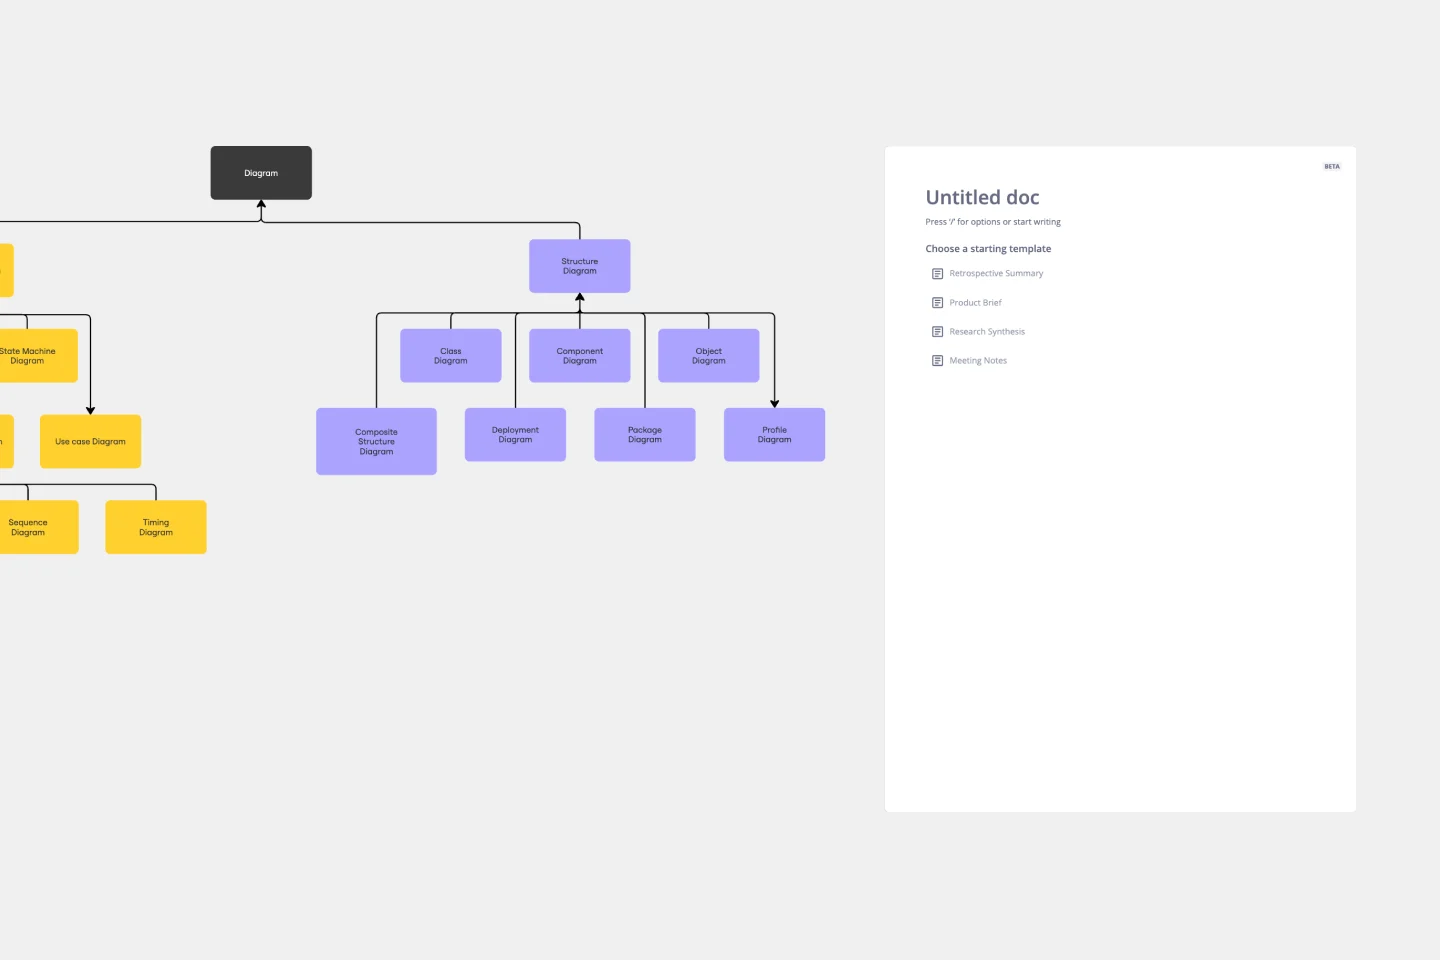
UML Class Diagram Template
Works best for:
UML Class Diagram Template, Mapping, Diagrams
Get a template for quickly building UML class diagrams in a collaborative environment. Use the UML class diagram template to design and refine conceptual systems, then let the same diagram guide your engineers as they write the code.
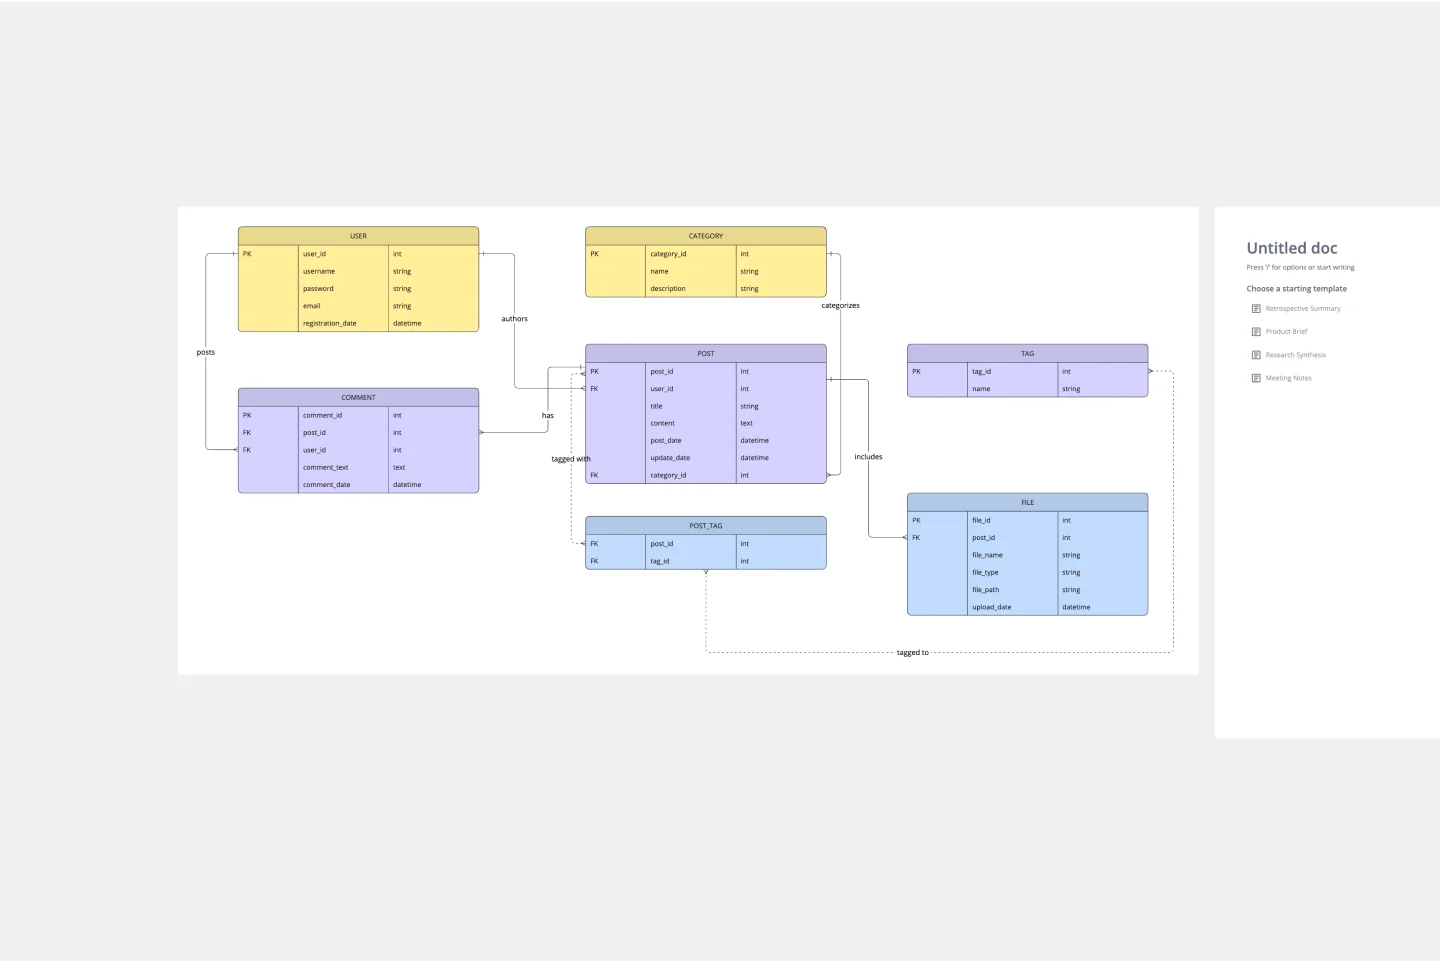
ERD Blogging System Template
Works best for:
ERD
The ERD Blogging System template in Miro efficiently manages and organizes digital content. It features key entities such as User, Post, Comment, Category, Tag, and File, which are essential for managing the creation and publication of blog posts, engaging users through comments, and organizing content via categories and tags. Additionally, it supports media attachments through the File entity, linking them to the relevant content. This template helps streamline the blogging process, making it an invaluable tool for content management and publication.
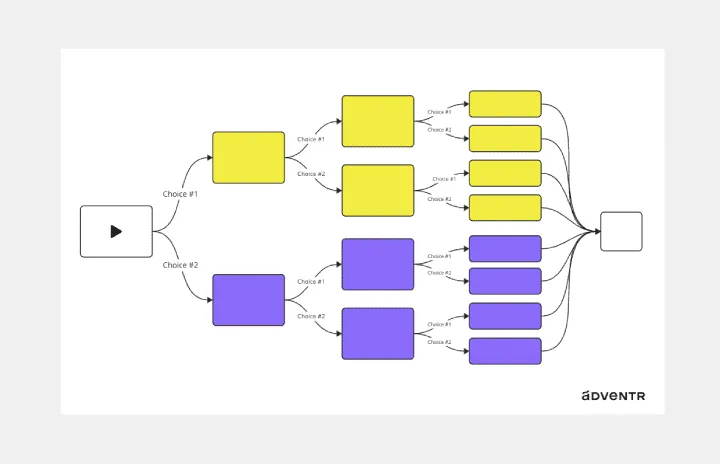
Interactive Video Storyboard Canvas
Works best for:
Diagramming
The Interactive Video Storyboard Canvas template offers a visual framework for planning and storyboarding interactive video content. It provides elements for outlining scenes, defining interactions, and visualizing user pathways. This template enables teams to design engaging and immersive video experiences, facilitating collaboration and alignment among content creators and stakeholders. By promoting creativity and interactivity, the Interactive Video Storyboard Canvas empowers teams to create compelling video narratives that captivate audiences and drive engagement.