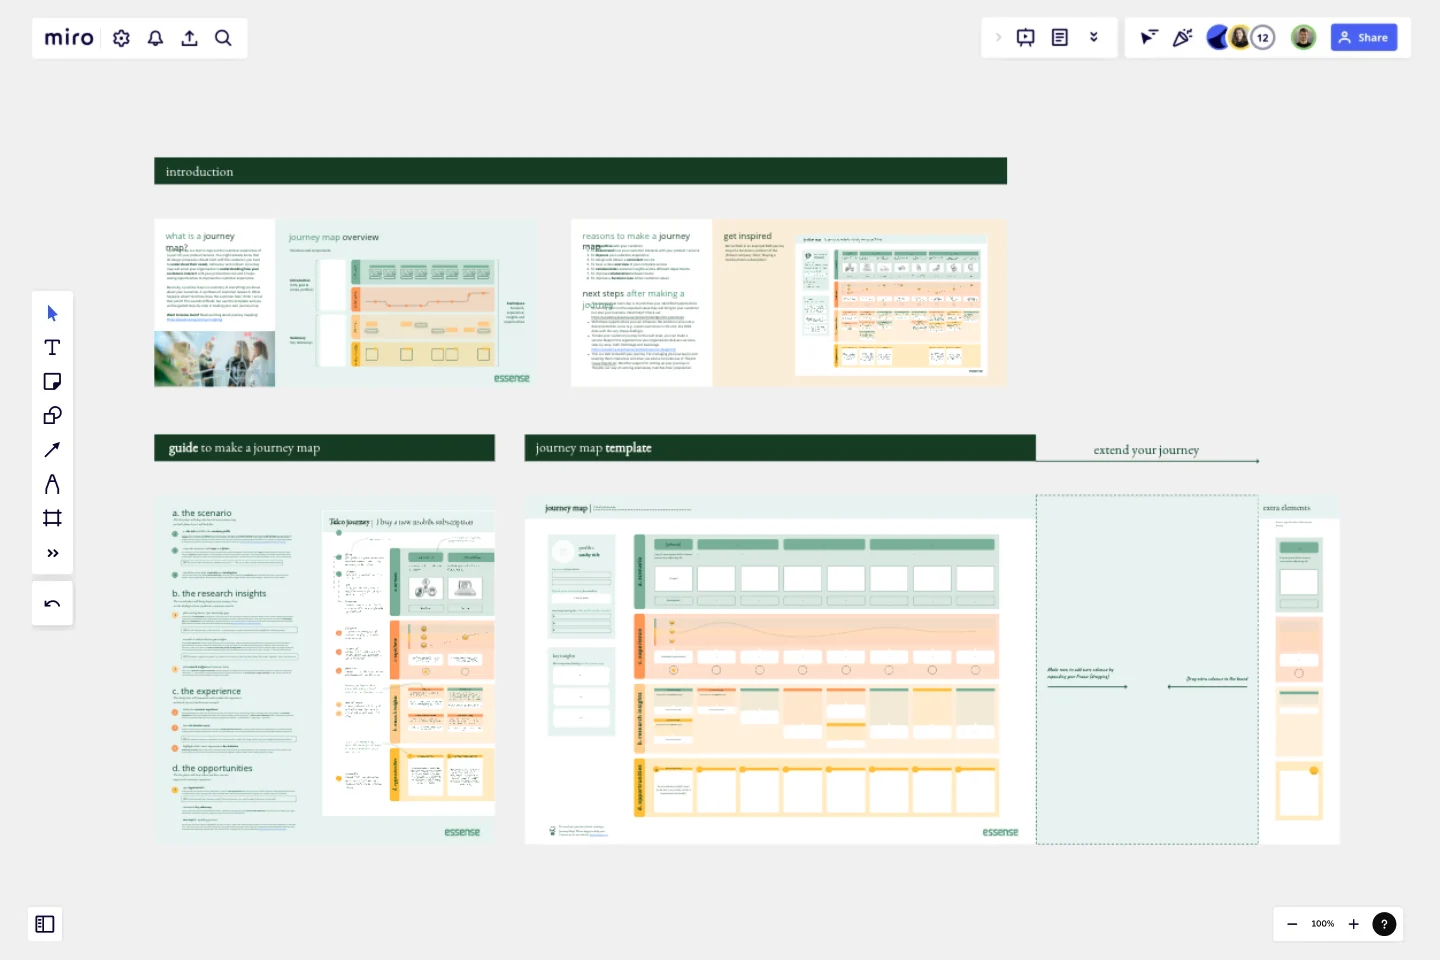
Journey Map To Plot the Customer Experience
A journey is a tool to map out the customer experience of (a part of) your product/service in a visual way.
Suppose your organization provides a product or service, for example, mobile phone subscriptions. On your Journey Map, you will find a customer who goes through the process of selecting and purchasing a subscription (scenario), how the customer perceives each step (experience), what you learned about the overall needs of your customers (insights), and what can still be improved (opportunities). A journey map will serve your organization in understanding how your customers interact with your product/service and it helps see opportunities to improve the customer experience.This sounds more difficult than it is, but use this template and you will be guided step-by-step in making your own journey map.From our experience as a service design agency, we also provide you with tips and examples for how you can use a Journey Map for empathizing with your customer and improving your customer experience. Additionally, a Journey Map can be used to gain a complete overview of your services and improve collaboration between your departments.Our instructions for making your own Journey Map:
The scenario: Determine the scenario and profile. With this scenario, sketch a first draft of what this journey could look like from the perspective of your customer. You can enrich the scenario by adding drawings or pictures.
The research insights: collect and plot existing data on the journey map (reviews, earlier research, and personas). Look for knowledge gaps and assumptions that need validation. Execute user research to collect additional insights about the customer experience (i.e. interviews or observations). Analyze this data and cluster corresponding findings, quotes and insights and plot these on your journey map.
The customer experience: Define the customer experience based on the research and insights collected, and draw the emotion curve. Here you emphasize where things go well and where improvement is needed. Determine which steps make or break the overall experience and where to focus first.
The opportunities: Together with key stakeholders, analyze the journey to spot opportunities that can improve your customer experience. The journey might contain a lot of information and opportunities, so summarise the key takeaways to make the journey actionable, and determine what the next steps will be.
This template was created by Essense.
Get started with this template right now.
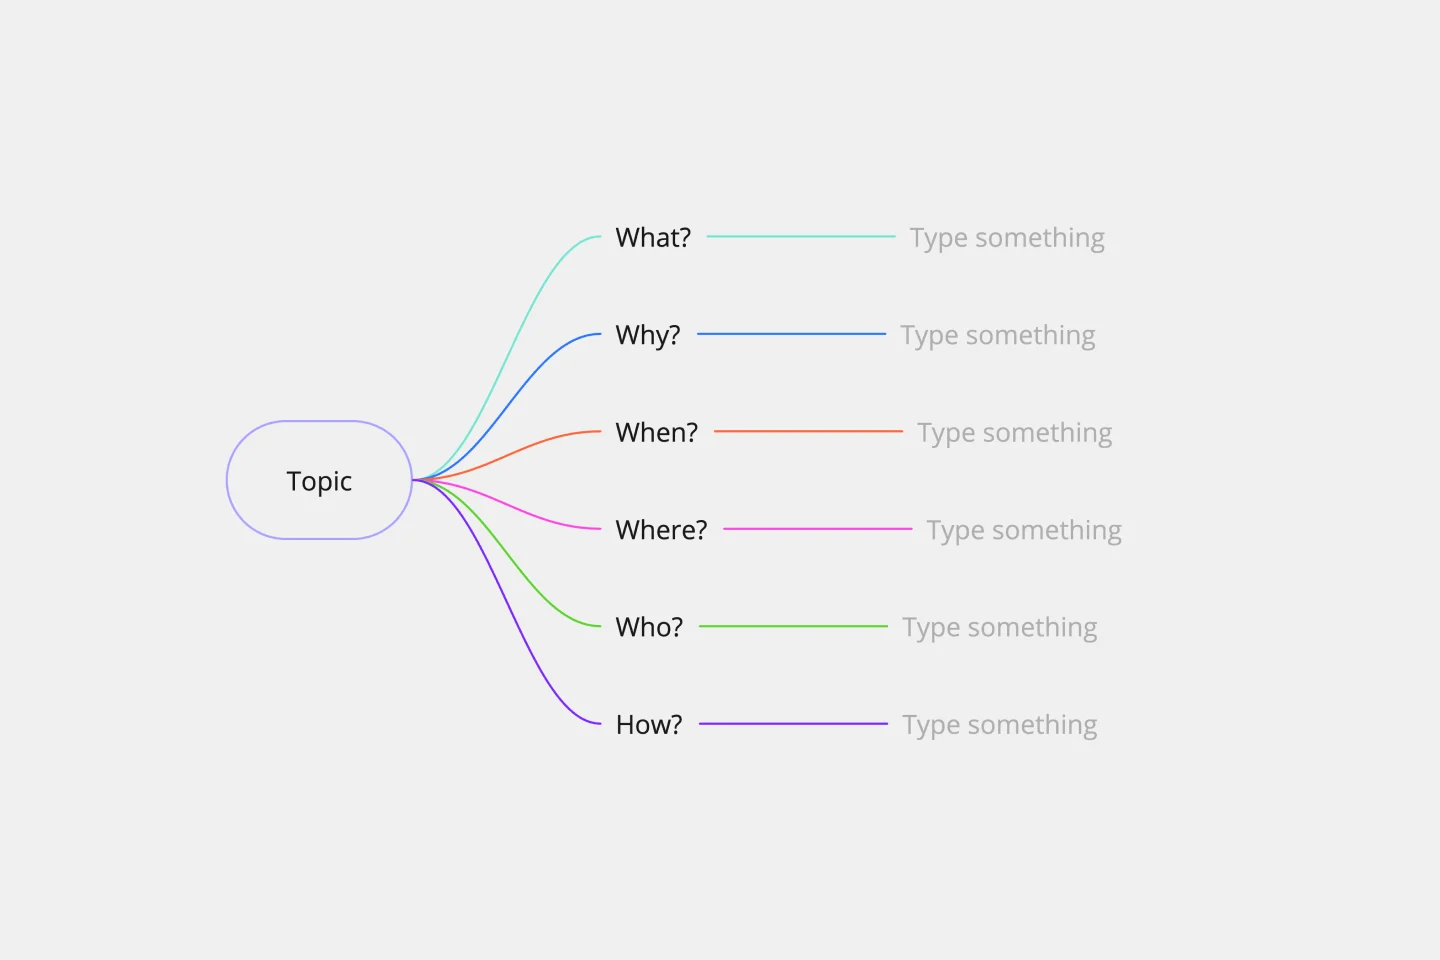
5W1H Template
Works best for:
Strategy & Planning
The 5W1H Template is a strategic framework that clarifies complex situations or projects into six foundational questions: What, Who, Where, When, How, and Why. This methodological approach ensures a comprehensive understanding, encouraging teams to dissect and explore every aspect of a given challenge or project.
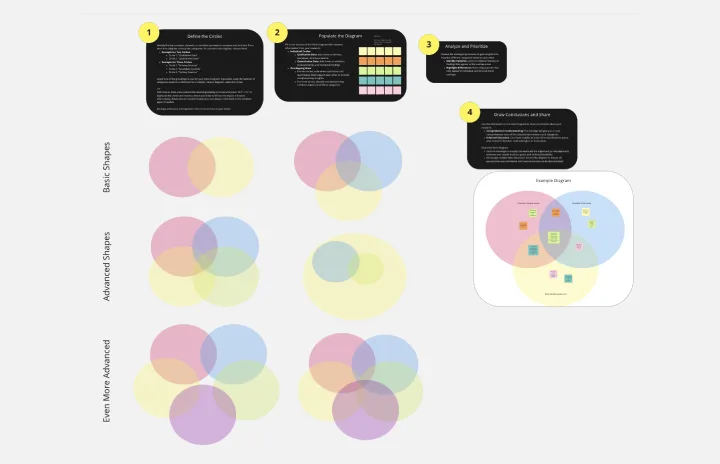
Venn Diagram for Research
Works best for:
Venn Diagram
The Venn Diagram for Research template is a powerful tool for analyzing relationships and intersections in research data. Use it to compare different variables, identify overlaps, and draw insights from complex datasets. This template is ideal for researchers, analysts, and academics looking to visualize their findings and communicate results effectively. It's perfect for scientific studies, market research, and any field that requires detailed data comparison.
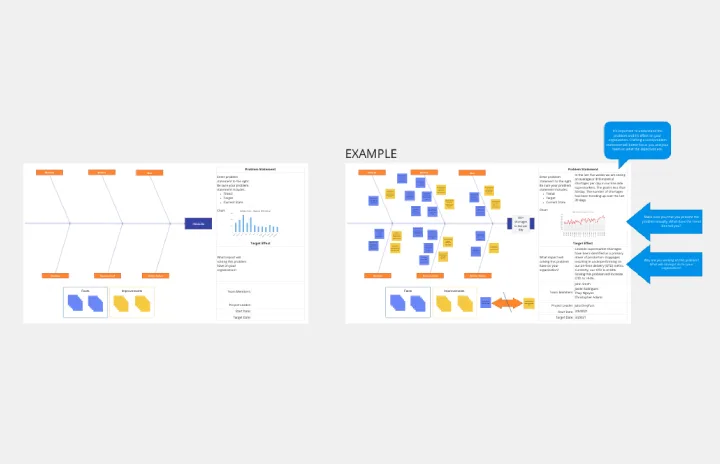
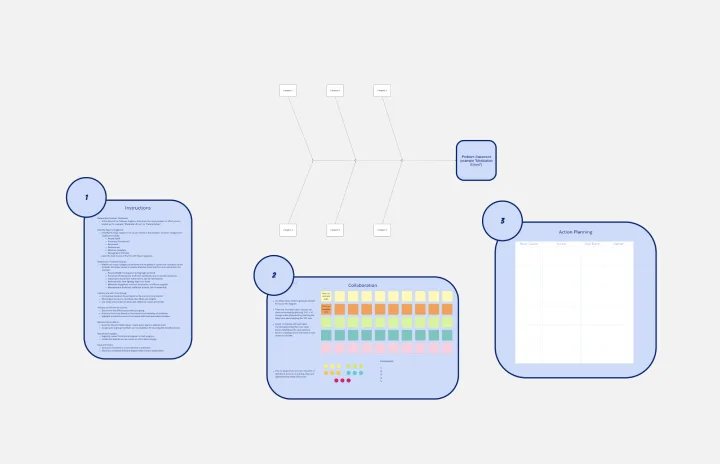
Crowd Sourced Cause and Effect
Works best for:
Fishbone Diagram, Problem solving
The Crowd Sourced Cause and Effect template leverages collective intelligence to identify root causes of problems. By involving multiple team members, you can gather diverse perspectives and uncover insights that might be overlooked. This collaborative approach ensures a comprehensive analysis and fosters team engagement.
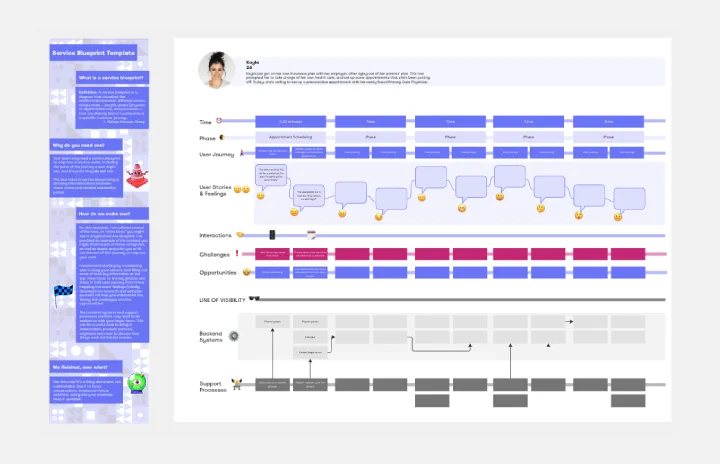
Service Blueprint by Liz Possee Corthell
Works best for:
Service Blueprint
Enhance your service design with the Service Blueprint Canvas. This template helps you visualize and analyze the entire service process, from front-stage customer interactions to back-stage support activities. Identify pain points, optimize workflows, and improve customer experiences. Ideal for service designers, managers, and teams focused on delivering exceptional service. The blueprint provides a comprehensive view, facilitating better communication and strategic planning.
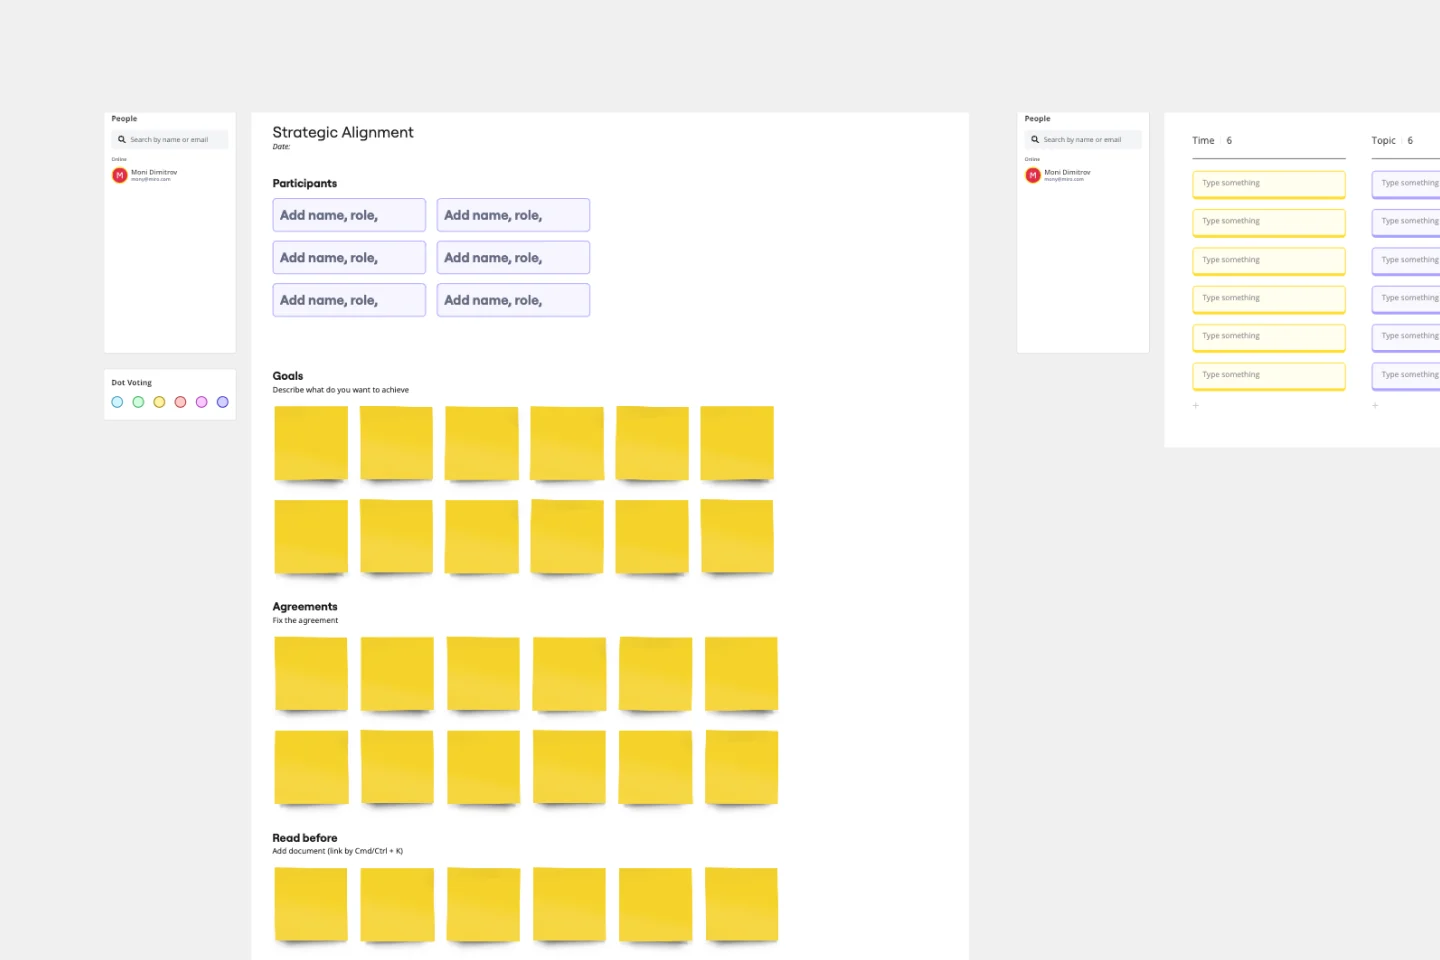
Team Meeting Agenda Template
Works best for:
Documentation, Team Meetings, Workshops
Making the time for your team is important to help you to make decisions, align on priorities, and move in the same direction together. Team meeting agendas help add a schedule and structure to your allocated time slot when you need to share information and collaborate with your team. They also allow your team to agree on goals, talking points, action items, and who will lead the next steps. Uninterrupted team meeting time with an agenda can help your team review progress against OKRs, share updates, discuss roadblocks, and brainstorm ideas.
Fishbone Diagram for Healthcare
Works best for:
Fishbone Diagram
Ensuring high-quality care in healthcare settings requires a thorough understanding of root causes behind issues. The Fishbone Diagram for Healthcare template helps you analyze potential causes of problems in areas like patient care, staff performance, and administrative processes. This structured approach facilitates comprehensive analysis and collaborative problem-solving, ultimately leading to improved healthcare outcomes and patient satisfaction.