Job Search Process Diagram
Job searches are not meant to be a walk in the park. You may feel frustrated, rejected, or overwhelmed at several points in the process, and if you don’t, you’re not doing it right.
But that doesn’t mean there aren’t resources out there to help you navigate the search to help you not only survive, but thrive. This diagram helps job seekers organize their job search by providing a tool to track their applications as they progress through companies’ multi-stage candidate pipelines. Whether you’re in your final stages and negotiating an offer, or you have nine rounds of interviews ahead of you (the worst!), this template is designed to be your job search sidekick from beginning to end.
About the Job Search Process Diagram
Designed for professionals, recent graduates, and career changers, this template is your indispensable tool for navigating the competitive job market efficiently and effectively. Ideal for professionals at all career stages, our Job Search Process Diagram is your ally in navigating the complexities of the job market and securing your next career opportunity.This template includes:
Structured sections to facilitate a methodical approach to the job search process.
Interactive areas for team collaboration, allowing for collective input and refinement of your job search strategy.
Guidance on avoiding common pitfalls and maximizing your chances of success in the job market.
What this template helps you achieve
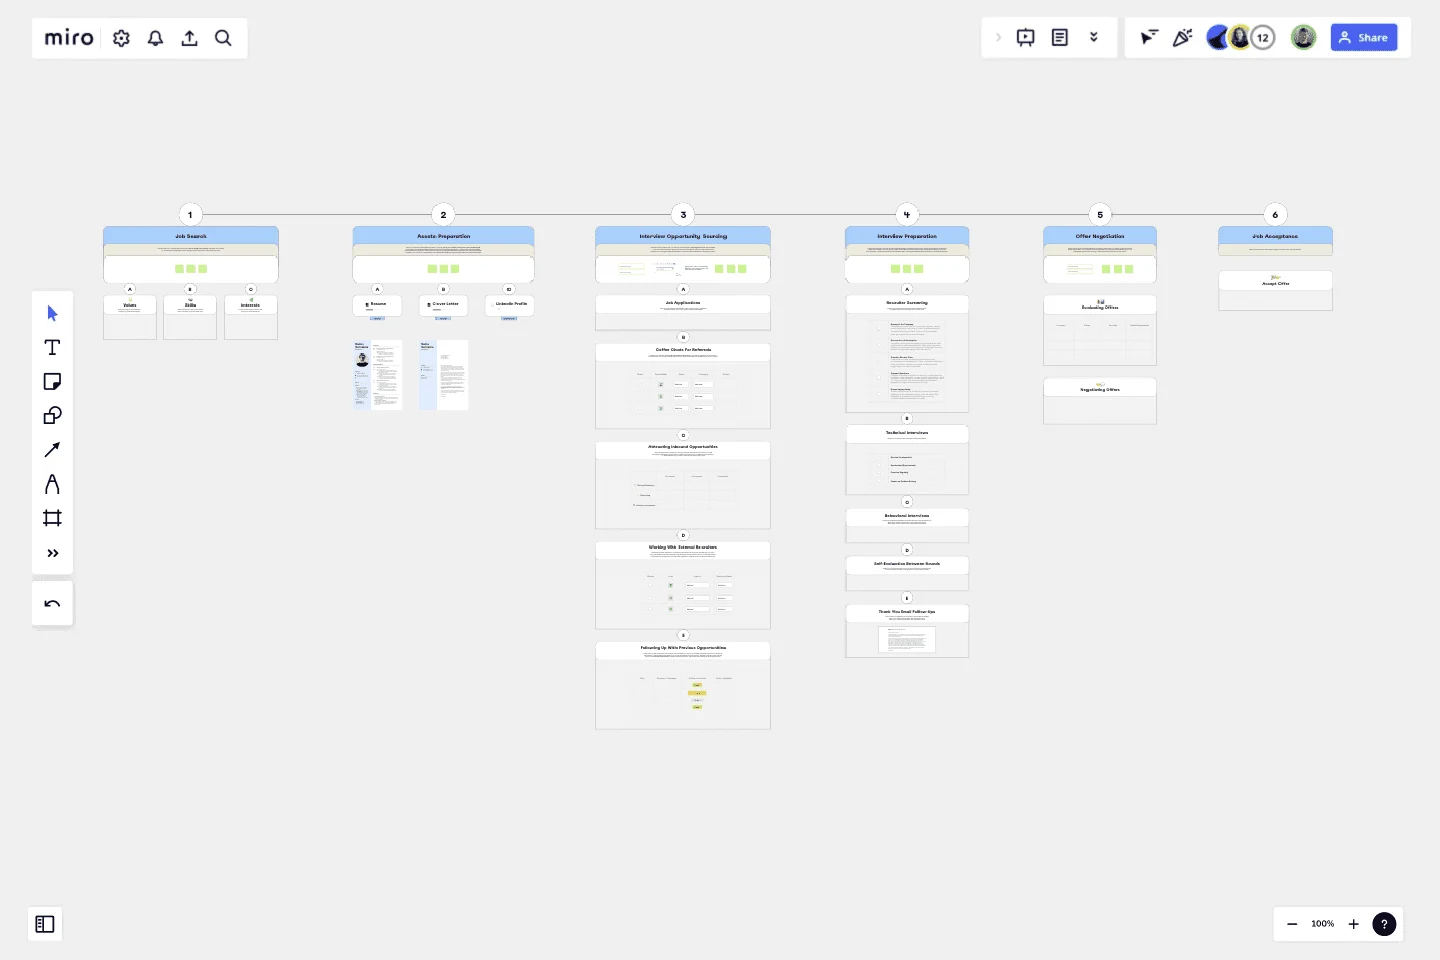
This template offers a structured approach to guide you through every step of the job search process, from initial exploration to final job acceptance. The Job Search Process Diagram features structured sections to help you articulate:
Job search strategy: Define your values, skills, and interests to craft a targeted job search strategy aligned with your career aspirations.
Asset preparation: Fine-tune essential documents such as your resume, cover letter, and LinkedIn profile to present yourself effectively to prospective employers.
Interview opportunity sourcing: Track leads, connections, and avenues for securing interviews to stay organized and proactive in pursuing opportunities.
Interview prep: Equip yourself with the skills and confidence needed to excel in interviews, ensuring a polished performance at every stage.
Offer negotiation: Evaluate and negotiate job offers effectively, considering various factors to secure favorable terms for employment agreements.
Job acceptance: Mark the milestone of job acceptance, celebrating your success as you transition into your new role.
With this template, you can:
Develop a focused and targeted job search strategy tailored to your career goals.
Present yourself effectively to prospective employers, maximizing your chances of securing interviews.
Navigate the interview process confidently and professionally, showcasing your skills and qualifications.
Negotiate job offers confidently, ensuring favorable terms for your employment agreements.
How to use the Job Search Process Diagram
Follow the steps below to get the most out of this template for your next career move:
Add the names of companies/opportunities as they move through the pipeline.
If an opportunity falls through at a certain stage in the process, move the company's name to the “Learning Opportunity” box.
Self-reflect or ask for feedback from your recruiter, and add notes about what you learned.
Include any other notes that you find helpful. For example, add any interview questions you couldn’t answer for future reference, interviewers' names to keep in touch with, etc.
This template was created by Megan Lieu.
Get started with this template right now.
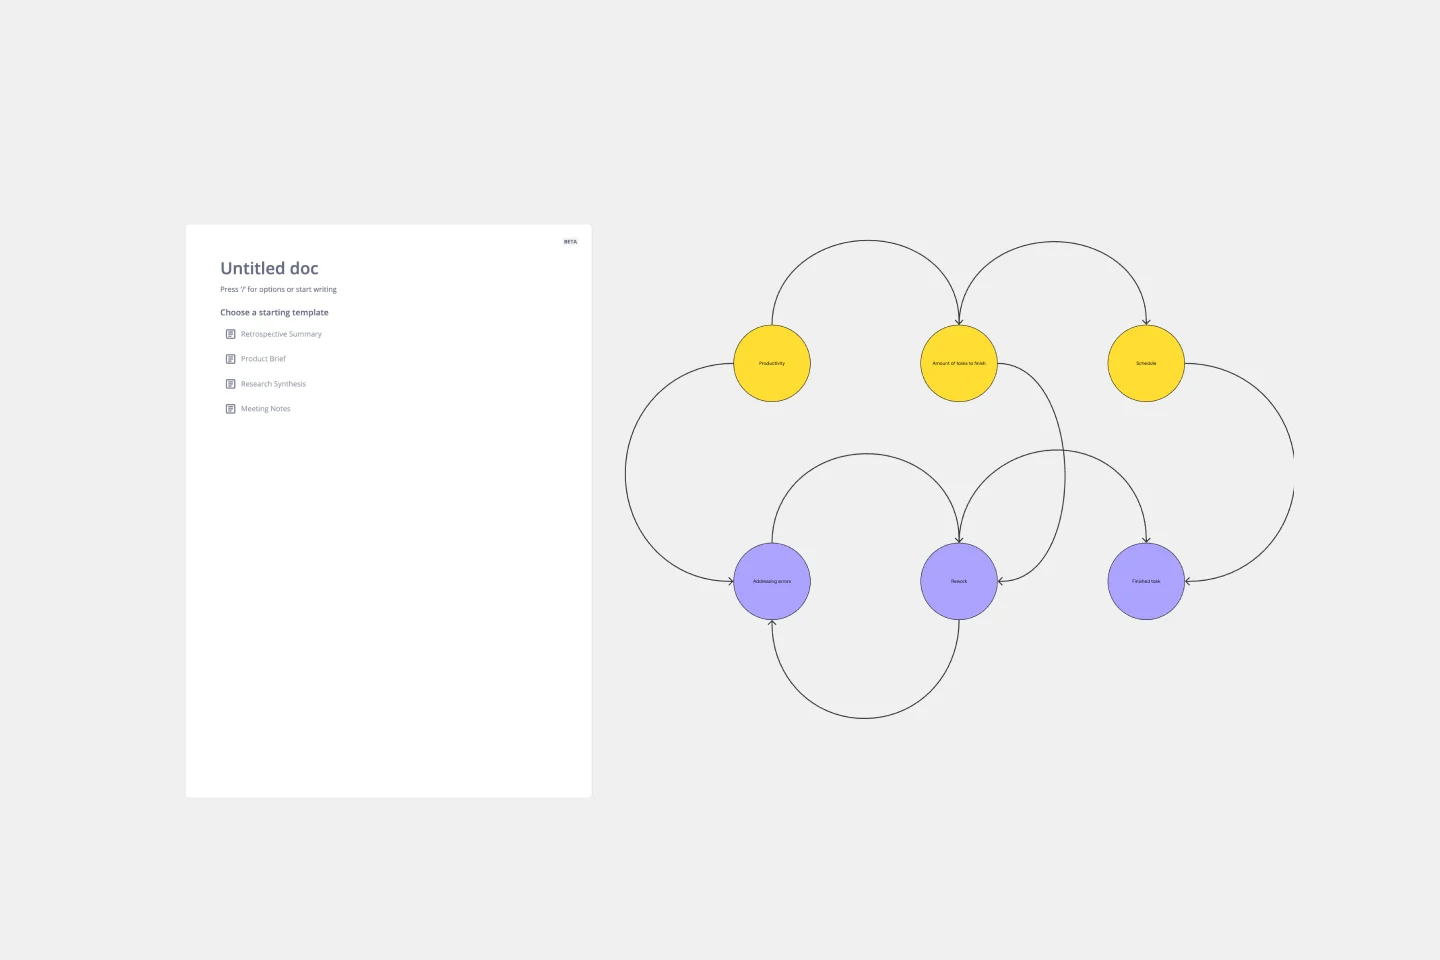
Causal Loop Diagram Template
Works best for:
Diagramming
The Causal Loop Diagram Template offers a structured framework to visualize the intricate interconnections within any system. Its standout benefit is the ability to provide a holistic perspective, ensuring that users don't just see isolated issues but understand the entire web of relationships, ultimately leading to more informed and strategic decision-making.
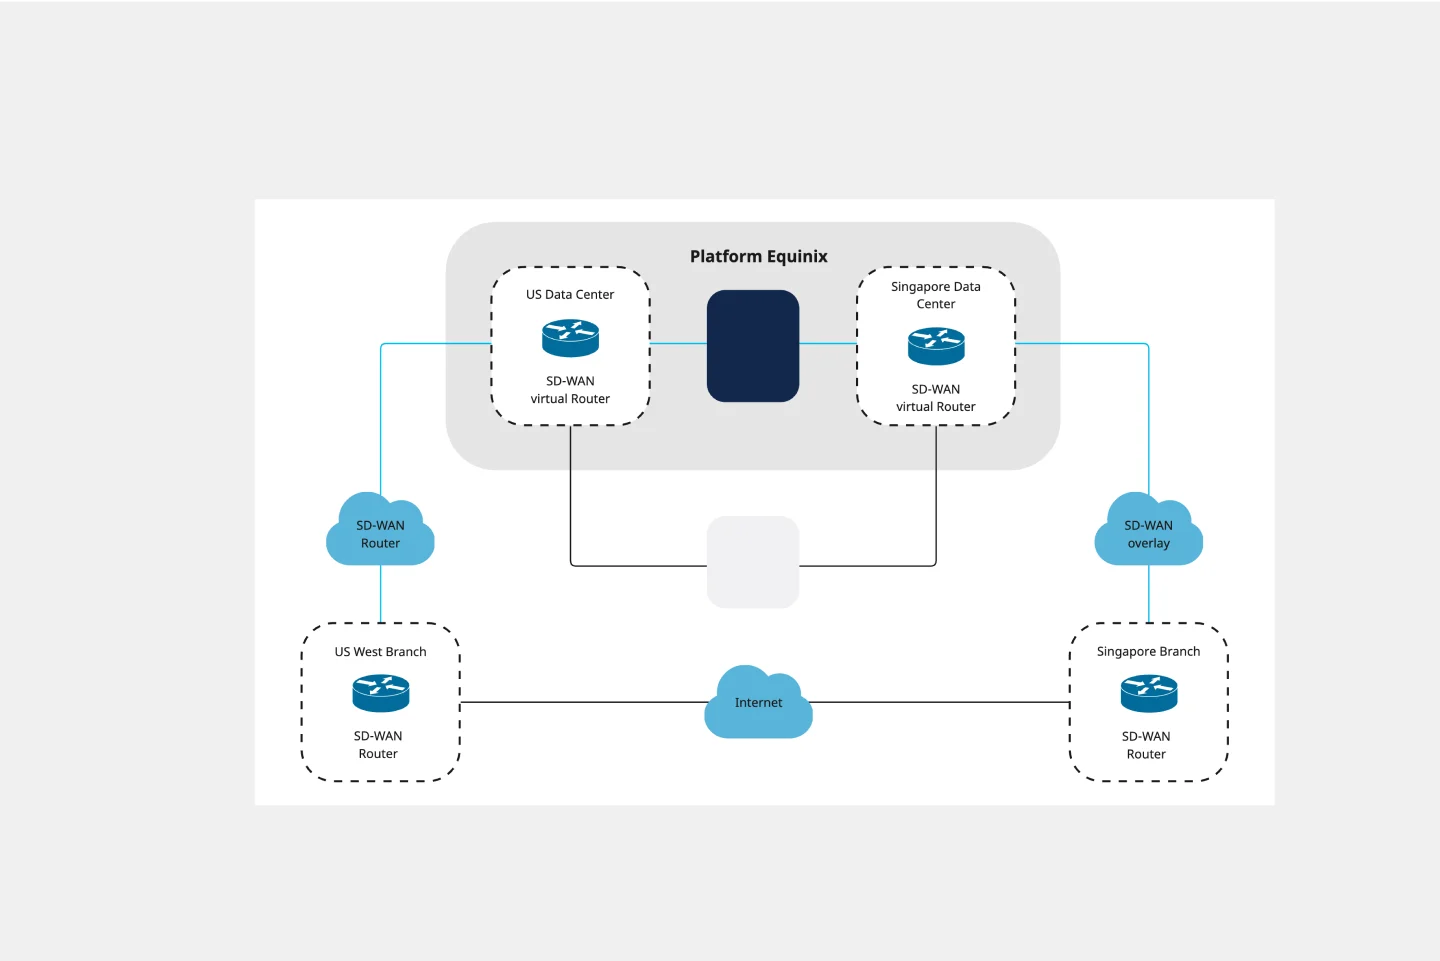
Cisco Data Network Diagram Template
Works best for:
Software Development
Cisco offers data center and access networking solutions built for scale with industry-leading automation, programmability, and real-time visibility. The Cisco Data Network Diagram uses Cisco elements to show the network design of Cisco Data Networks visually.

Opportunity Solution Tree Template
Works best for:
Flowcharts, Product Management, Diagrams
Solving problems — successful companies and productive teams just know how to do it. They’re able to identify many possible solutions, then settle on the one that leads to the desired outcome. That’s the power an Opportunity Solution Tree gives you. Designed by Teresa Torres, a product discovery coach, this mind map breaks down your desired outcome into opportunities for the product to meet user needs, then gives your team an effective way to brainstorm potential solutions.
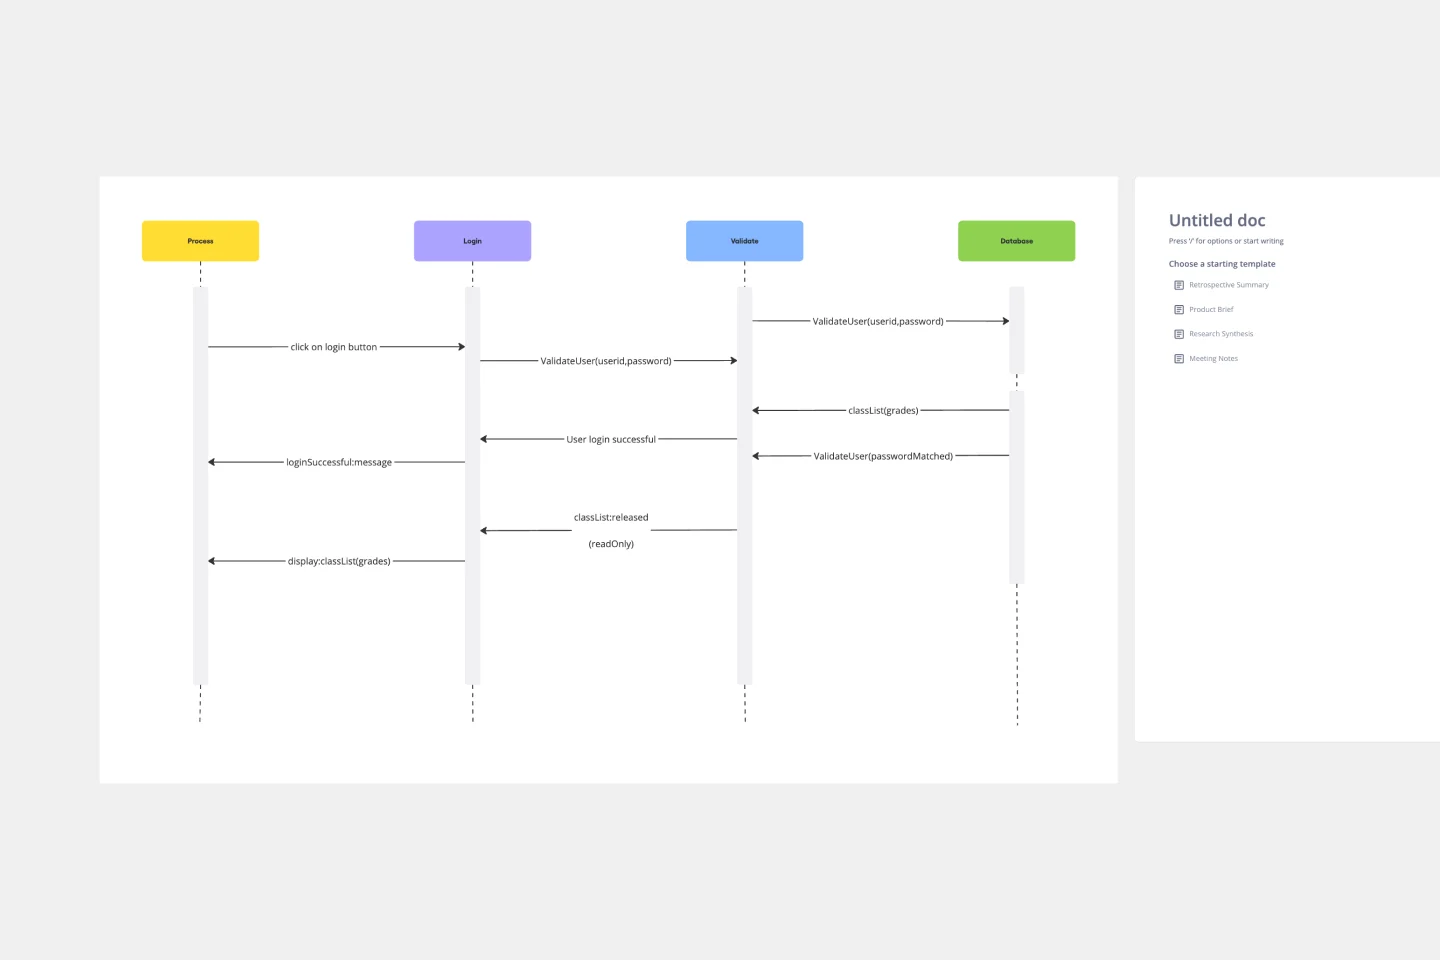
Login Sequence Diagram Template
Works best for:
Diagramming, Technical Diagramming
The UML Sequence Login Diagram Template is a valuable tool for visualizing user authentication processes. It breaks down complex login sequences into clear, visual components, facilitating collaborative understanding among team members, regardless of their technical expertise. This shared understanding is crucial for ensuring all stakeholders, from developers to project managers, are on the same page, leading to efficient decision-making and a smoother development process. The template's ability to translate technical details into an accessible format streamlines communication and significantly reduces the likelihood of misinterpretation or oversight, making it an essential asset in any software development project.
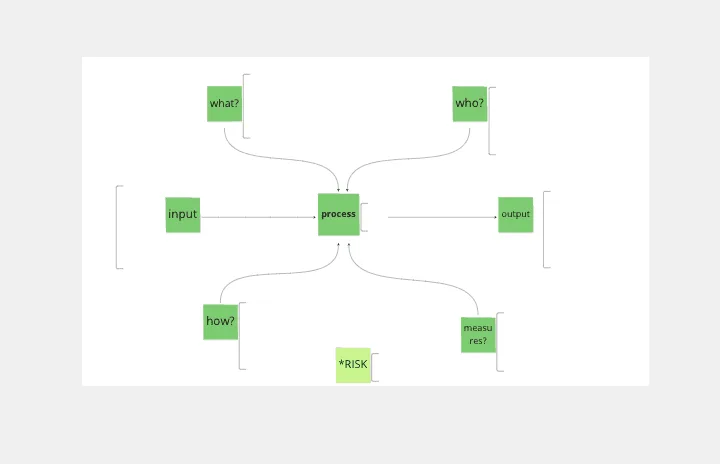
Turtle Diagram for BA
Works best for:
Diagramming
The Turtle Diagram for BA template offers a visual framework for defining and auditing business processes according to ISO 9001 standards. It provides elements for documenting process inputs, outputs, activities, and controls. This template enables organizations to ensure compliance, identify process improvements, and enhance quality management practices. By promoting systematic process documentation and auditability, the Turtle Diagram for BA empowers organizations to achieve and maintain ISO 9001 certification, demonstrating commitment to quality and continuous improvement.
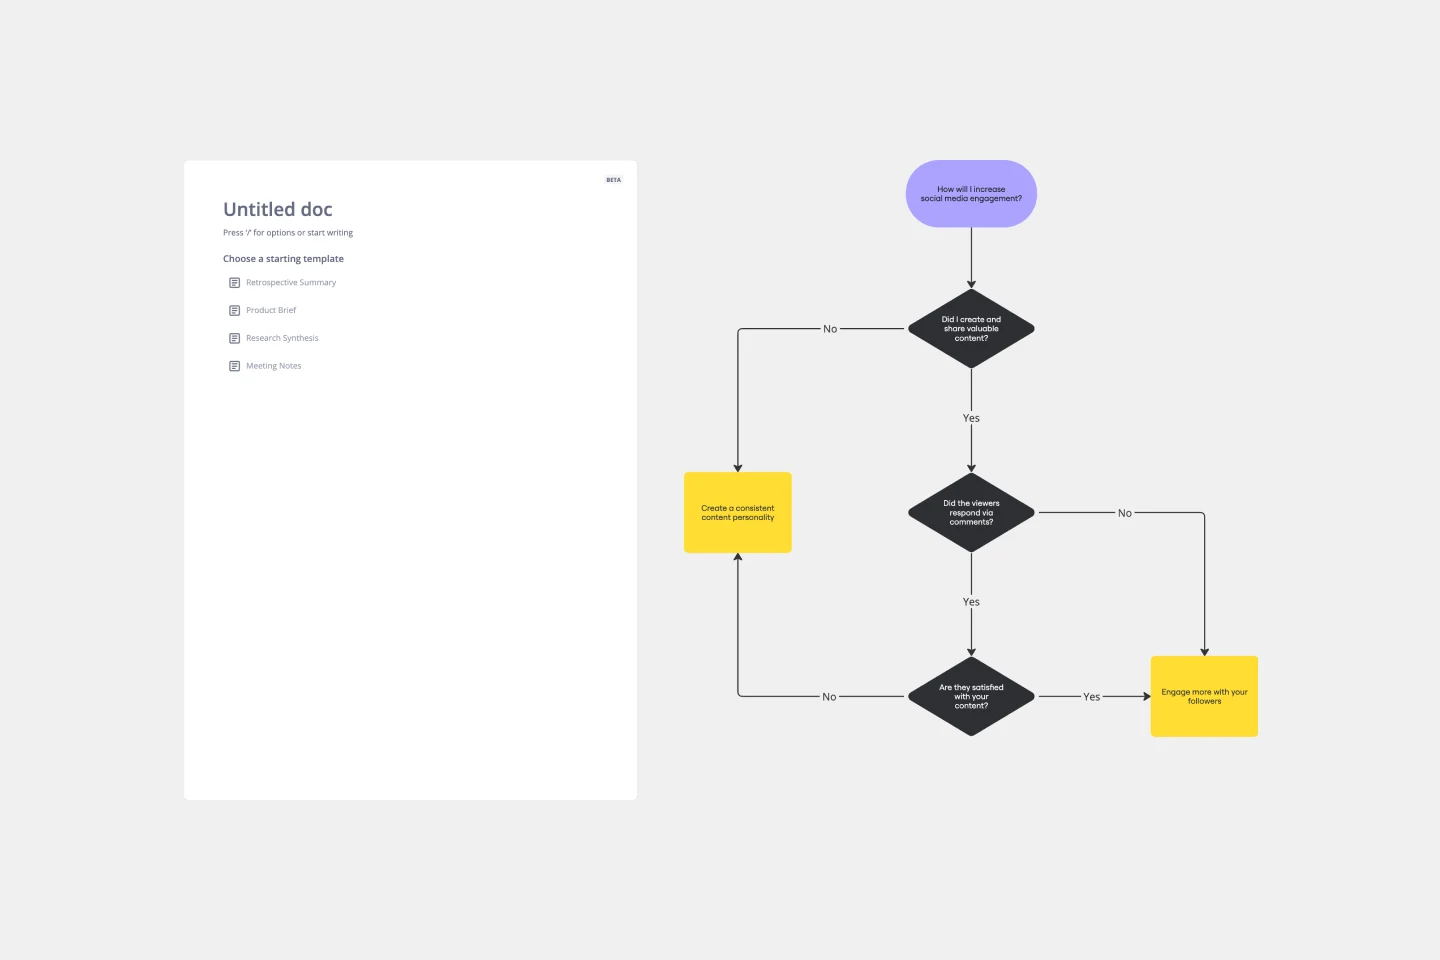
Yes No Flowchart Template
Works best for:
Diagramming
The Yes-No Flowchart Template is a simple and efficient tool that helps to simplify complex decision-making processes into clear and easy-to-follow steps. This template uses standard shapes to illustrate processes, decisions, and outcomes, with arrows that guide users from one action point to the next based on binary 'yes' or 'no' decisions. Its most prominent benefit is its ability to bring clarity to decision-making. By presenting processes visually, teams can effortlessly understand and navigate complex scenarios, ensuring that each step is transparent and reducing the potential for misunderstandings or missteps.