Insightful Venn
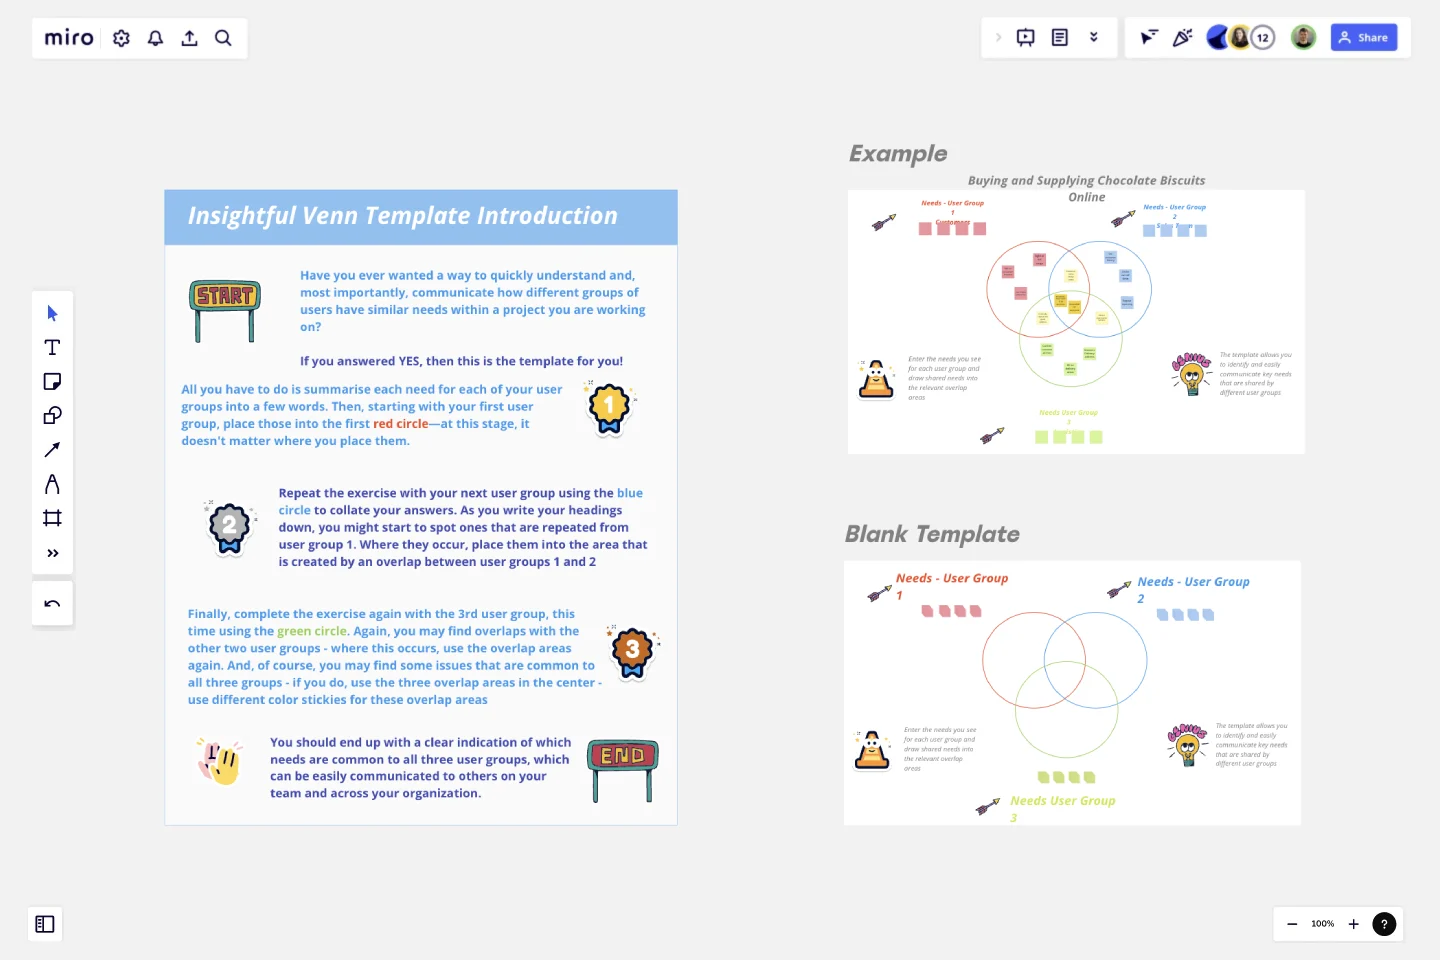
Have you ever wanted a way to quickly understand and, most importantly, communicate how different groups of users have similar needs within a project you are working on?
If you answered YES, then this is the template for you!
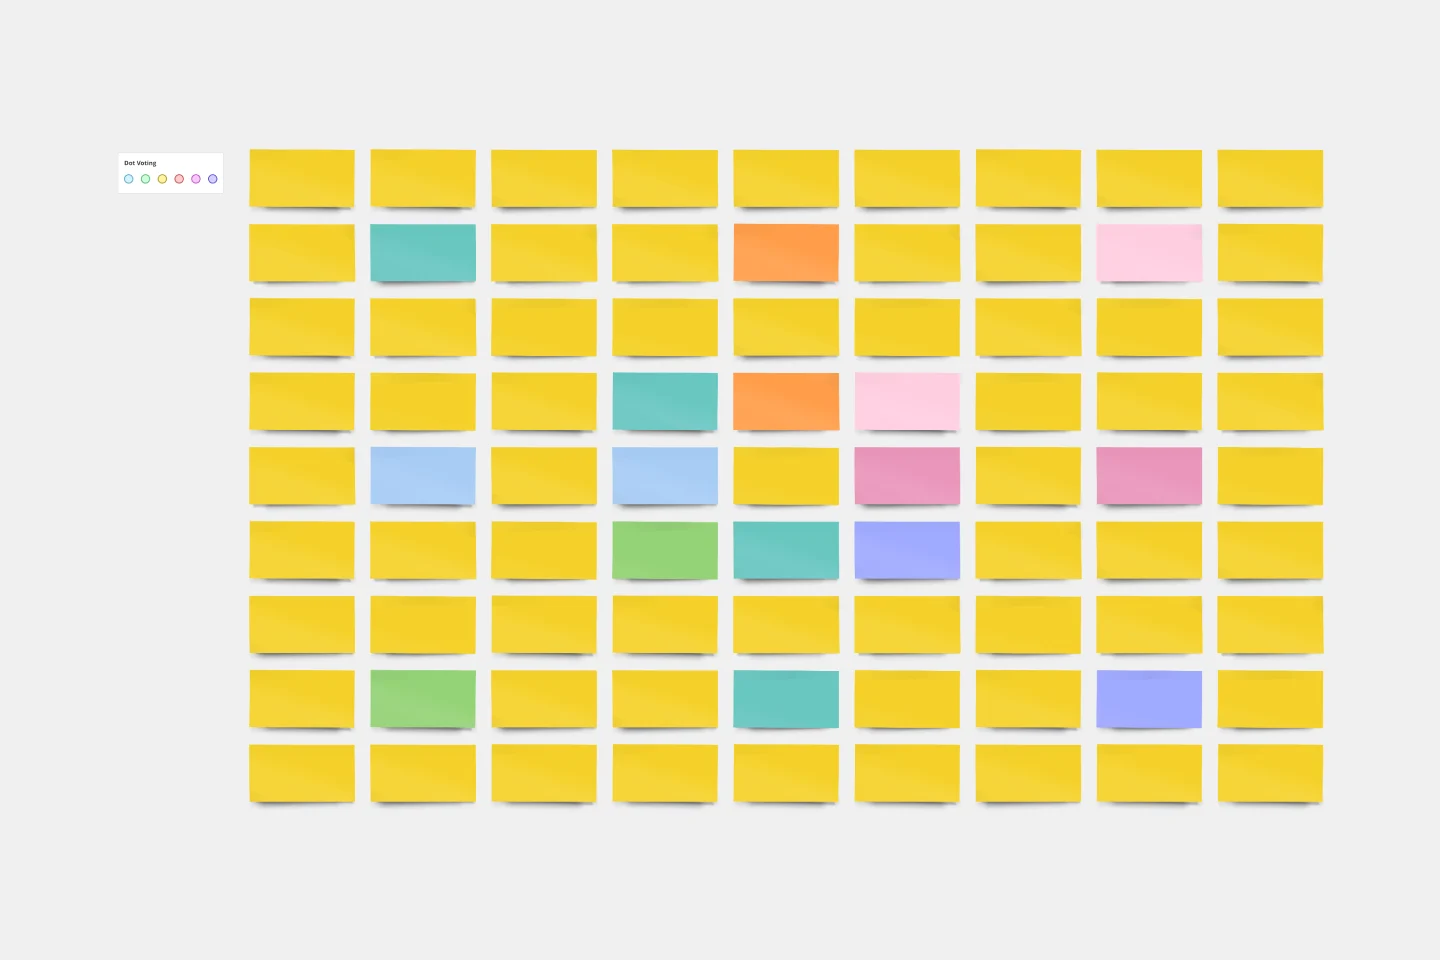
All you have to do is summarise each need for each of your user groups into a few words. Then, starting with your first user group, place those into the first red circle—at this stage, it doesn't matter where you place them.
Repeat the exercise with your next user group using the blue circle to collate your answers. As you write your headings down, you might start to spot ones that are repeated from user group 1. Where they occur, place them into the area that is created by an overlap between user groups 1 and 2.
Finally, complete the exercise again with the 3rd user group, this time using the green circle. Again, you may find overlaps with the other two user groups - where this occurs, use the overlap areas again. And, of course, you may find some issues that are common to all three groups - if you do, use the three overlap areas in the center - use different color stickies for these overlap areas.
You should end up with a clear indication of which needs are common to all three user groups, which can be easily communicated to others on your team and across your organization.
This template was created by Mark Hirst.
Get started with this template right now.
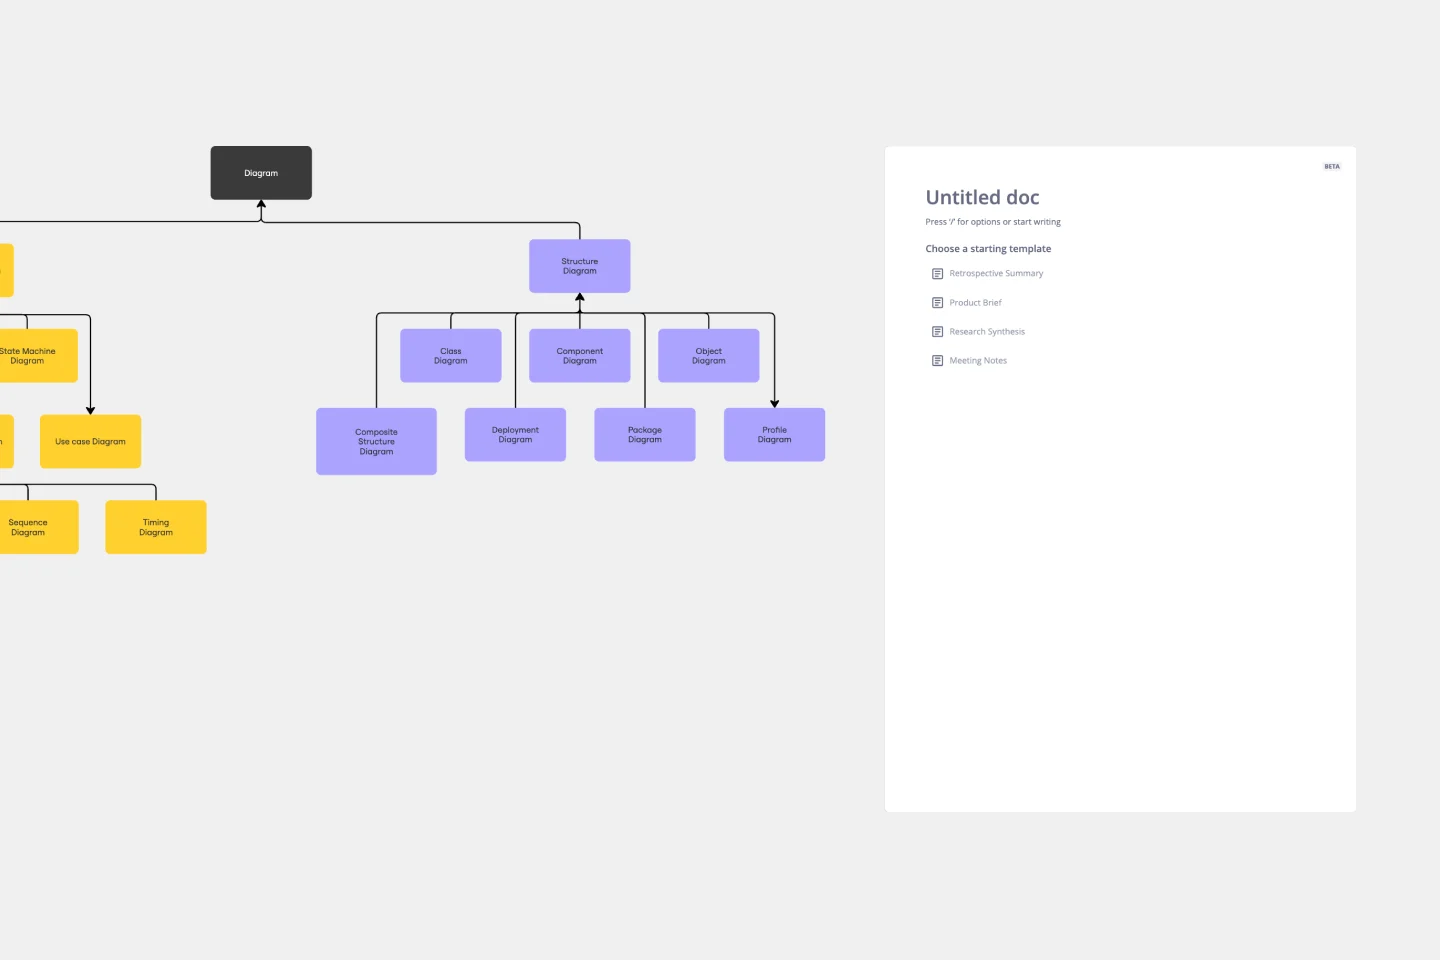
UML Class Diagram Template
Works best for:
UML Class Diagram Template, Mapping, Diagrams
Get a template for quickly building UML class diagrams in a collaborative environment. Use the UML class diagram template to design and refine conceptual systems, then let the same diagram guide your engineers as they write the code.
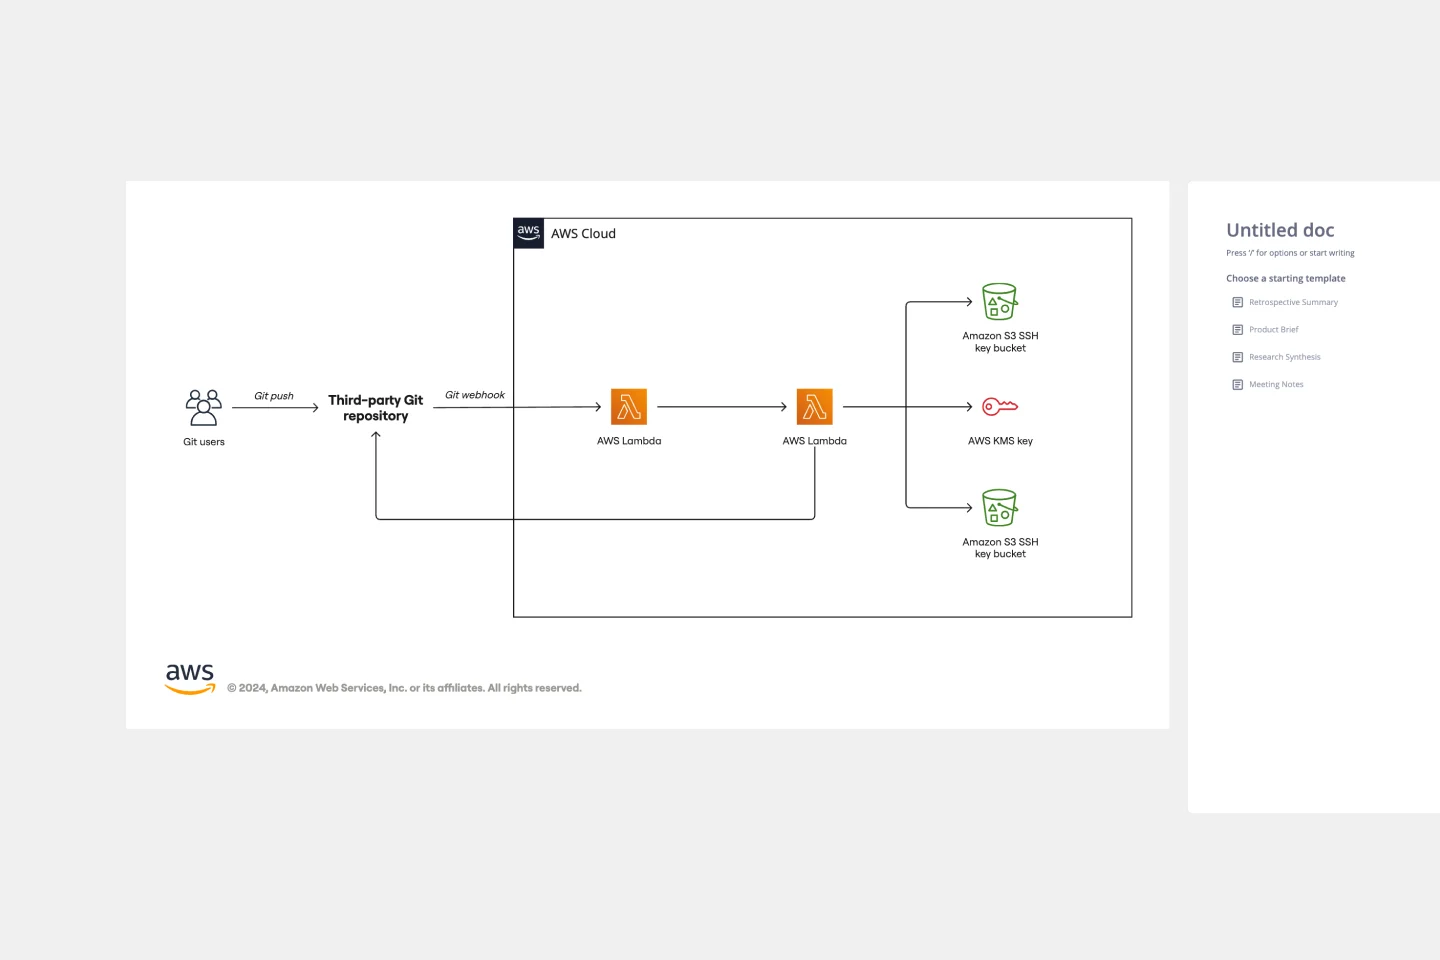
AWS Git to S3 Webhooks Template
Works best for:
Software Development, Diagrams
The AWS Git to S3 Webhooks Template is a visual representation of Git webhooks with AWS services Quick Start architecture. You can now have an overview of your AWS architecture with Miro’s AWS Git to S3 Webhooks Template, track your cloud solutions easily, and optimize processes like never before.
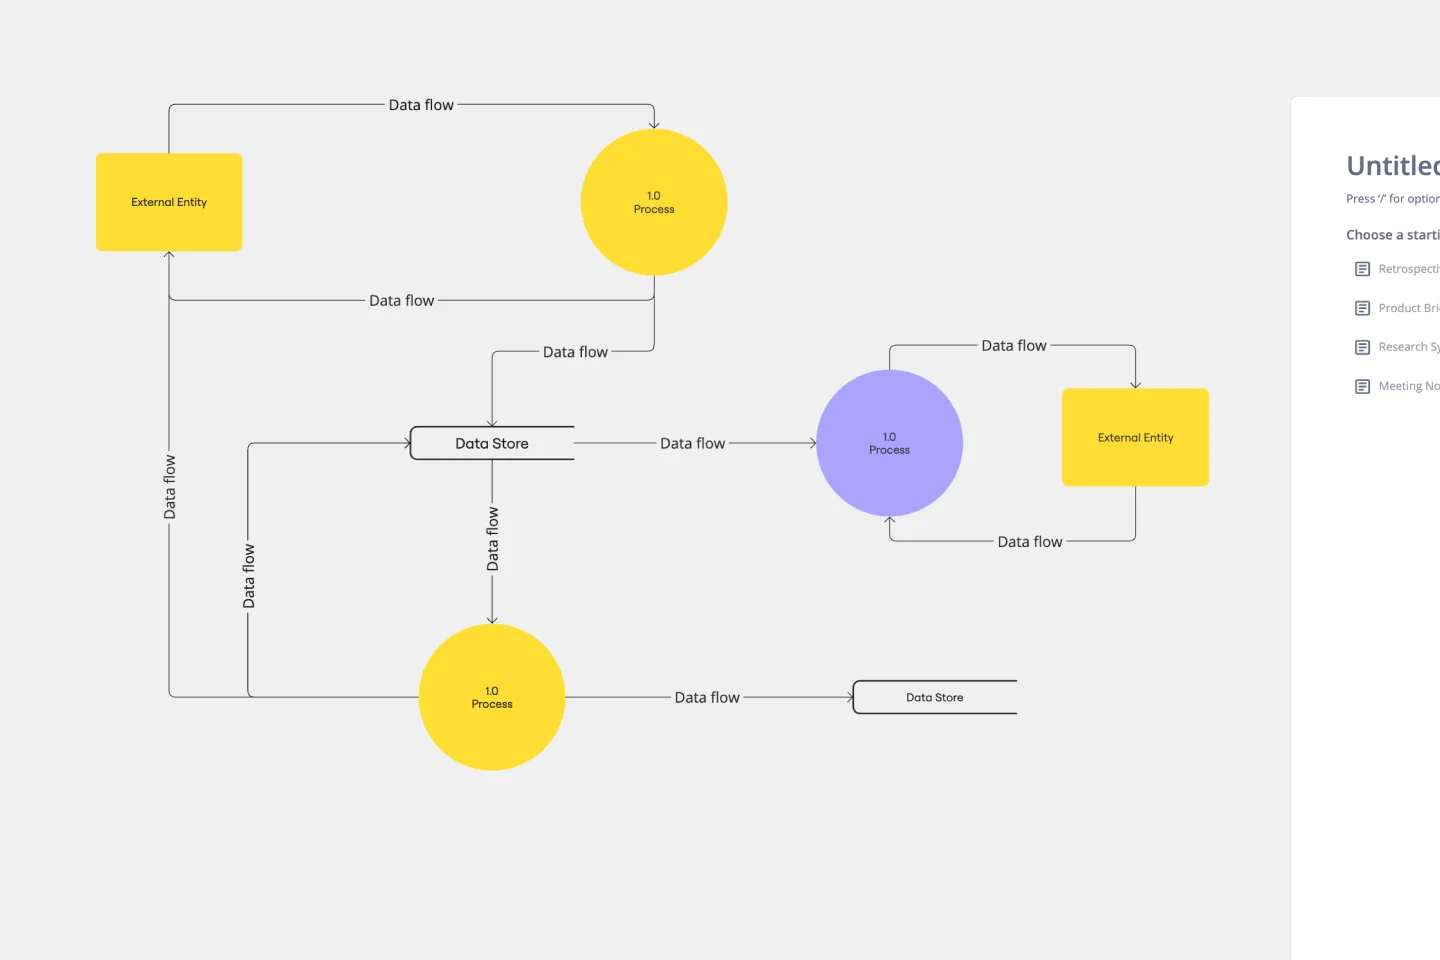
Data Flow Diagram Template
Works best for:
Flowcharts, Software Development, Diagrams
Any process can get pretty complex, especially when it has multiple components. Get a better grasp of your process through a data flow diagram (DFD). DFDs create a simple visual representation of all components in the flow of data and requirements in an entire system. They’re most often used by growth teams, data analysts, and product teams, and they’re created with one of three levels of complexity—0, 1, or 2. This template will help you easily build the best DFD for your process.
Web Diagram Template
Miro's Web Diagram Template simplifies complex project organization and promotes effective communication. It allows users to easily connect elements and gain a comprehensive understanding of complex relationships, making it a versatile and invaluable asset for diverse projects.
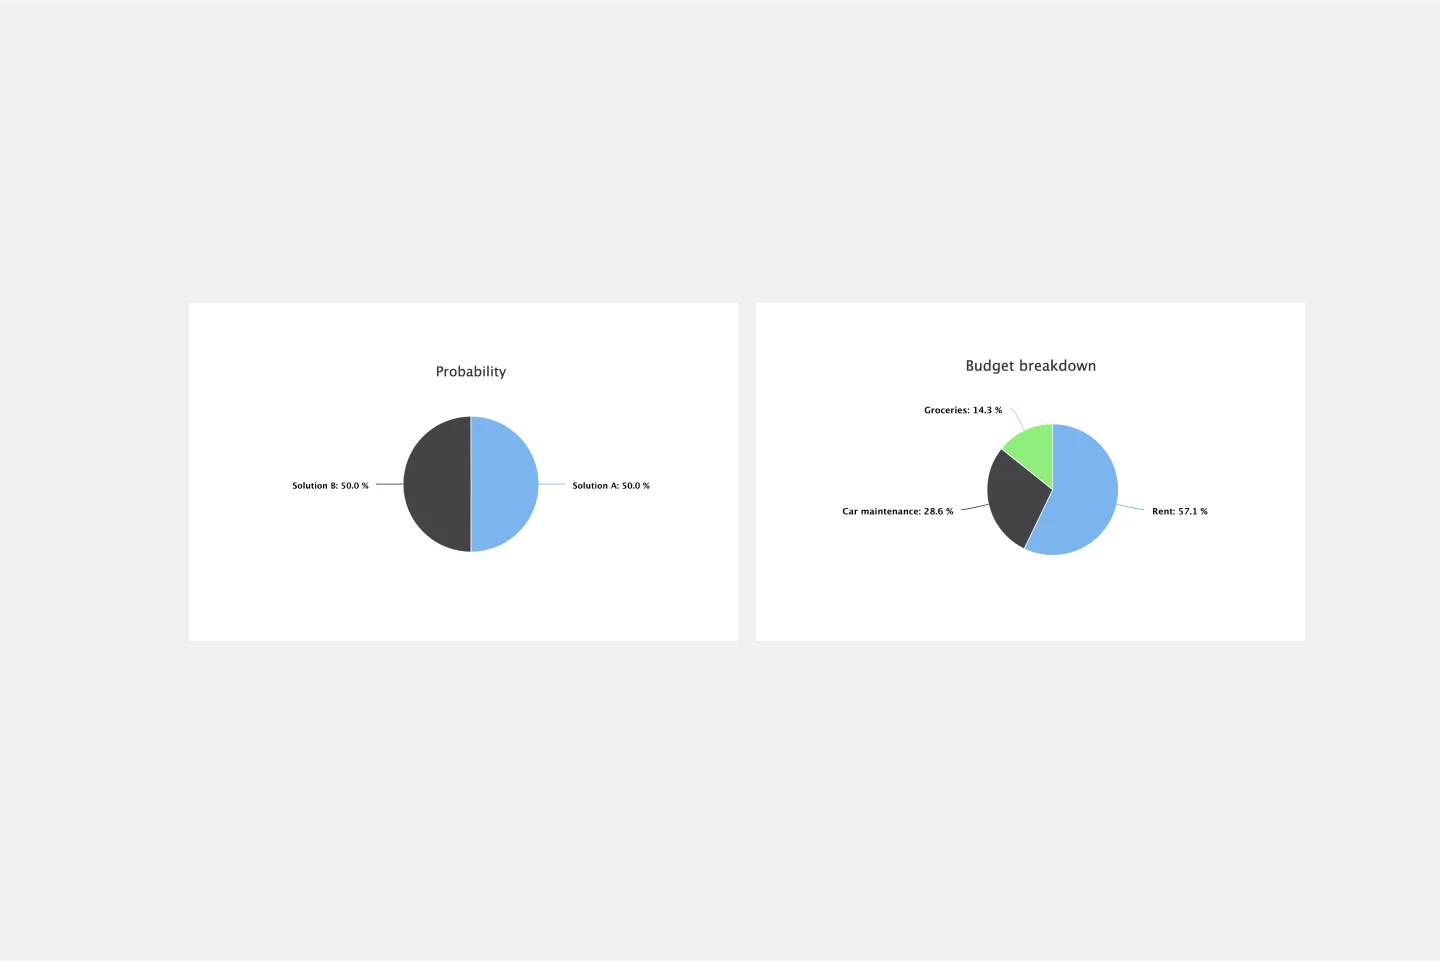
Pie Chart Template
Works best for:
Education, Operations
Pie charts are an excellent way to present relationships between datasets graphically, where you can quickly compare information and see contrast right away. Professionals from many fields use pie charts to support their presentations and enrich their storytelling as it’s one of the most commonly used data charts.
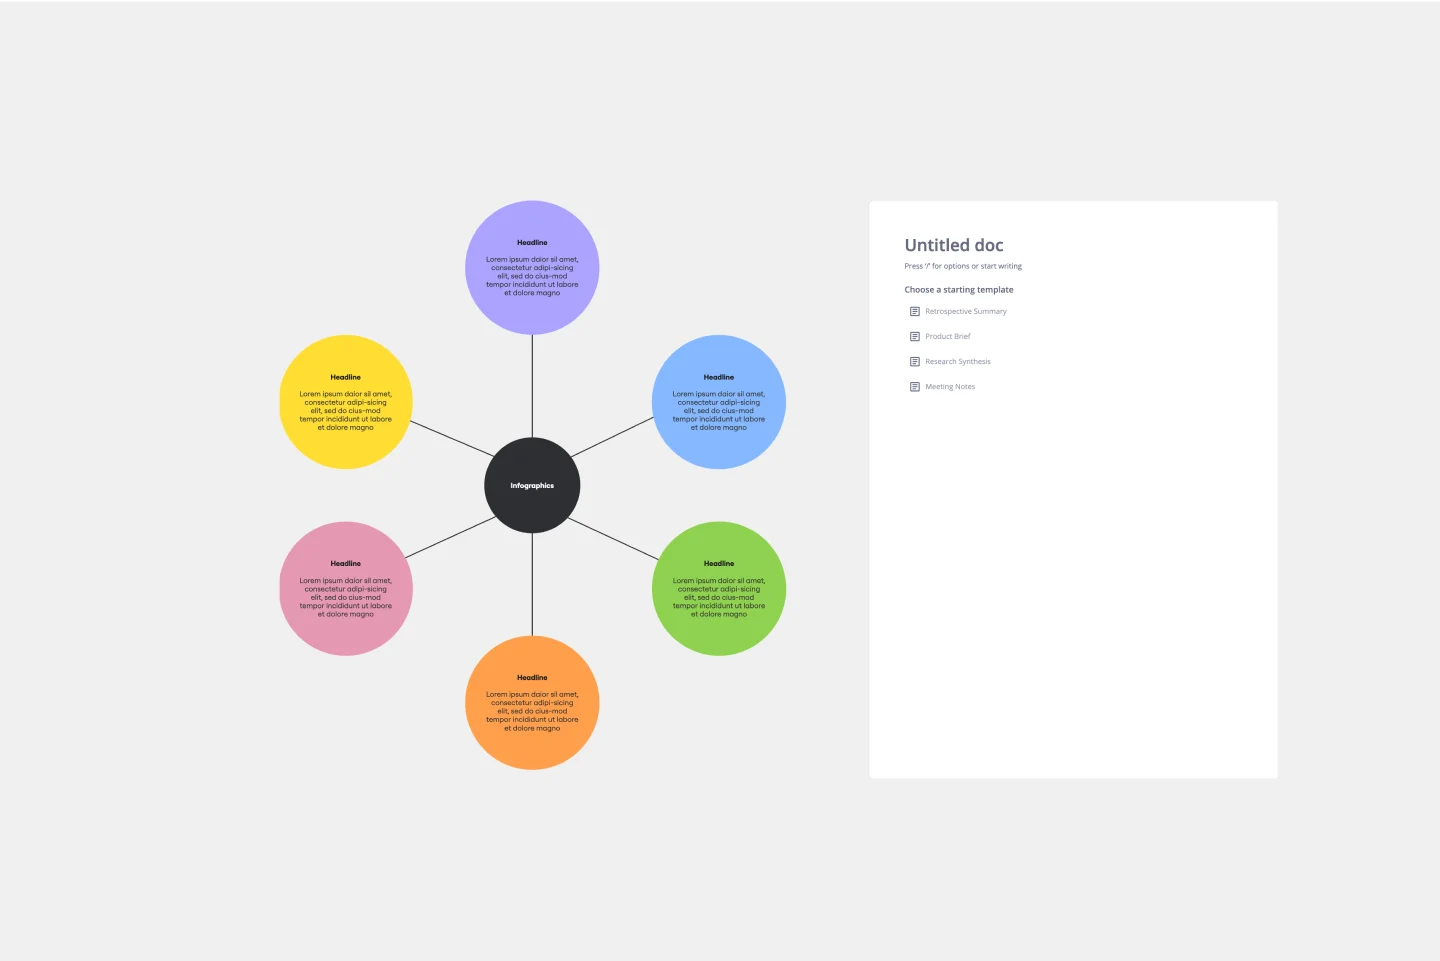
Lotus Diagram Template
Works best for:
UX Design, Ideation, Diagrams
Even creative thinkers occasionally need help getting their creative juices flowing. That's where a lotus diagram comes in. It'll empower you to run smoother, more effective brainstorming sessions. This creative-thinking technique explores ideas by putting the main idea at the diagram center and ancillary concepts in the surrounding boxes. This template gives you an easy way to create Lotus Diagrams for brainstorms, as well as an infinite canvas for the endless ideas generated.