ICS Org Chart Template
Use the ICS Org Chart Template to map the Incident Command System's hierarchy visually. Navigate roles and responsibilities with ease.
About the ICS Org Chart Template
In today's work environment, having tools that provide flexibility and clarity is crucial, particularly when it comes to coordinating teams and ensuring seamless communication. The ICS Org Chart Template is an excellent solution in this regard. ICS, which stands for Incident Command System, is a standardized all-hazard incident management concept used in the United States. It is a complex system that demands careful organization and structure.
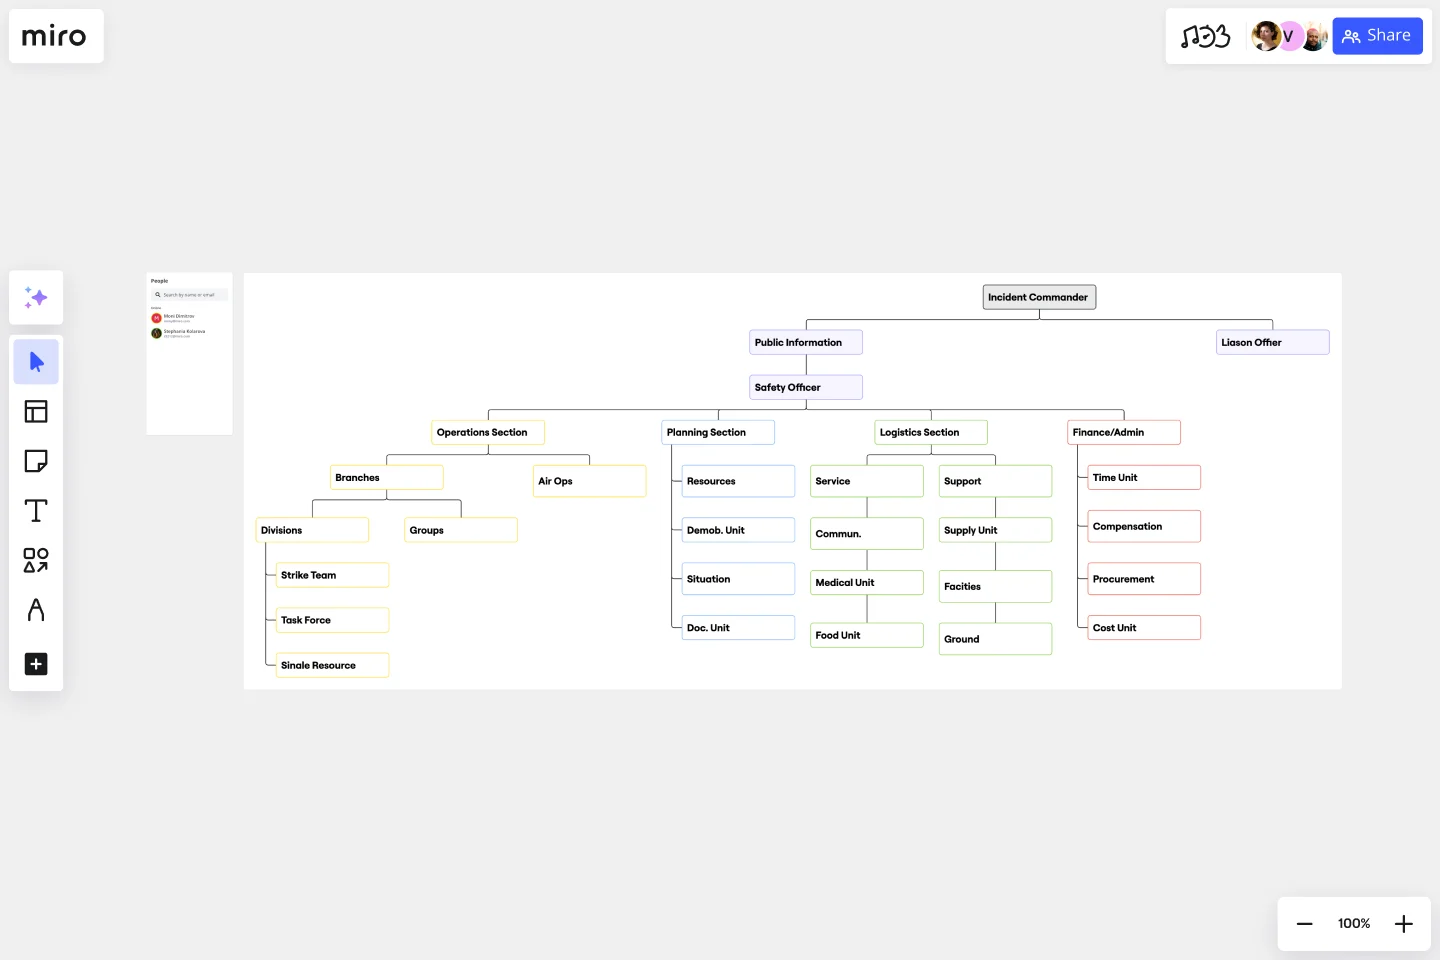
The ICS Org Chart Template is specifically designed to help teams understand the structure of this system. It provides a clear and visual representation of roles, responsibilities, and chains of command, making it an invaluable tool for any organization.
This template offers a structured blueprint of the ICS hierarchy, which can be easily customized per the user's requirements. Each section of the template represents a specific area of responsibility within the ICS, and the sections are connected via connector lines to show the flow of command and reporting lines. With clearly defined roles for each position, from the Incident Commander to the various branches and units, users can navigate the complex ICS web with ease and make necessary modifications according to their specific needs.
How to use the ICS Org Chart Template
Customize the template: Click on any shape or connector line. You'll notice that editing them is straightforward—resize, relabel, or reposition as needed.
Expand: If your organizational structure requires more layers or units, add more shapes and connect them using the automated diagramming features. This ensures consistency in design and flow.
Add context: To provide more detailed information, you can effortlessly drag and drop any artifact onto the board. Whether it's a document, image, or link, it integrates seamlessly, enriching the context.
Why should you use an ICS Org Chart Template?
Clarity and visualization: It provides a clear and visual representation of roles and reporting lines, ensuring that everyone understands their responsibilities and who they should report to.
Standardization: It maintains consistency in the representation of the ICS structure, which is essential for effective communication.
Flexibility: Although it offers a standardized view, the template is highly customizable to cater to various organizational needs.
Efficiency: It reduces the time spent on creating an organizational chart from scratch and ensures rapid onboarding of team members for efficient task execution.
Integration: It allows easy addition of external resources, ensuring a comprehensive view of processes and responsibilities.
Miro is the perfect organizational chart builder to help visualize and understand your organization's hierarchical structure and reporting lines between roles. If you're interested in learning more about organizational charts you can read our in-depth guide.
Can I integrate external links and resources into the chart?
The template allows seamless integration of external artifacts, providing a richer context.
How many levels can I add to the chart?
The template is flexible, allowing you to add as many levels as required by your organizational structure.
Is the template suitable for organizations outside the U.S.?
While the ICS system originates from the U.S., the principles of organization and structure are universal. The template can be adapted and used by organizations globally.
Do I need prior knowledge of ICS to use this template?
While prior knowledge is helpful, the template is intuitive enough for those unfamiliar with ICS, serving as both a learning tool and an organizational asset.
Get started with this template right now.
Task Analysis Diagram Template
Works best for:
Diagramming
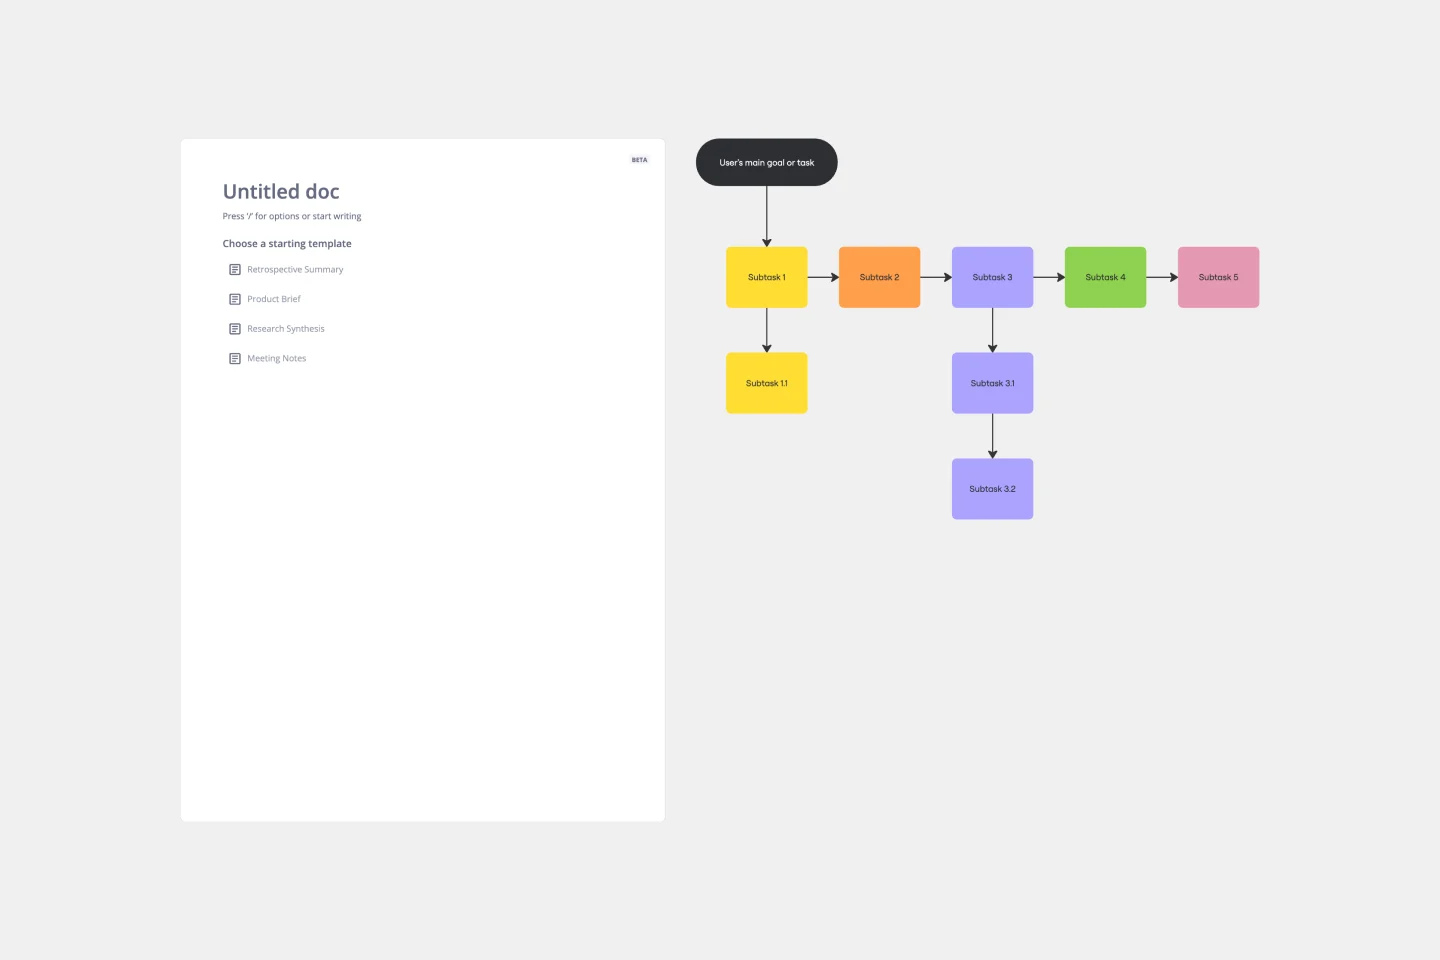
The Task Analysis Diagram Template is a helpful tool that simplifies complex tasks by breaking them down into smaller, more manageable steps. This strategic approach brings clarity and ensures a systematic method for tackling complex user paths. The template's most significant advantage is its precision, as it maps out every detail of a task to guarantee that nothing is missed. This results in more efficient operations.
UML Class Messaging System Template
Works best for:
UML
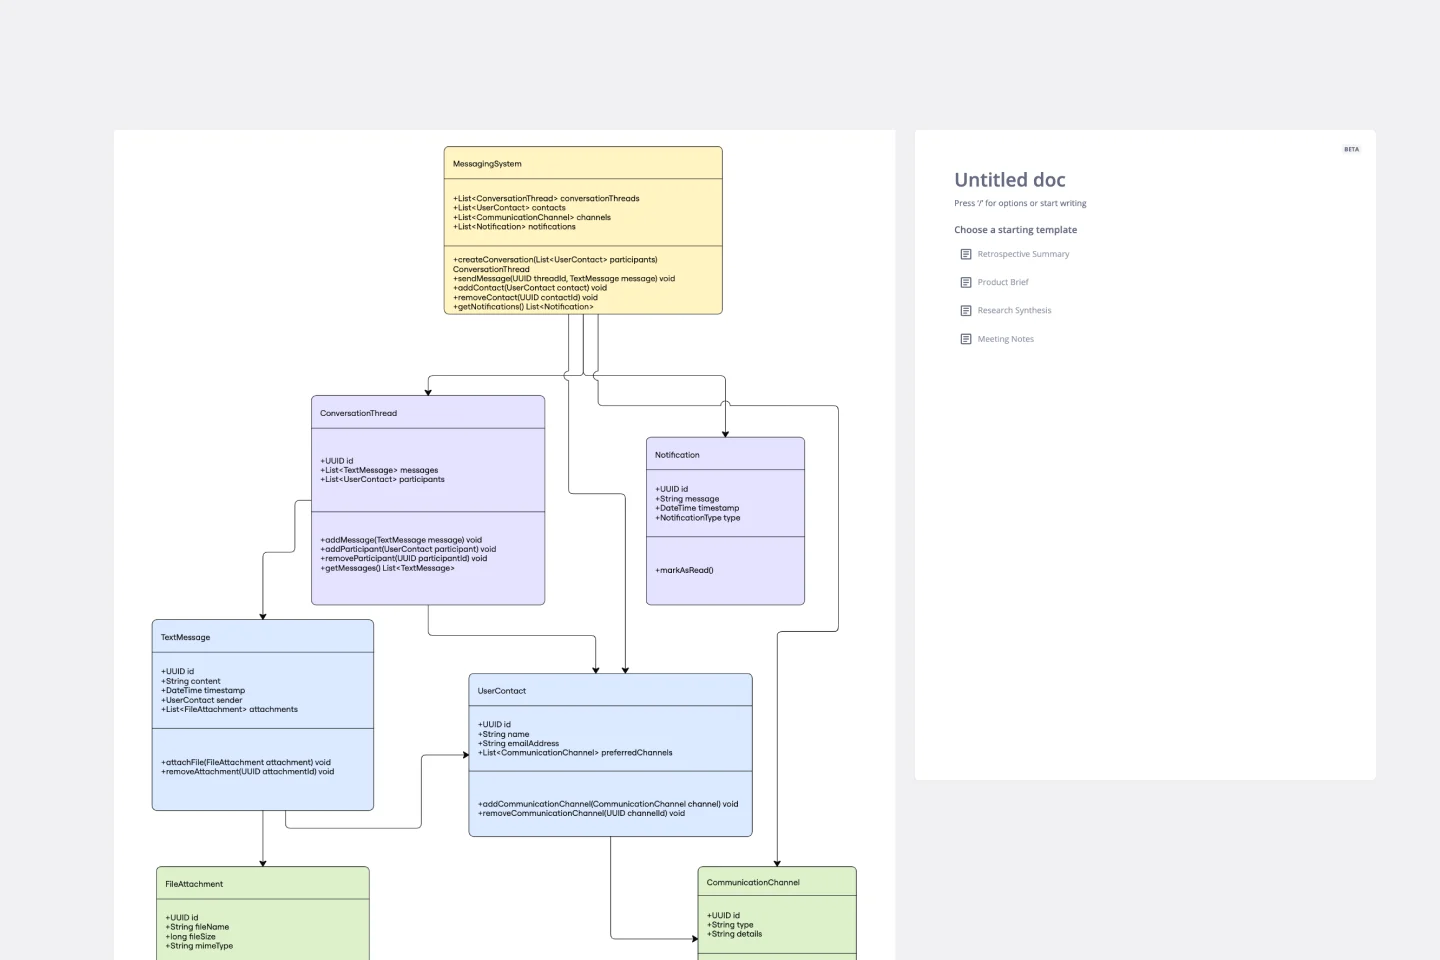
The UML Class Messaging System Template streamlines the process of designing and analyzing messaging systems. It allows users to visually map out the structure of a system by detailing classes, their attributes, operations, and the relationships among objects. This template is particularly useful for illustrating the functionality of a messaging system, including the management of text messages, conversation threads, user contacts, notifications, and channels. It offers a clear visual representation of how all these elements interact within the system, making it an invaluable resource for developers, designers, and stakeholders aiming to enhance communication and reduce errors in the development phase.
Driver Diagram Template
Works best for:
Diagramming
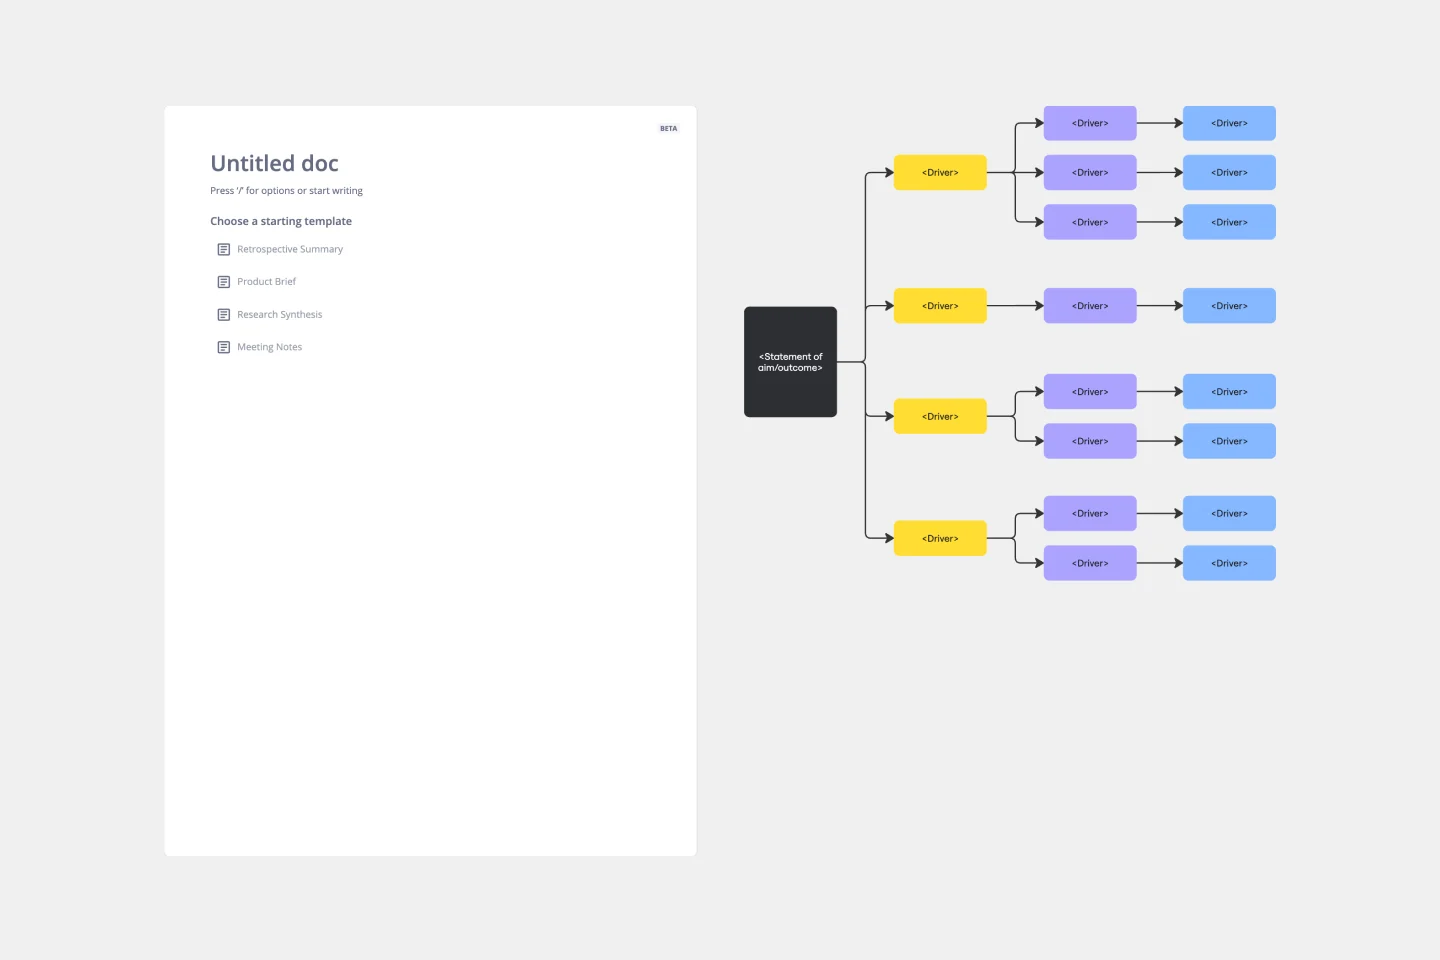
The driver diagram template is a strategic visual tool that helps teams map out their primary objectives and break them down into actionable components. It presents goals, drivers, and specific change ideas in a coherent and interconnected format, ensuring clarity of objective. By doing so, every team member is aligned towards a common endpoint, fostering unified efforts. The visual nature of the template simplifies complex objectives, making it easier for teams to stay on track and measure their progress effectively.
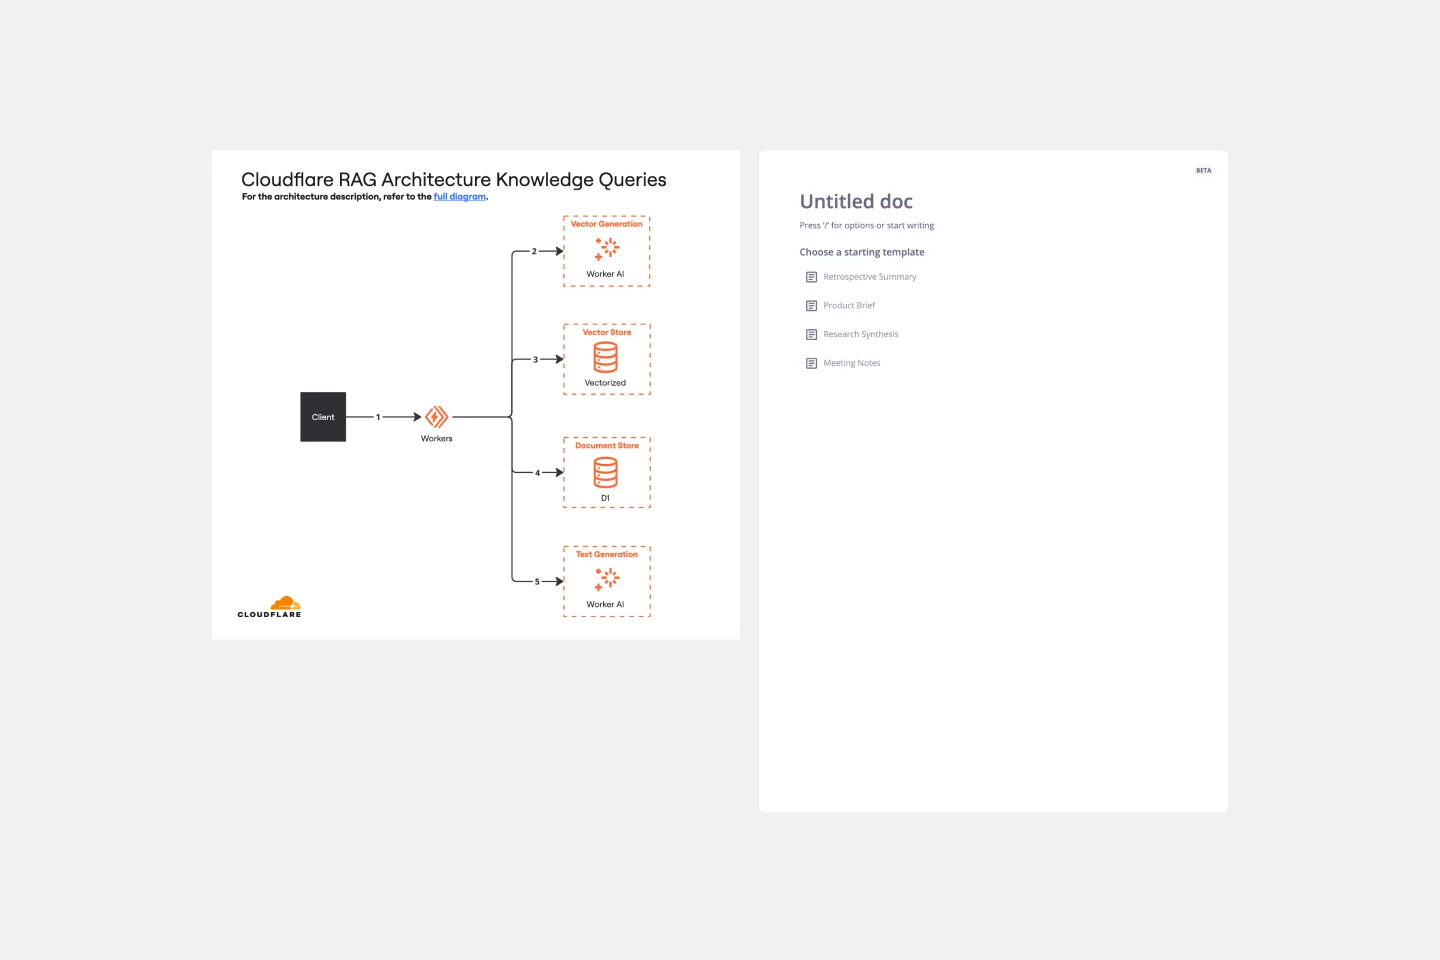
Cloudflare RAG Architecture Knowledge Queries Template
The Cloudflare RAG Architecture Knowledge Queries template is a cutting-edge tool designed to streamline the process of diagramming and understanding the intricate architecture of Cloudflare's Retrieval Augmented Generation (RAG) system. This template is a boon for teams aiming to visualize, query, and optimize Cloudflare's infrastructure collaboratively.
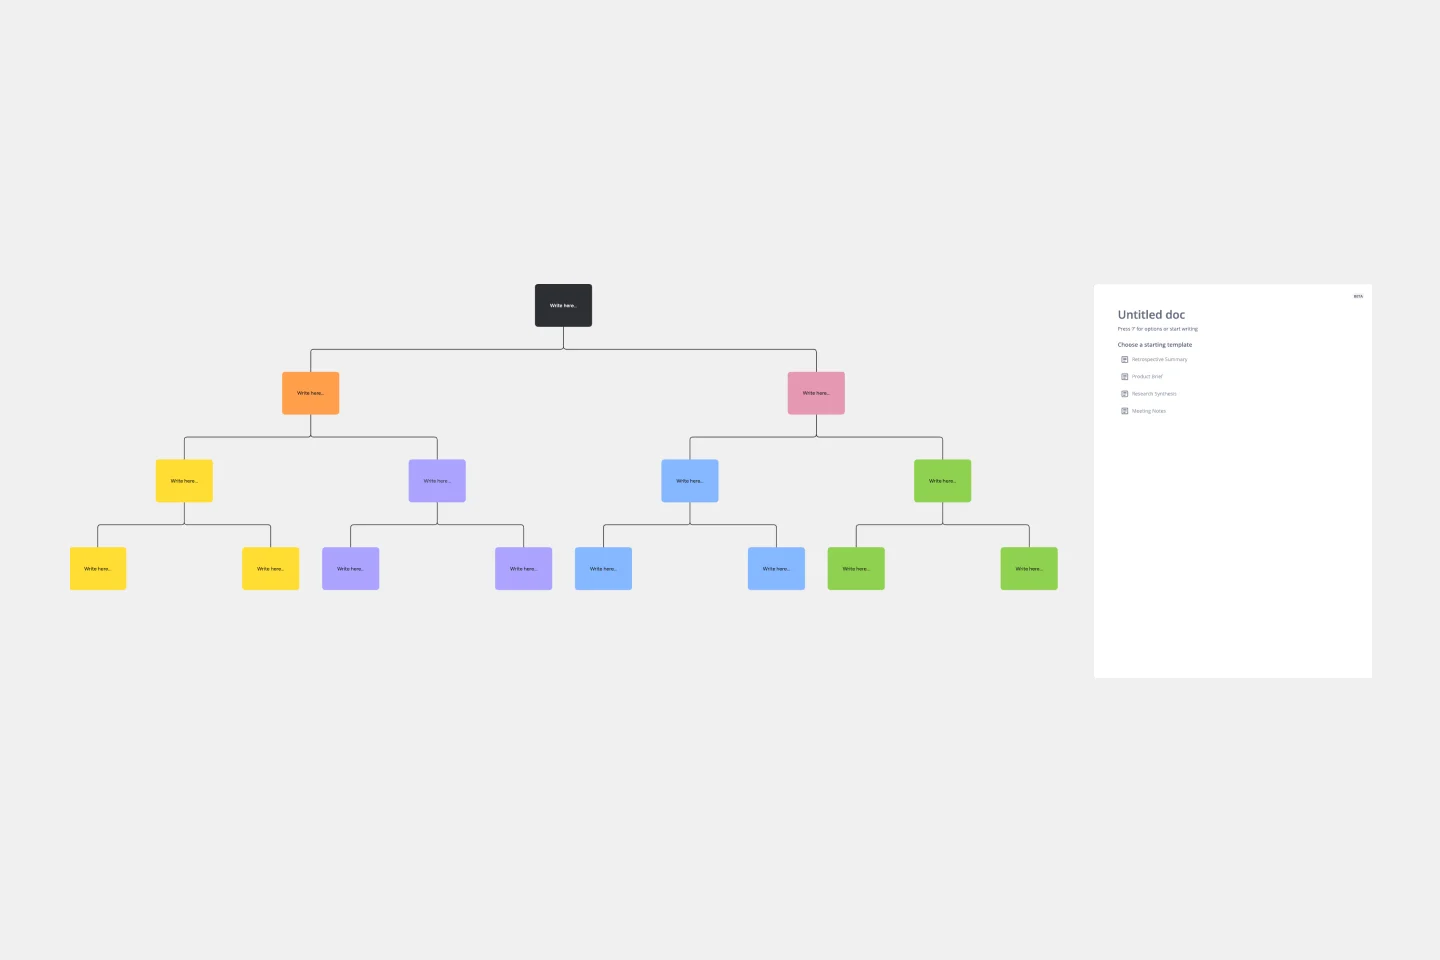
Tree Diagram Template
Works best for:
Diagramming
The tree diagram template helps you organize and present complex information. One of its key benefits is its ability to provide unparalleled visual clarity. It enables you to simplify complicated ideas into a structured, hierarchical format, making it easier to understand and communicate. This template enhances brainstorming sessions, project planning, and decision-making processes by mapping out relationships and dependencies clearly and effortlessly. You can now say goodbye to information overload and immerse yourself in a visual journey that simplifies complexity with the tree diagram template.
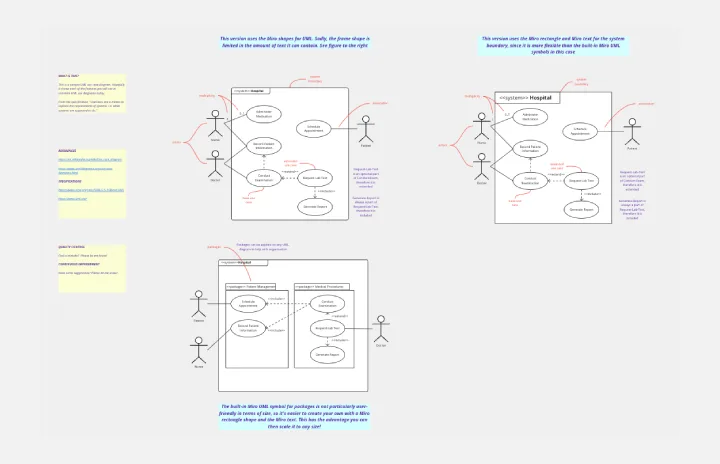
UML Use Case Diagram
Works best for:
UML Diagrams, Diagramming
Visualize system interactions with the UML Use Case Diagram. This template helps you map out user interactions and system processes, providing a clear overview of functional requirements. Ideal for software developers, business analysts, and project managers, it supports planning and communicating system functionalities. Use it to ensure all user scenarios are considered and to facilitate better design and implementation of software systems.