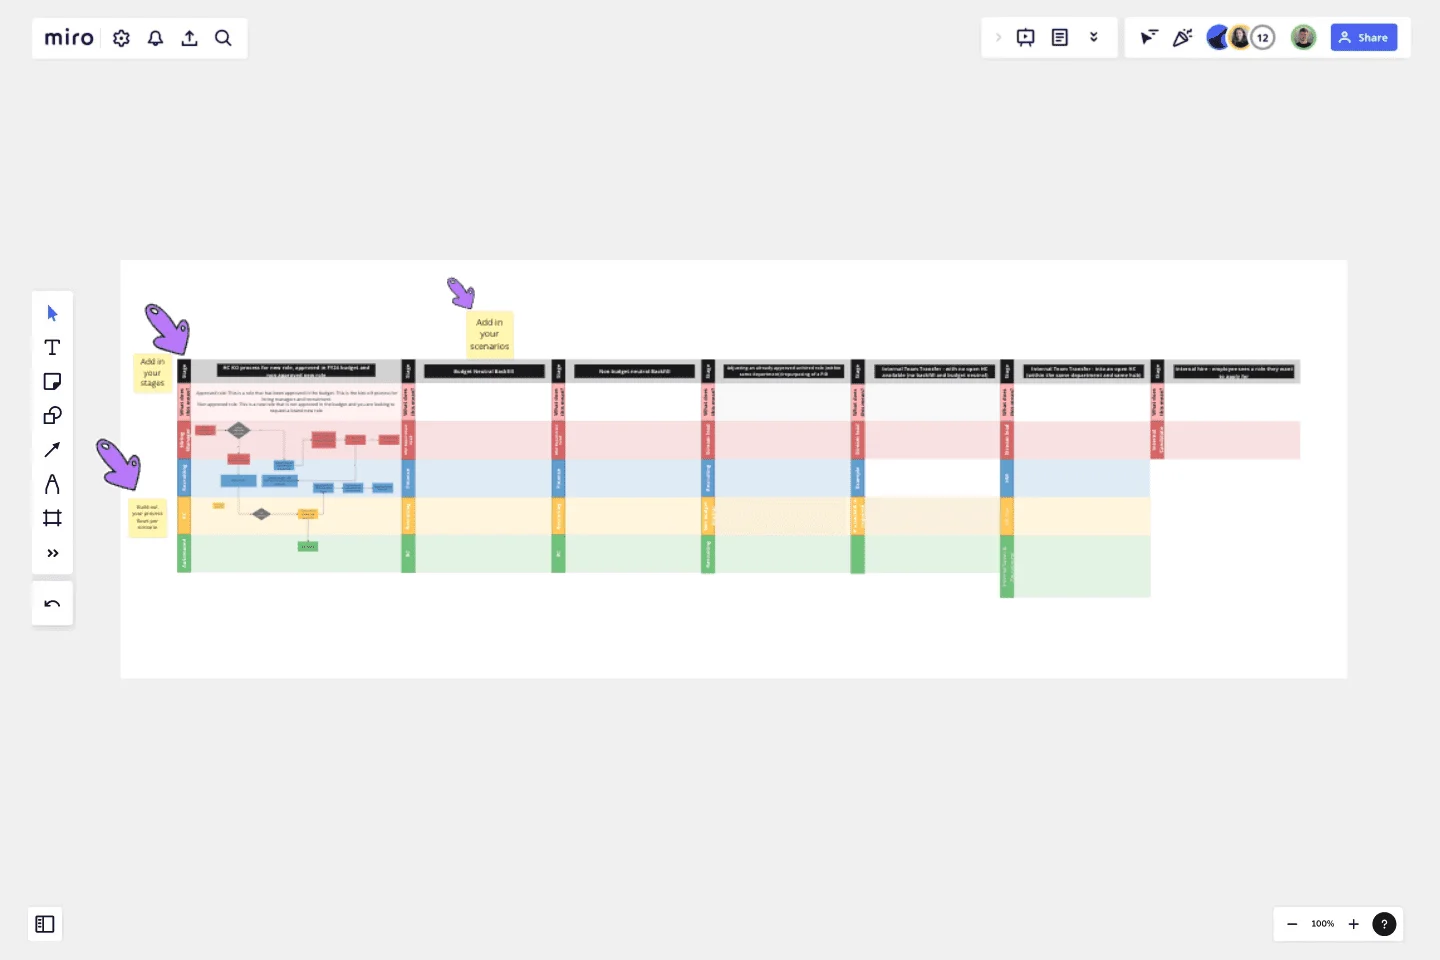
Headcount Approval Process Flowchart
Use this process flowchart to organise your approval workflows.
Use this process flowchart to organise your approval workflows. Typically this would be owned by Recruiting Operations.These are important for several reasons:
Clarity and Understanding
Standardization
Efficiency and Productivity
Communication
Training and Onboarding
Continuous Improvement
Decision-Making
This template was created by Ben Craig.
Get started with this template right now.
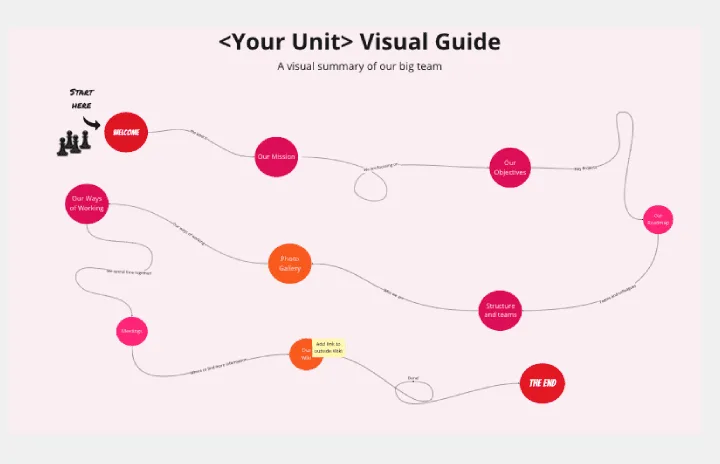
Org Unit Visual Guide
Works best for:
Org Charts, Operations, Mapping
Org Unit Visual Guide template offers a visual reference for understanding organizational units and their relationships. By mapping out departments, teams, and reporting lines, this template enhances clarity and transparency. With customizable features for adding annotations and descriptions, this template facilitates communication and alignment across organizational units.
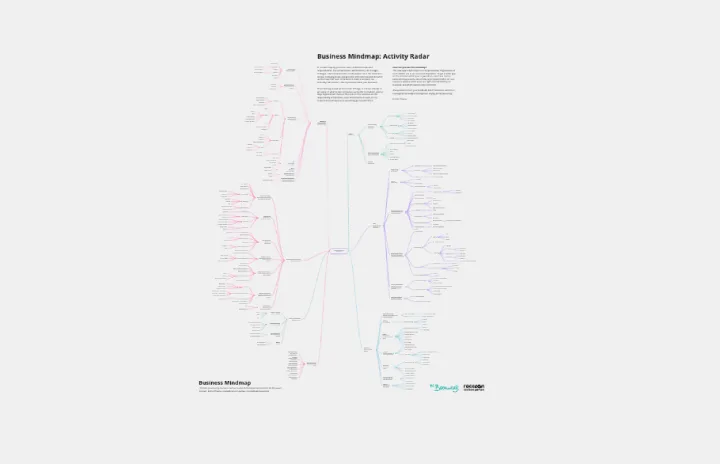
Business Mindmap
Works best for:
Diagramming
The Business Mindmap template is a visual tool for brainstorming, organizing, and presenting business ideas and concepts. It provides a structured framework for capturing and connecting thoughts, insights, and action items. This template enables teams to explore business strategies, analyze market trends, and develop innovative solutions. By promoting creativity and collaboration, the Business Mindmap empowers teams to generate and communicate actionable business plans effectively.
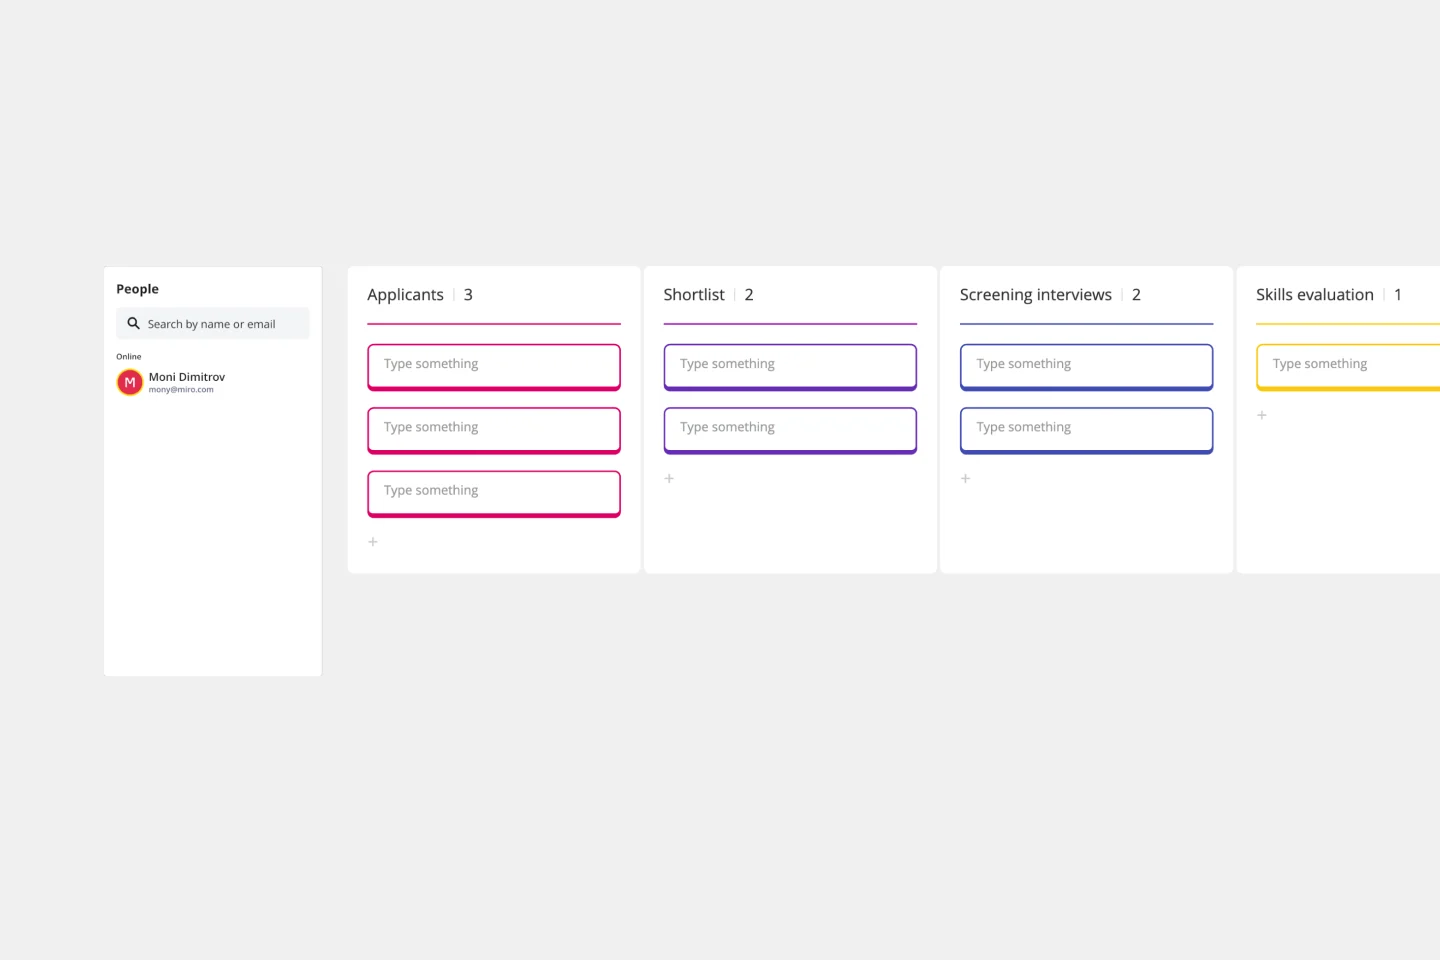
Hiring Process Template
Works best for:
Operations, Org Charts, Kanban Boards
Having a hiring process in place simplifies that process each step of the way, from recruiting for the position to making finalizing offers. This simple, effective template will give you a straightforward, high-level view of where employees are as they move from applicant to new hire.
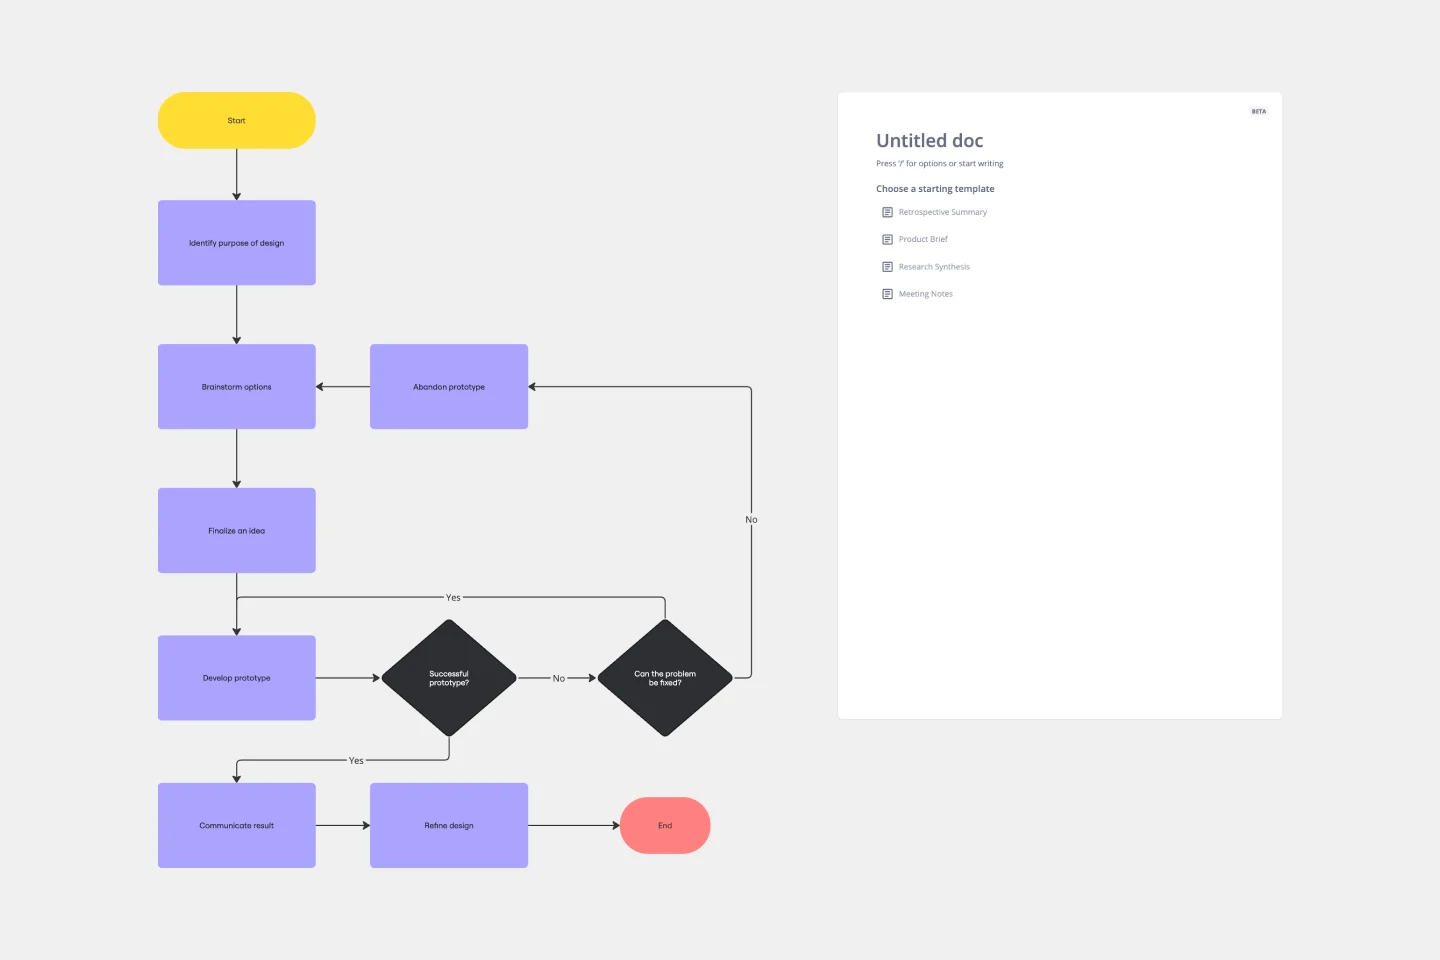
Design Process Flowchart Template
Works best for:
Flowchart, Diagramming
The Design Process Flowchart Template is an excellent tool to navigate the complexities of a design project. It offers a clear and organized visual representation of each step in the design journey, making it easier to understand and follow. One of its key benefits is that it enhances team collaboration. By providing a visual outline of the design process, the template fosters a shared understanding among team members, regardless of their individual roles or expertise. This common visual framework enables more efficient communication, aligning everyone's efforts toward a unified goal. As a result, it not only streamlines the workflow but also encourages collective creativity and innovation, which are essential elements in any successful design project.
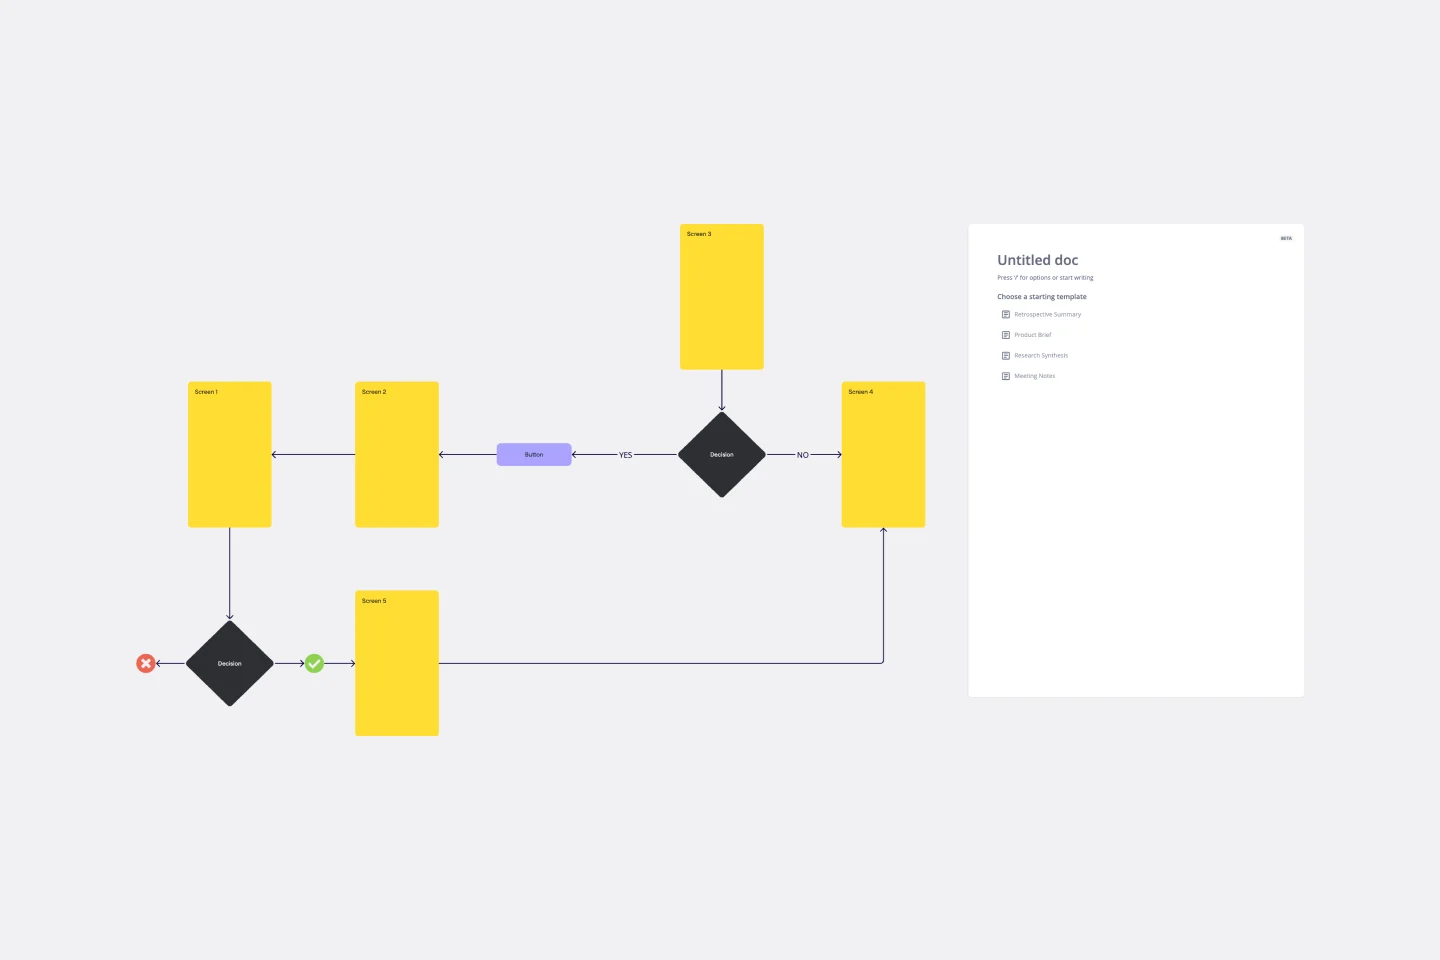
User Flow Template
Works best for:
Desk Research, Flowcharts, Mapping
User flows are diagrams that help UX and product teams map out the logical path a user should take when interacting with a system. As a visual tool, the user flow shows the relationship between a website or app’s functionality, potential actions a user could take, and the outcome of what the user decides to do. User flows help you understand what a user does to finish a task or complete a goal through your product or experience.
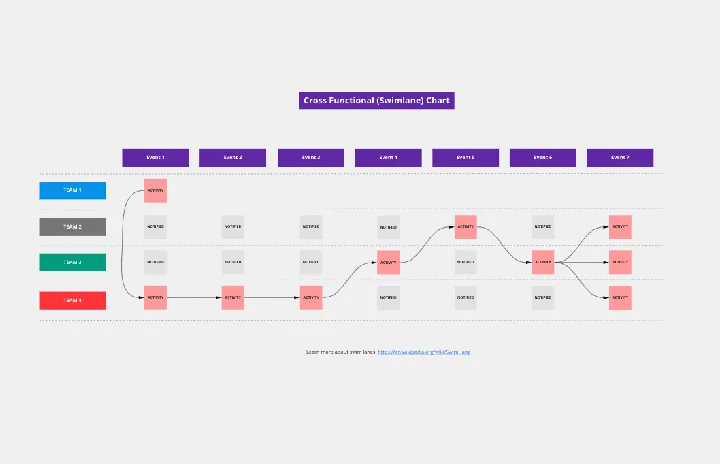
Cross Functional (Swimlane) Chart
Works best for:
Flowcharts, Mapping, Diagrams
The Cross Functional (Swimlane) Chart template offers a visual tool for mapping out processes or workflows with multiple stakeholders or functional areas. It provides swimlanes for organizing tasks and responsibilities by department or role. This template enables teams to visualize process flows, identify handoffs, and improve coordination and collaboration across functions. By promoting transparency and accountability, the Cross Functional (Swimlane) Chart empowers organizations to streamline workflows and drive cross-functional alignment effectively.