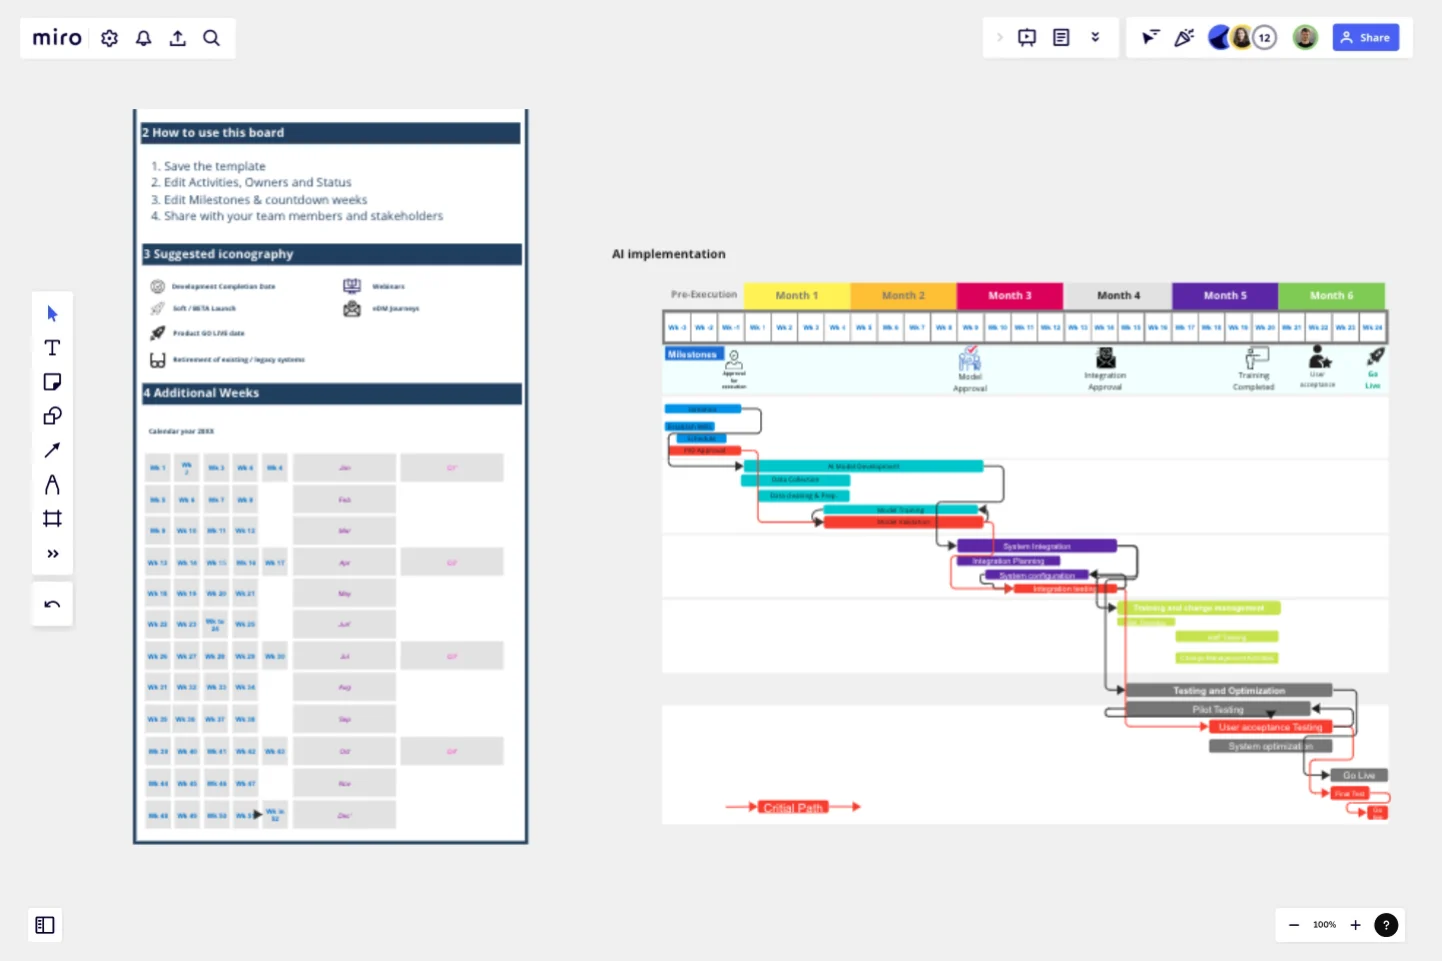
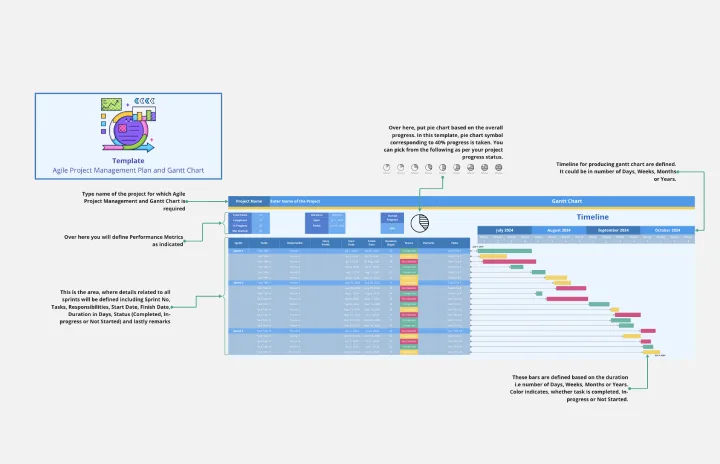
Gantt Chart for Project Scheduling
A Gantt chart is a project management tool that helps in planning, scheduling, and monitoring a project.
Use this template knowing this:
A Gantt chart is a horizontal bar chart used to display the start date and duration of each task that makes up a project.
It represents all information visually through a horizontal bar graph.
Project managers and team members can view the task schedules, dependencies, and progress by just glancing at the chart.
Components:
Y-axis: Represents the tasks in the project.
X-axis: Represents the duration of each task.
Bars: Each task is represented by a bar, and the length of the bar indicates its duration.
Overlapping Bars: If two bars overlap on the X-axis, they occur simultaneously.
This template was created by Muhammad Jaon.
Get started with this template right now.
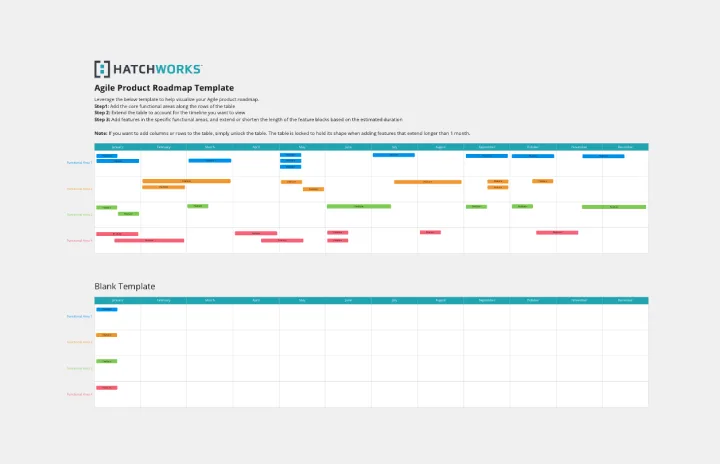
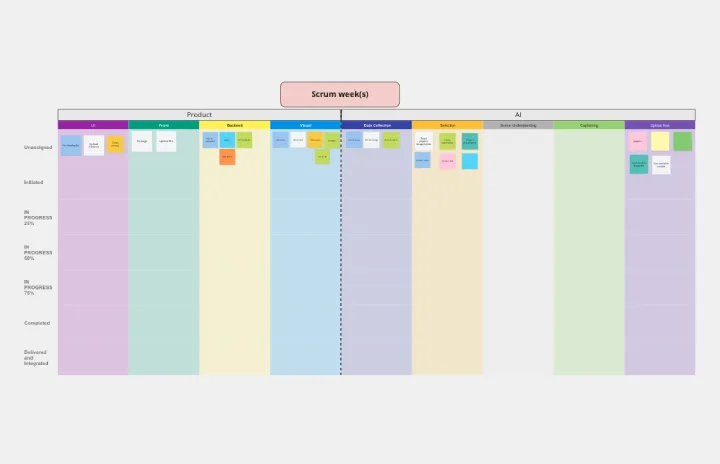
Agile Product Roadmap by HatchWorks
Works best for:
Product Management, Roadmap
Enhance your agile workflow with the Agile Product Roadmap by HatchWorks. This template helps you plan and track product development in agile sprints, ensuring continuous delivery and improvement. Use it to align teams, prioritize features, and adapt quickly to changes. Ideal for agile teams aiming to maintain flexibility and efficiency in their product development process, ensuring timely and iterative delivery of enhancements.
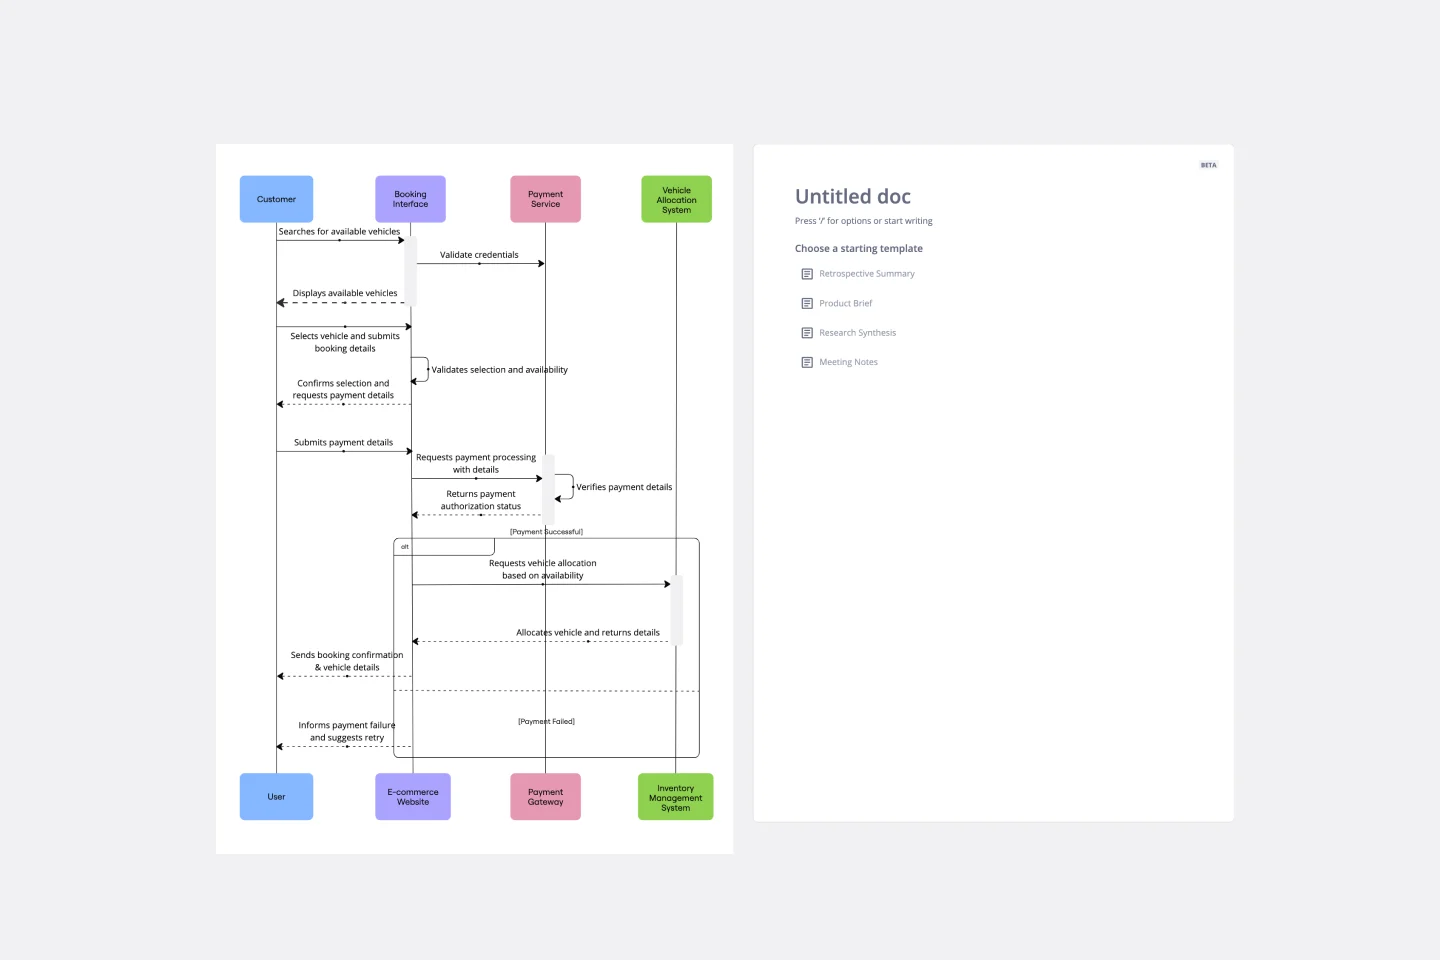
UML Sequence Rental Booking System Template
Works best for:
UML
The UML Sequence Rental Booking System Template streamlines the process of documenting and visualizing the interactions within a car rental booking system. This template maps out the communication flow between the customer, user interface, payment service, and vehicle allocation system, ensuring a smooth and efficient workflow. By providing a clear visual representation of these interactions, the template helps in improving understanding among team members and stakeholders, promoting efficient design and collaboration.
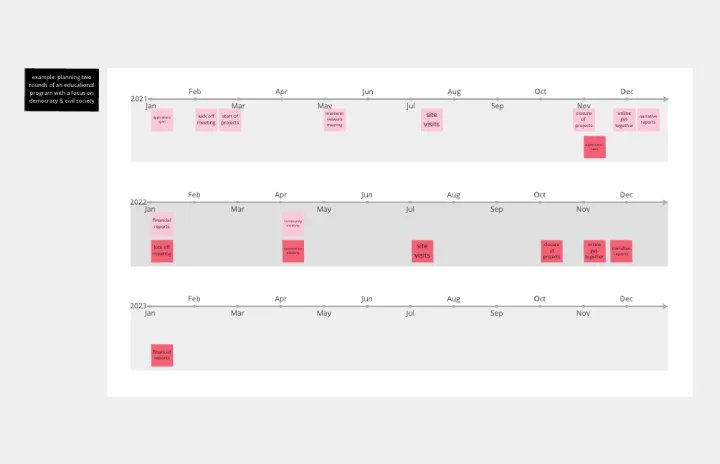
Year Timeline Template
Works best for:
Timeline, Planning
The Year Timeline template provides a comprehensive view of annual events and milestones. Perfect for planning yearly goals, tracking progress, and scheduling important dates, this template helps you stay organized and focused throughout the year.
Agile Project Gantt Chart
Works best for:
Gantt Chart, Planning
Streamline your agile projects with the Agile Project Gantt Chart. This template combines the flexibility of agile methodology with the structure of Gantt charts, allowing you to plan sprints, track progress, and adjust timelines dynamically. Perfect for agile teams seeking to enhance their project management efficiency and deliver timely results.
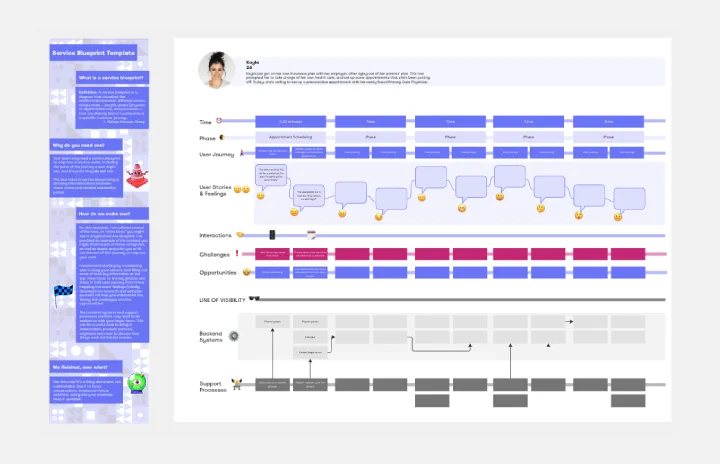
Service Blueprint by Liz Possee Corthell
Works best for:
Service Blueprint
Enhance your service design with the Service Blueprint Canvas. This template helps you visualize and analyze the entire service process, from front-stage customer interactions to back-stage support activities. Identify pain points, optimize workflows, and improve customer experiences. Ideal for service designers, managers, and teams focused on delivering exceptional service. The blueprint provides a comprehensive view, facilitating better communication and strategic planning.
Timeline Workflow by Reza Zolf
Works best for:
Planning, Strategy
The Timeline Workflow template helps streamline your project workflows. It’s perfect for visualizing processes, identifying bottlenecks, and optimizing tasks. This template enhances team collaboration and ensures smooth project execution.