Four-Circle Venn Diagram by Irfan Rosli
Welcome to the Four-Circle Venn Diagram template!
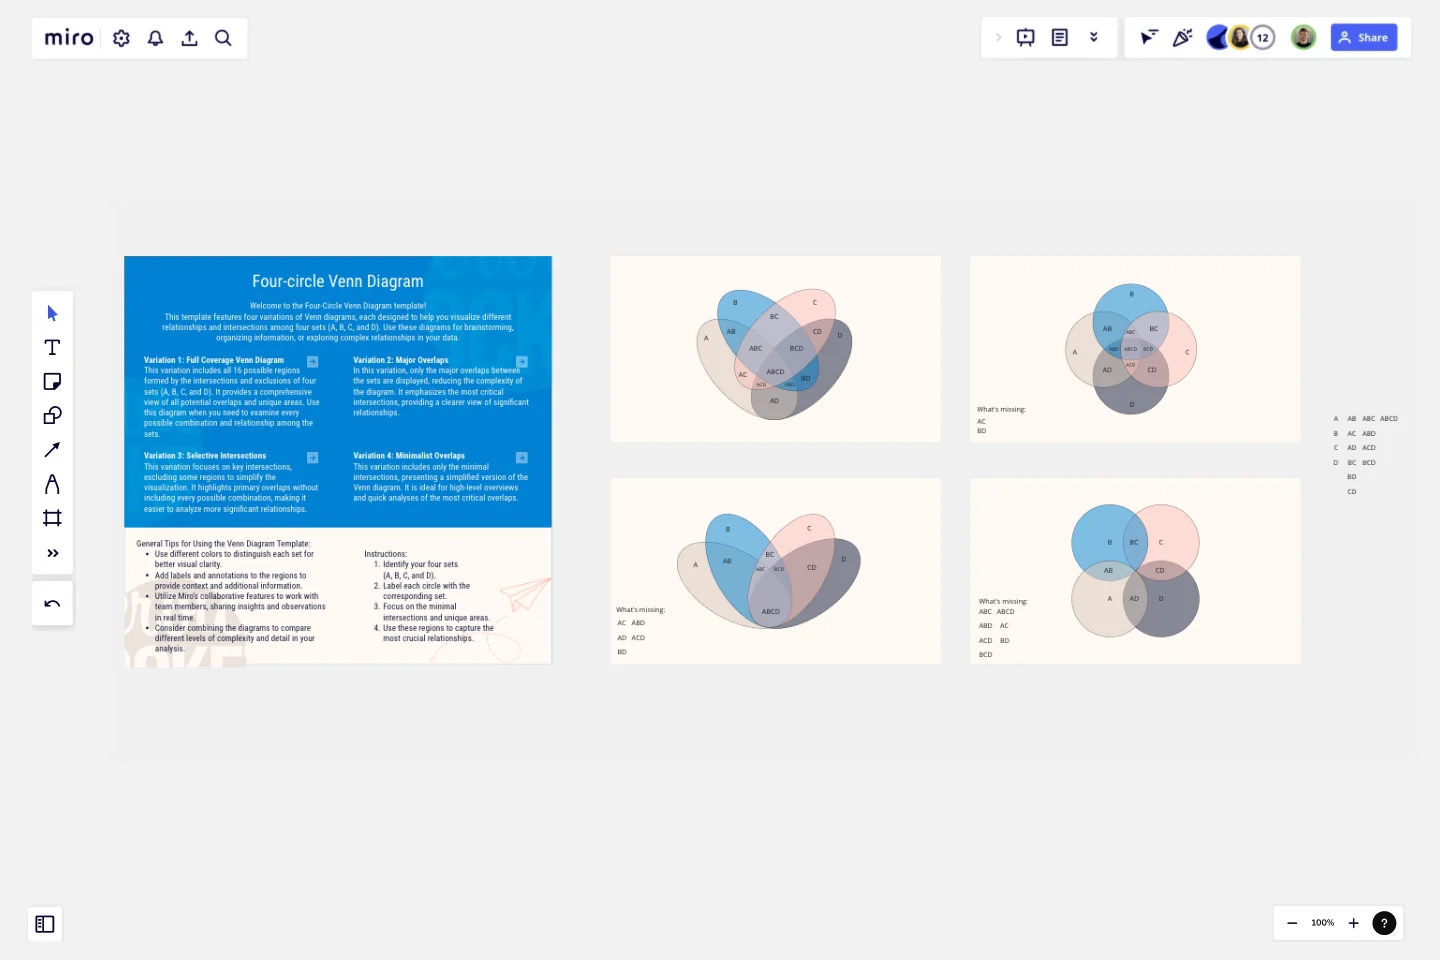
This template features four variations of Venn diagrams, each designed to help you visualize different relationships and intersections among four sets (A, B, C, and D). Use these diagrams for brainstorming, organizing information, or exploring complex relationships in your data.
Variation 1: Full Coverage Venn Diagram
This variation includes all 16 possible regions formed by the intersections and exclusions of four sets (A, B, C, and D). It provides a comprehensive view of all potential overlaps and unique areas. Use this diagram when you need to examine every possible combination and relationship among the sets.
Variation 2: Major Overlaps
In this variation, only the major overlaps between the sets are displayed, reducing the complexity of the diagram. It emphasizes the most critical intersections, providing a clearer view of significant relationships.
Variation 3: Selective Intersections
This variation focuses on key intersections, excluding some regions to simplify the visualization. It highlights primary overlaps without including every possible combination, making it easier to analyze more significant relationships.
Variation 4: Minimalist Overlaps
This variation includes only the minimal intersections, presenting a simplified version of the Venn diagram. It is ideal for high-level overviews and quick analyses of the most critical overlaps.
Instructions:
Identify your four sets (A, B, C, and D).
Label each circle with the corresponding set.
Focus on the minimal intersections and unique areas.
Use these regions to capture the most crucial relationships.
General Tips for Using the Venn Diagram Template:
Use different colors to distinguish each set for better visual clarity.
Add labels and annotations to the regions to provide context and additional information.
Utilize Miro's collaborative features to work with team members, sharing insights and observations in real time.
Consider combining the diagrams to compare different levels of complexity and detail in your analysis.
This template aims to provide flexibility and clarity in visualizing the relationships among four sets. Choose the variation that best fits your needs and start exploring the intersections and unique aspects of your data!
This template was created by Irfan Rosli.
Get started with this template right now.
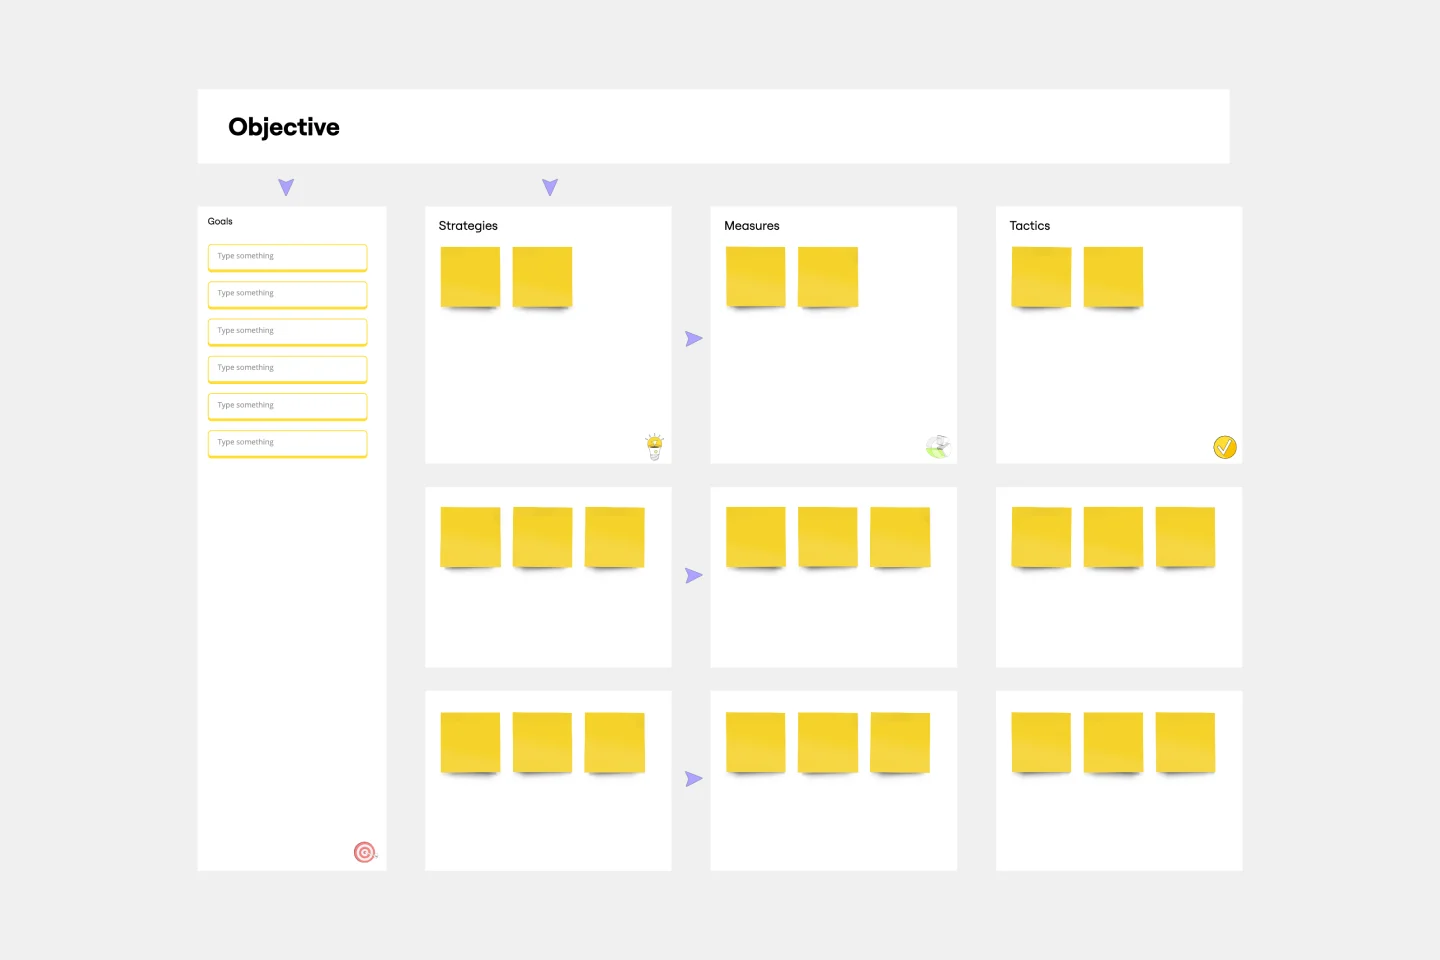
OGSM Template
Works best for:
Strategy, Planning
The OGSM template provides a readable framework, systematically breaking down business strategies into Objectives, Goals, Strategies, and Measures. This structured approach ensures that overarching visions are translated into actionable plans, fostering alignment across different teams and initiatives. One standout benefit of using this template is its ability to offer clarity. By clearly delineating between broad objectives and specific measures, stakeholders can easily comprehend and stay focused on the most critical elements of a strategy, ensuring that all efforts are directed toward the desired outcomes.
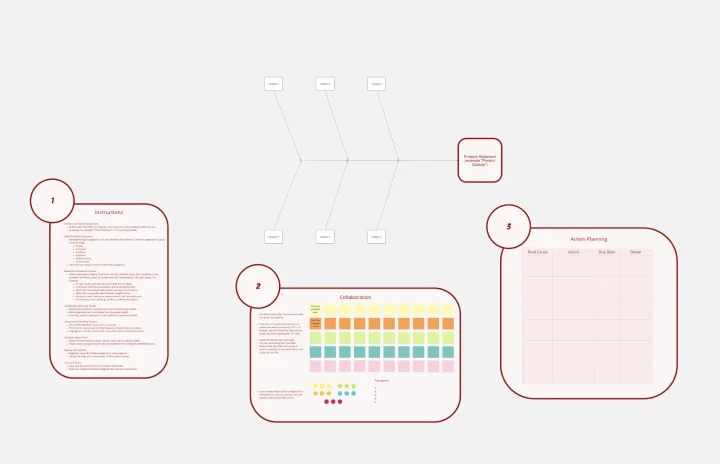
Fishbone Diagram for Quality Control
Works best for:
Fishbone diagram
Maintaining high standards of quality is vital in any industry. The Fishbone Diagram for Quality Control template helps you identify and analyze the root causes of quality issues. Use it to categorize potential causes into areas such as materials, methods, manpower, and machinery. This structured approach ensures a thorough examination of all possible factors affecting quality, leading to more effective solutions and continuous improvement.
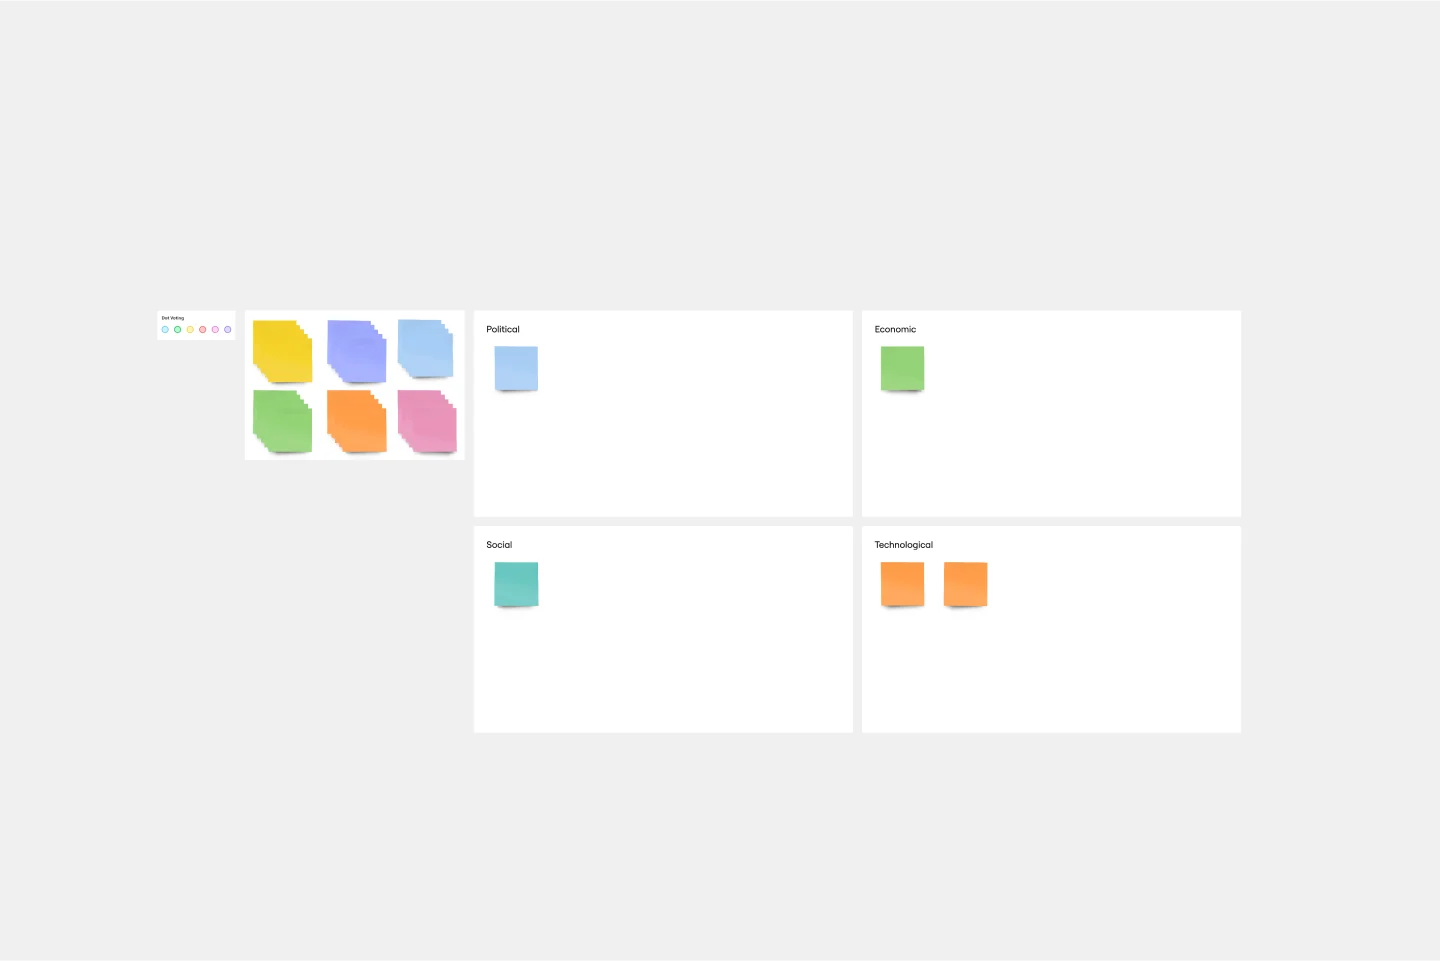
PEST Analysis Template
Works best for:
Ideation, Strategic Planning, Business Management
No business operates inside a vacuum, so if you want to succeed, you have to successfully deal with local laws, government regulating bodies, the health of the local economy, social factors like the unemployment rate, average household income, and more. Use the PEST Analysis Template to help you explore how the world impacts your business and how you can work around it.
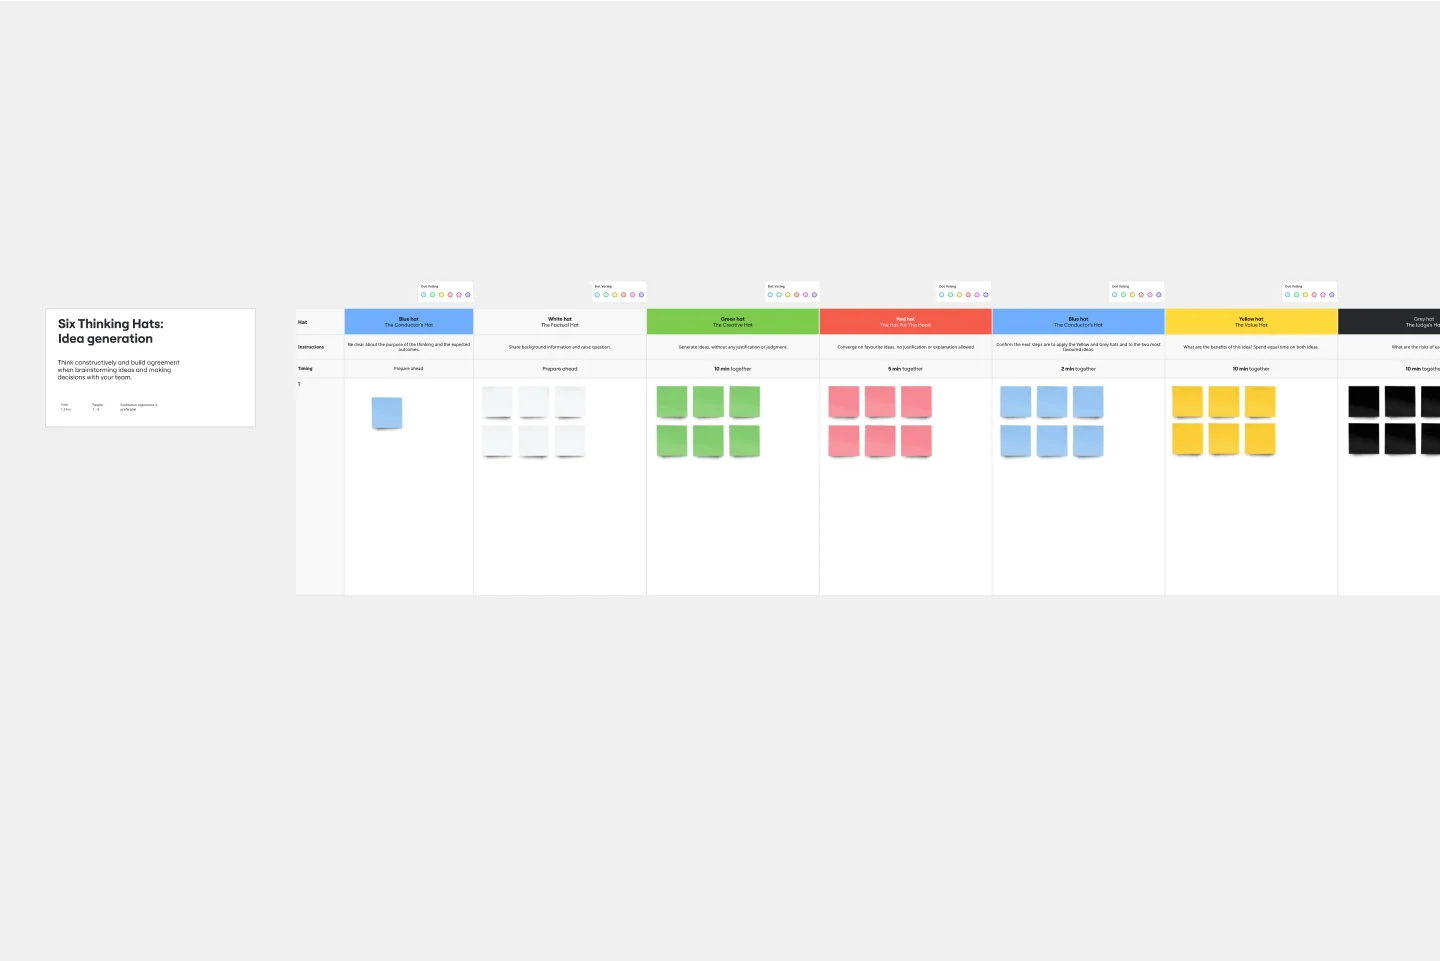
Six Thinking Hats Template
Works best for:
Ideation, Brainstorming
The Six Thinking Hats by Dr. Edward de Bono was created as an alternative to argument, it is designed to help teams explore and develop ideas collaboratively. Use this template to boost creative thinking and get different perspectives so you and your team can make better-informed decisions.
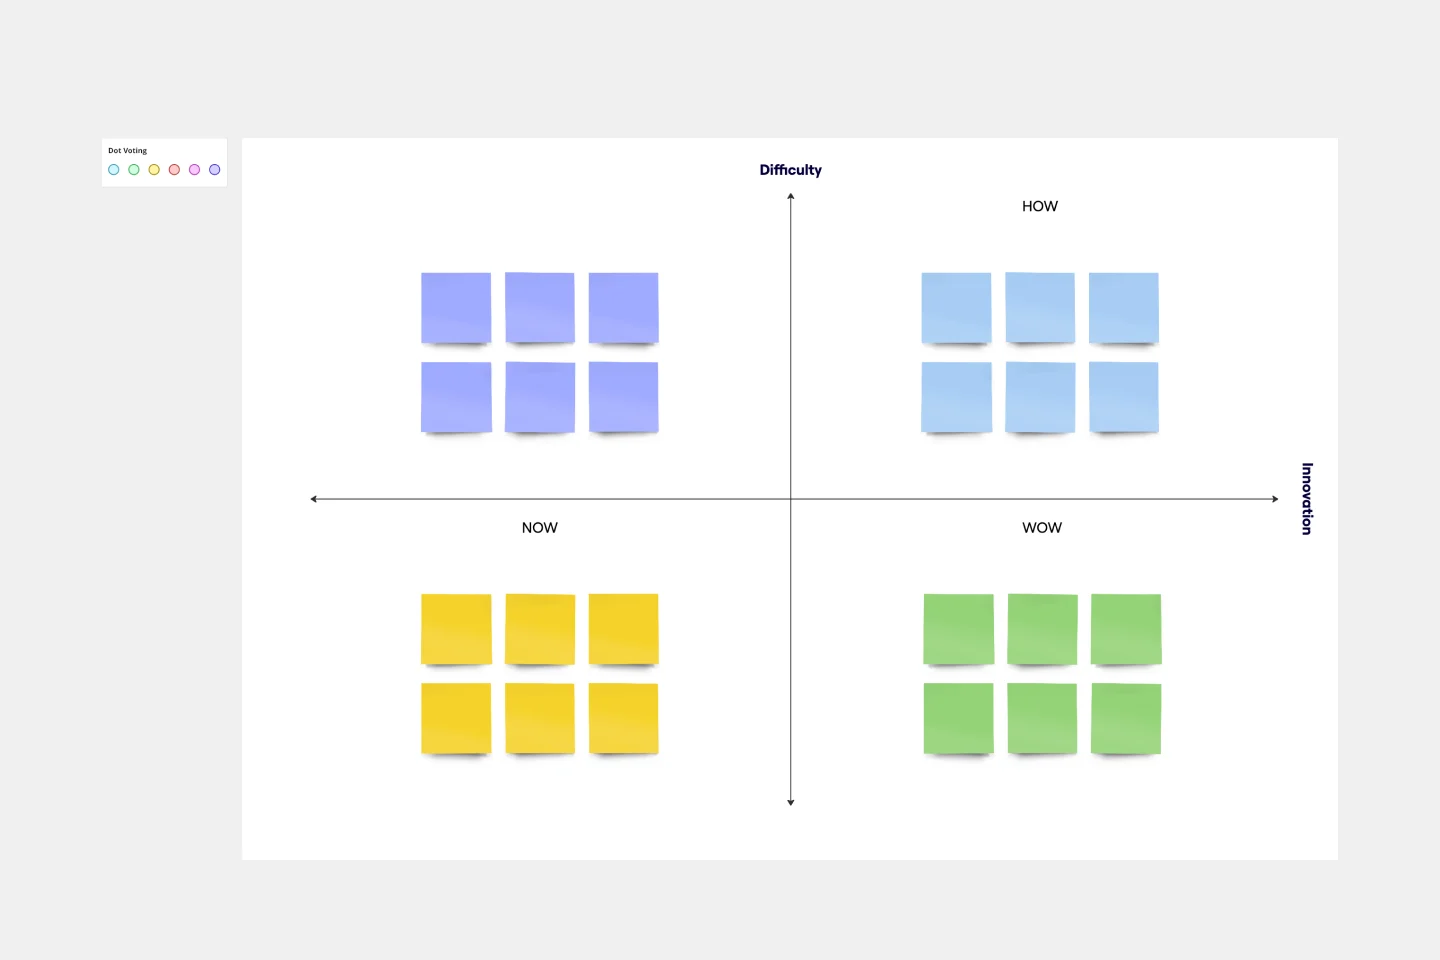
How Now Wow Matrix Template
Works best for:
Ideation, Product Management, Prioritization
There are no bad ideas in a brainstorm — but some are more original and easier to implement. The How Now Wow matrix is a tool that helps you identify and organize those great ideas, as well as reinvigorates your team to think creatively and take risks (a taller order as you scale). Grab this template to create your own matrix, then rank the ideas you generated in a brainstorm as “How” (difficult to implement), “Now” (easy to implement), or “Wow” (both original and easy to implement).