Four-Circle Venn Diagram
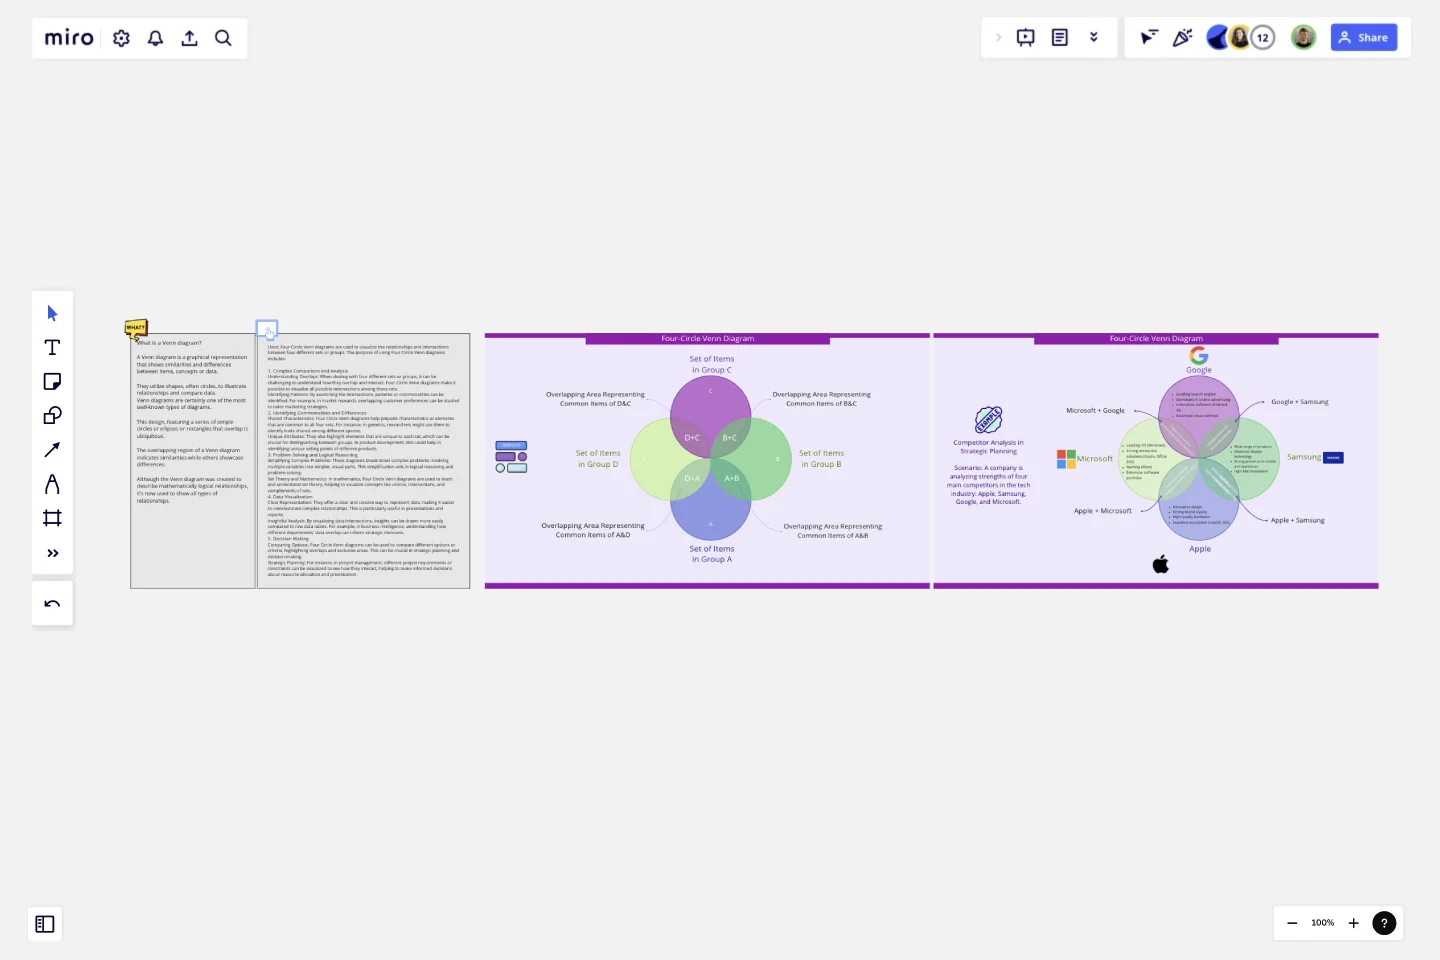
A Venn diagram is a graphical representation that shows similarities and differences between items, concepts or data.
They utilize shapes, often circles, to illustrate relationships and compare data.
Venn diagrams are certainly one of the most well-known types of diagrams. This design, featuring a series of simple circles or ellipses or rectangles that overlap is ubiquitous. The overlapping region of a Venn diagram indicates similarities while others showcase differences. Although the Venn diagram was created to describe mathematically logical relationships, it’s now used to show all types of relationships.
Uses:
Four Circle Venn diagrams are used to visualize the relationships and intersections between four different sets or groups. The purpose of using Four Circle Venn diagrams includes:
1. Complex Comparison and AnalysisUnderstanding Overlaps: When dealing with four different sets or groups, it can be challenging to understand how they overlap and interact. Four Circle Venn diagrams make it possible to visualize all possible intersections among these sets.
Identifying Patterns: By examining the intersections, patterns or commonalities can be identified. For example, in market research, overlapping customer preferences can be studied to tailor marketing strategies.
2. Identifying Commonalities and DifferencesShared Characteristics: Four Circle Venn diagrams help pinpoint characteristics or elements that are common to all four sets. For instance, in genetics, researchers might use them to identify traits shared among different species.
Unique Attributes: They also highlight elements that are unique to each set, which can be crucial for distinguishing between groups. In product development, this could help in identifying unique selling points of different products.
3. Problem Solving and Logical ReasoningSimplifying Complex Problems: These diagrams break down complex problems involving multiple variables into simpler, visual parts. This simplification aids in logical reasoning and problem-solving.
Set Theory and Mathematics: In mathematics, Four Circle Venn diagrams are used to teach and understand set theory, helping to visualize concepts like unions, intersections, and complements of sets.
4. Data VisualizationClear Representation: They offer a clear and concise way to represent data, making it easier to communicate complex relationships. This is particularly useful in presentations and reports.
Insightful Analysis: By visualizing data intersections, insights can be drawn more easily compared to raw data tables. For example, in business intelligence, understanding how different departments' data overlap can inform strategic decisions.
5. Decision MakingComparing Options: Four Circle Venn diagrams can be used to compare different options or criteria, highlighting overlaps and exclusive areas. This can be crucial in strategic planning and decision-making.
Strategic Planning: For instance, in project management, different project requirements or constraints can be visualized to see how they interact, helping to make informed decisions about resource allocation and prioritization. Learn from the examples provided to start your own Venn diagram.
This template was created by Khawaja Rizwan.
Get started with this template right now.
Lean UX Canvas Template
Works best for:
Desk Research, Product Management, User Experience
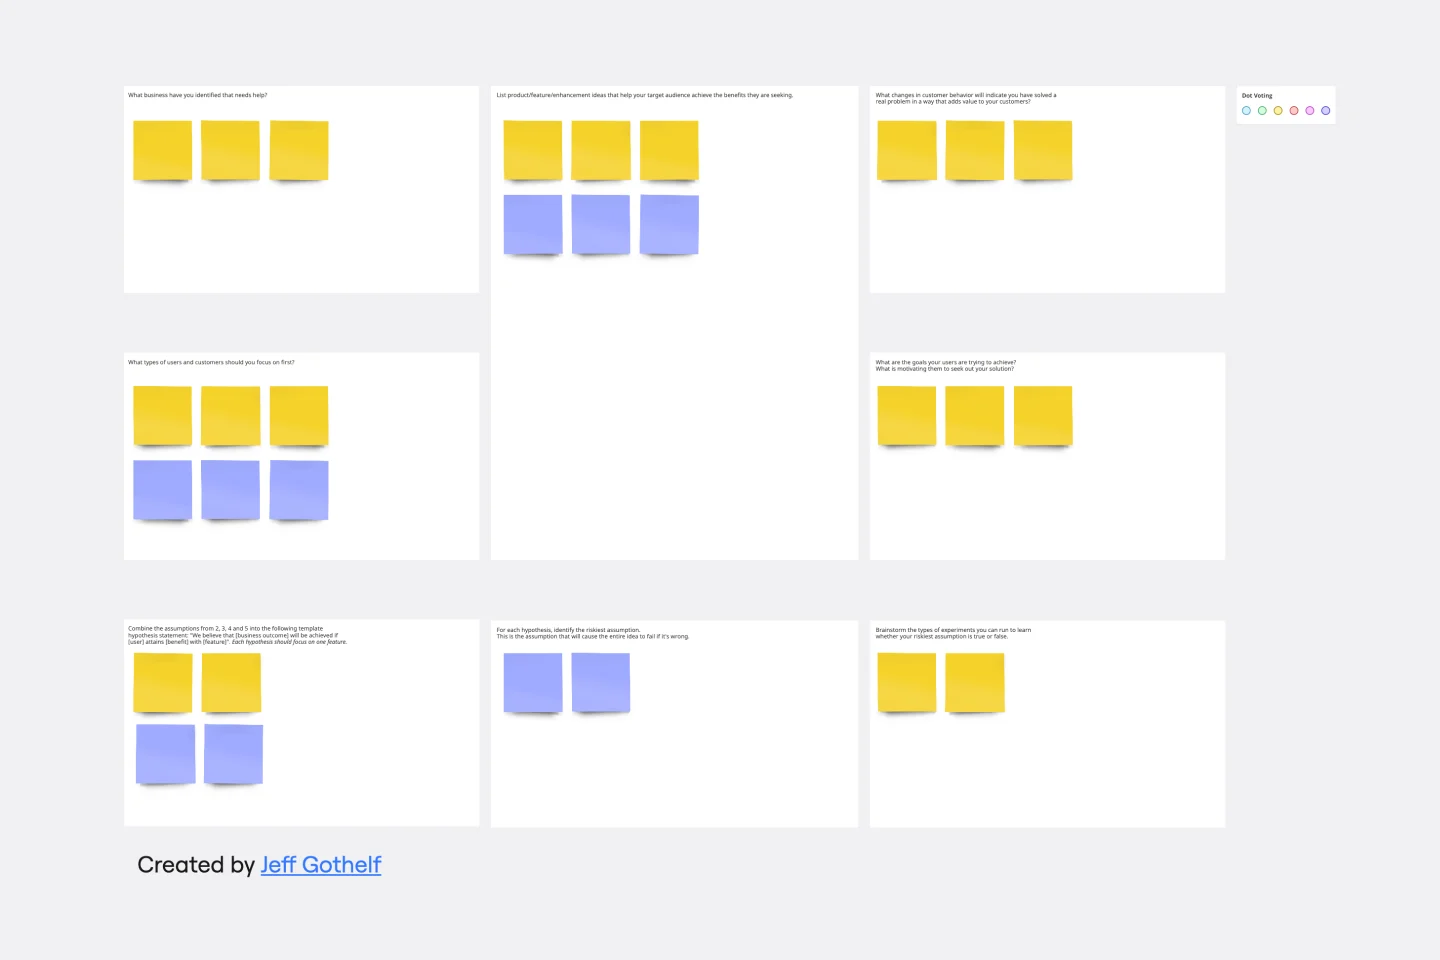
What are you building, why are building it, and who are you building it for? Those are the big pictures questions that guide great companies and teams toward success — and Lean UX helps you find the answers. Especially helpful during project research, design, and planning, this tool lets you quickly make product improvements and solve business problems, leading to a more customer-centric product. This template will let you create a Lean UX canvas structured around eight key elements: Business problem, Business outcome, Users and customers, User benefits, Solution ideas, Hypothesis, Assumptions, Experimentation.
Sales Strategy Gantt Chart
Works best for:
Strategy, Planning
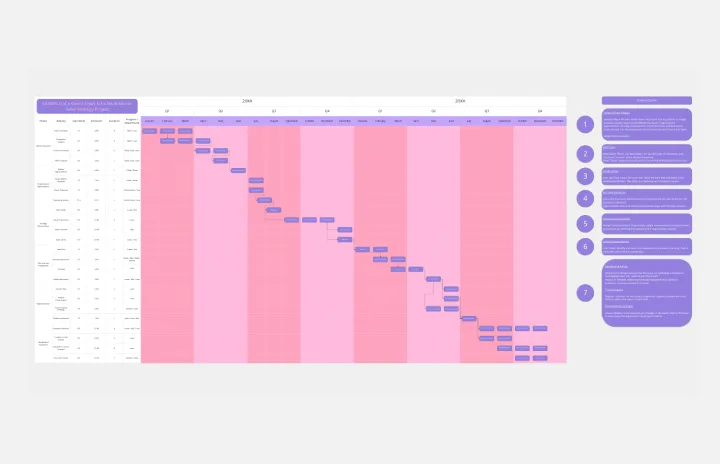
Creating and executing a sales strategy requires meticulous planning. The Sales Strategy Gantt Chart template helps you map out every step of your strategy, from goal setting to implementation and review. Visualize key activities, set timelines, and assign tasks to ensure your sales team stays focused and aligned. This template enables you to track progress, measure performance, and make data-driven adjustments for better sales outcomes.
OKR Planning Template
Works best for:
Strategic Planning, Meetings, Workshops
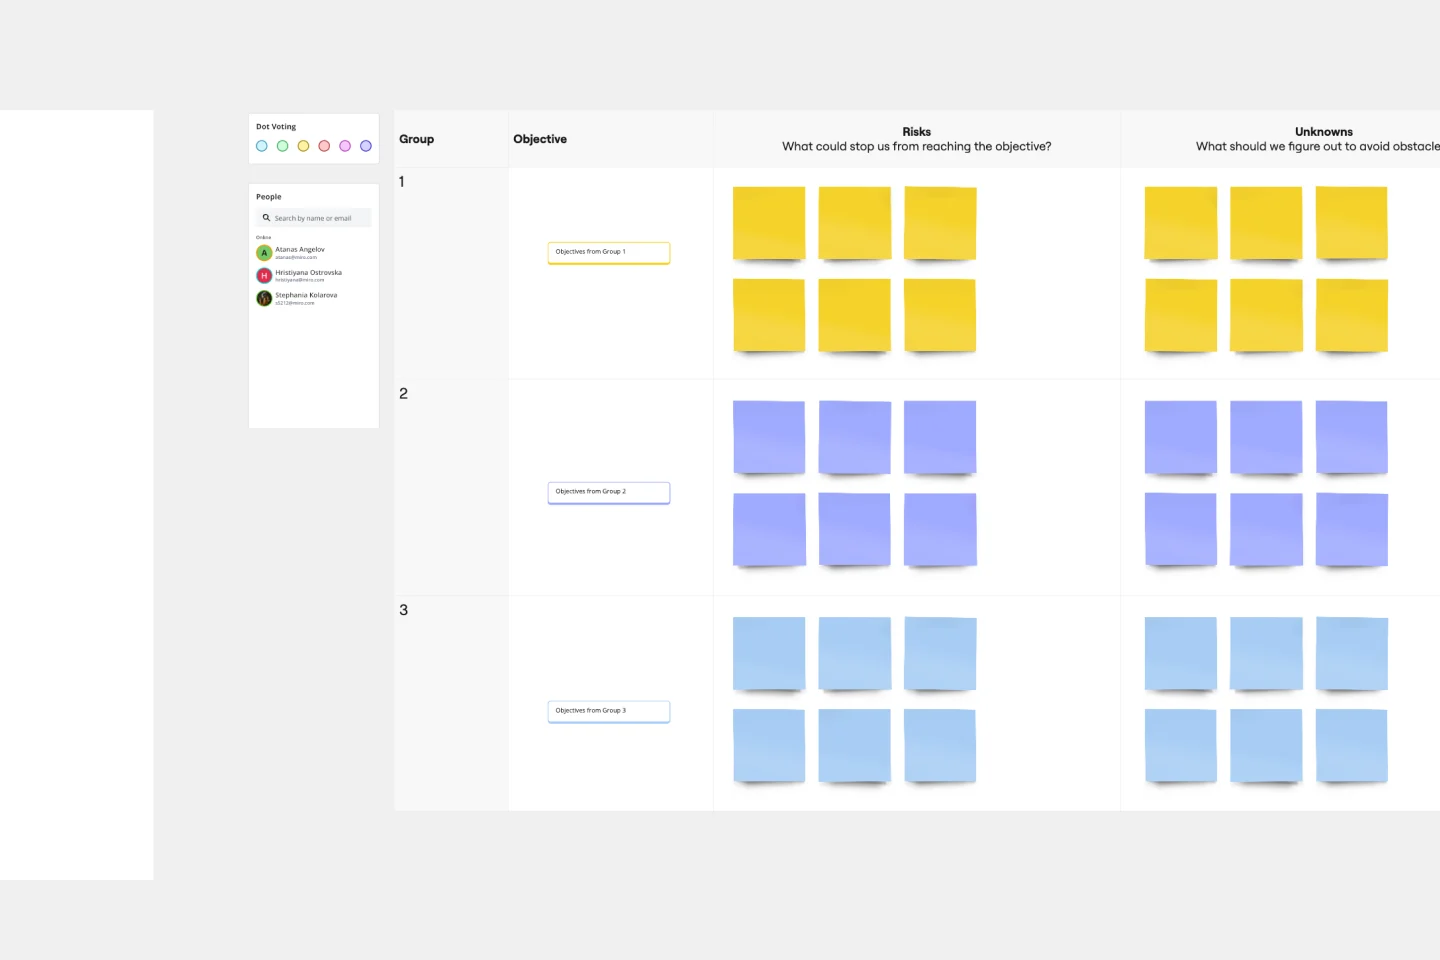
The OKR Planning template helps you turn exhaustive OKR sessions into dynamic and productive meetings. Use this template to make OKR planning more interactive, guiding your team through the session with creative Ice Breakers and Brainstorms, so you can co-create your OKRs and define the key results and action plans to achieve them.
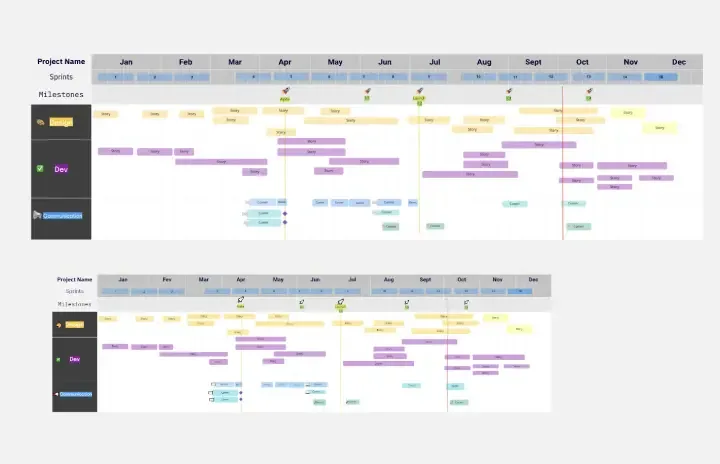
Project - Timeline & Key Infos
Works best for:
Agile, Project Management
The Project - Timeline & Key Infos template provides a visual framework for planning and tracking project timelines, milestones, and key information. It enables teams to align on project objectives, allocate resources, and monitor progress effectively. With customizable timelines and informative dashboards, this template empowers project managers and stakeholders to stay organized and informed throughout the project lifecycle, ensuring successful delivery within scope, time, and budget constraints.
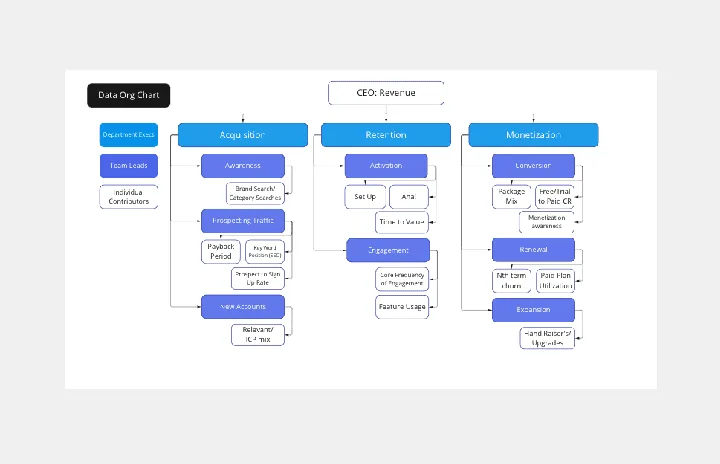
Data Org Chart
Works best for:
Org Charts, Operations, Mapping
The Data Org Chart template provides a visual representation of data-related roles and relationships within an organization. By mapping out data management responsibilities and dependencies, teams can enhance data governance and improve collaboration. With features for customizing data roles and connections, this template empowers teams to optimize data processes and ensure data integrity and compliance.
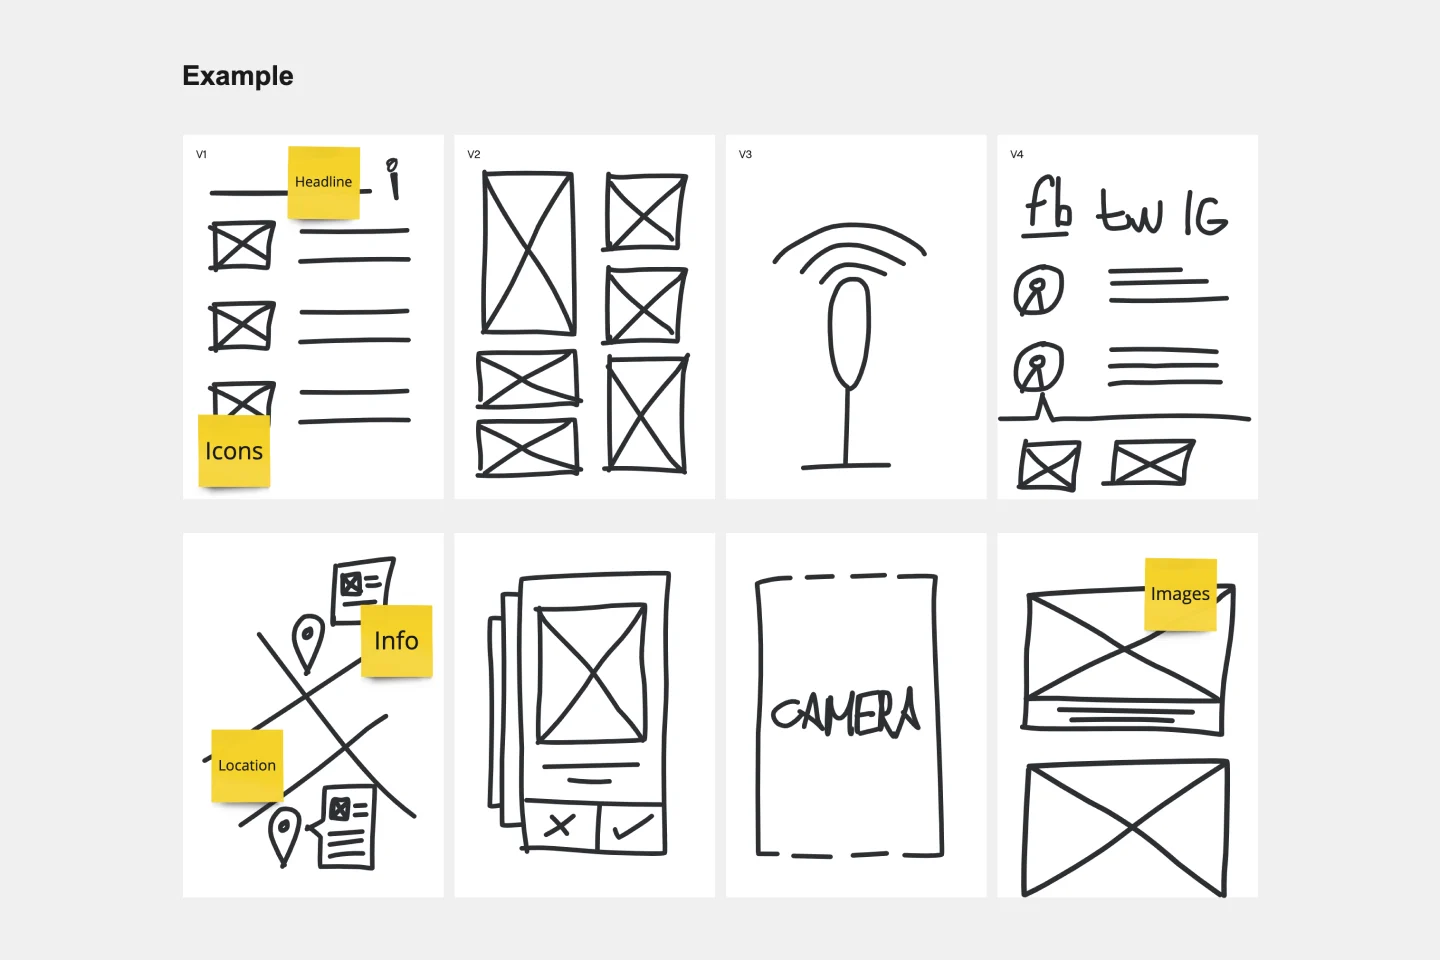
Crazy Eights Template
Works best for:
Design Thinking, Brainstorming, Ideation
Sometimes you just need to get the team’s creative juices flowing for a brainstorm—and get them thinking of as many ideas as they can, as fast as they can. Crazy Eights will do it in a hurry. Favoring quantity over quality, this sketch brainstorming exercise challenges them to come up with eight ideas in eight minutes, which leaves no time to second guess ideas. It’s perfect for early stages of development, and it’s a team favorite for being fast paced and fun.