Force Field Analysis Template
Identify driving and restraining forces, prioritize actions, and build team consensus for effective decision-making with the force field analysis template.
About the Force Field Analysis Template
Force Field Analysis is a powerful tool that can help you identify and analyze the various factors that can impact the success of a project or initiative. The force field analysis template is a great way to get started with this technique, allowing you to quickly visualize and organize your thoughts in a collaborative and dynamic way.
What is the force field analysis template?
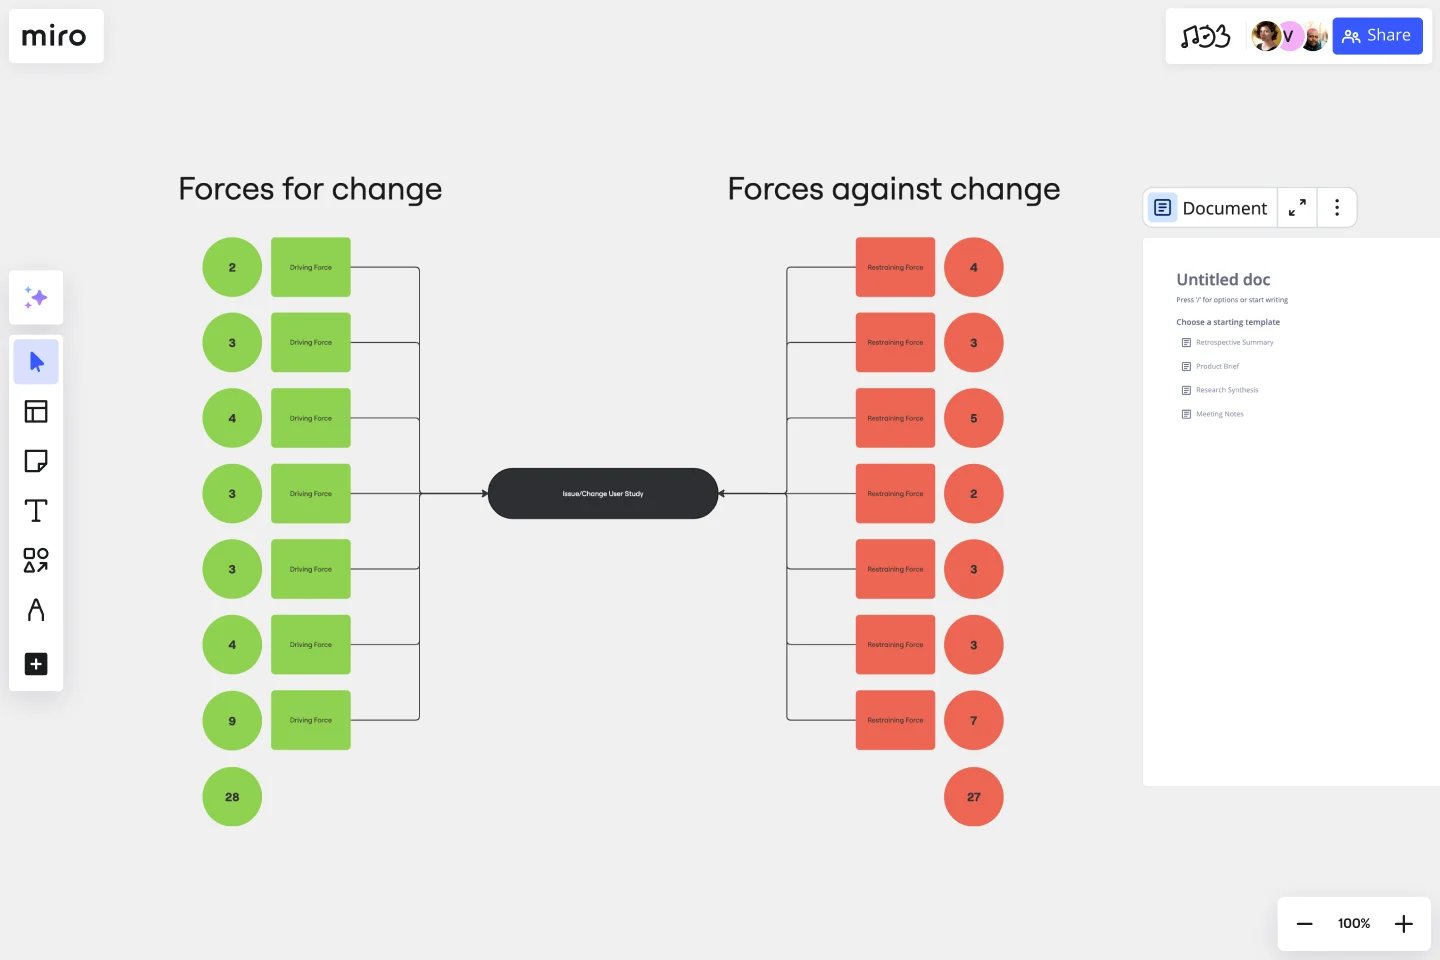
The force field analysis template is a simple yet effective way to understand and analyze the forces that can influence the success of your project. It consists of two main areas - driving forces and restraining forces - which can be broken down into more specific factors.
For example, driving forces might include factors such as increased revenue, improved customer satisfaction, or enhanced productivity, while restraining forces might include factors such as increased competition, budget constraints, or lack of resources.
How to use the force field analysis template in Miro
Here are the steps to use the Force Field Analysis template in Miro:
Open the template in your Miro board.
Start editing the template by adding or removing shapes and connector lines.
Use automated diagramming features to expand the template as needed.
Add any artifact on a Miro board to provide more context to your analysis.
Why should you use a force field analysis template?
There are many benefits to making a force field analysis, including:
Increased clarity: The template can help you identify the key factors that are driving or restraining your project, allowing you to focus on the most important areas.
Improved decision-making: By analyzing the various factors that impact your project, you can make more informed decisions about how to move forward.
Enhanced collaboration: The template allows you to work collaboratively with your team, fostering communication and collaboration.
Increased creativity: The force field analysis template helps you think outside the box and come up with innovative solutions to complex problems.
Better alignment: By identifying the key driving and restraining forces, you can ensure that your team is aligned around a common goal.
Do you need more advanced diagramming? Miro's extensive shape pack library, collaboration features, and technical diagramming capabilities provide robust solutions for teams.
Can I customize the template to fit my specific needs?
Absolutely! The template is fully customizable, allowing you to add or remove shapes and connector lines as needed.
How can I collaborate with my team on the template?
Miro allows for real-time collaboration, so you can work together with your team in real-time, no matter where you are.
Can I export the template to other platforms?
Yes, Miro allows you to export your templates to various formats, including PDF, PNG, and JPEG.
Get started with this template right now.
Algorithm Flowchart Template
Works best for:
Flowcharts
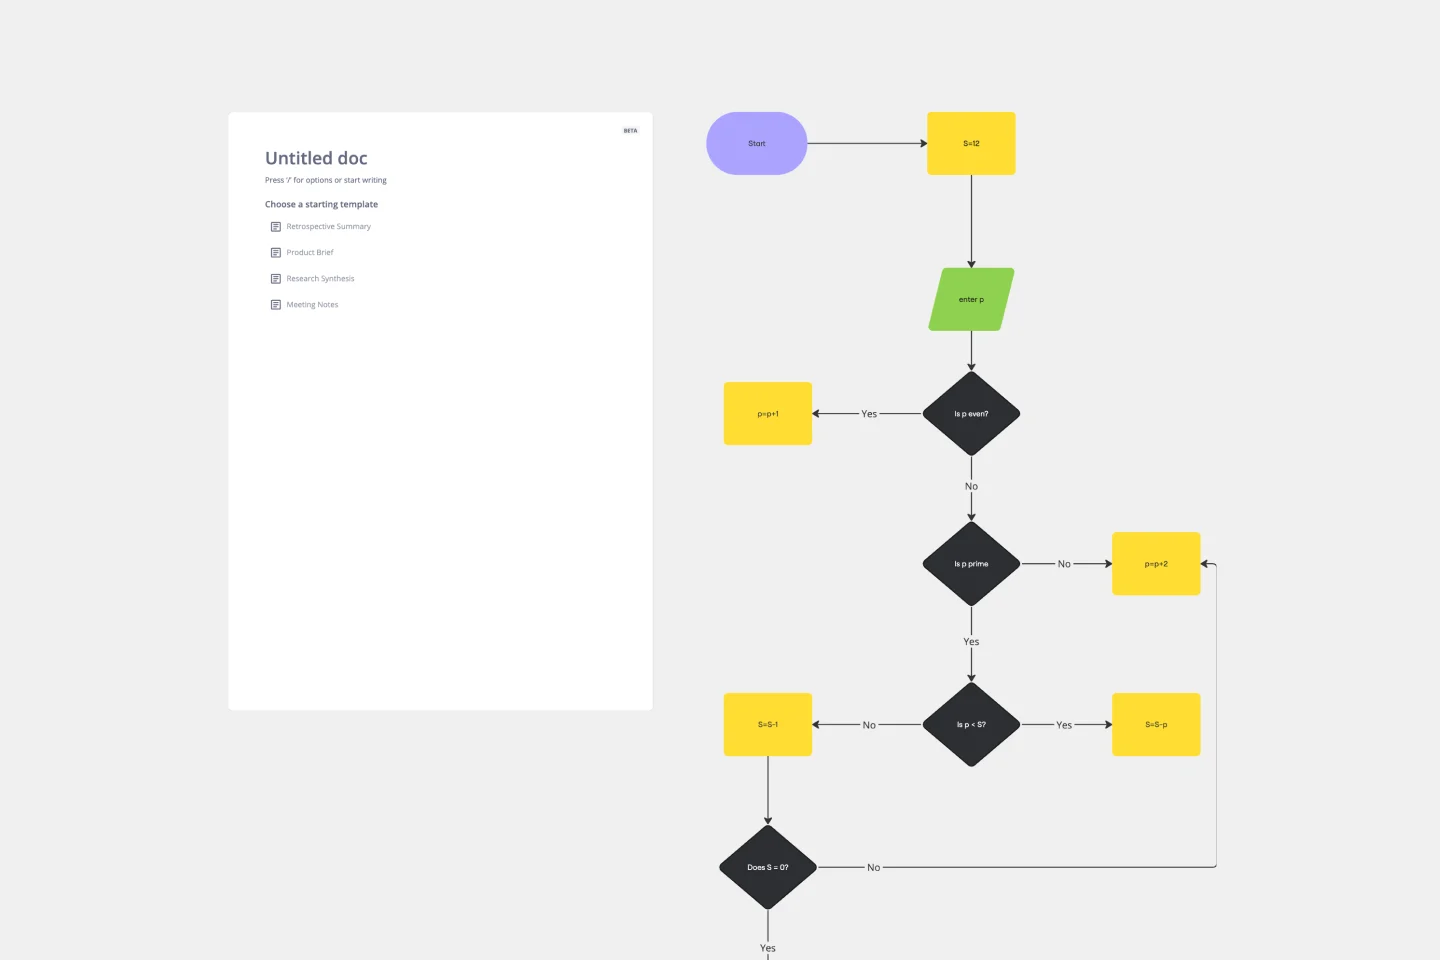
The Algorithm Flowchart Template is a useful tool for simplifying the process of creating and understanding complex algorithms. Its pre-structured format makes it easy to lay out each operation and decision point in a clear and easily understandable visual format. This is particularly helpful for explaining intricate processes to team members who may not be as technically proficient in the subject matter. With each step clearly defined within its designated shape, the flowchart promotes clarity and makes it easy to identify the logical flow at a glance. This clarity is the template's most significant advantage, reducing cognitive load and enabling a more inclusive and straightforward approach to discussing and refining algorithmic solutions.
Comprehensive Guide to BPMN
Works best for:
BPMN, Diagramming
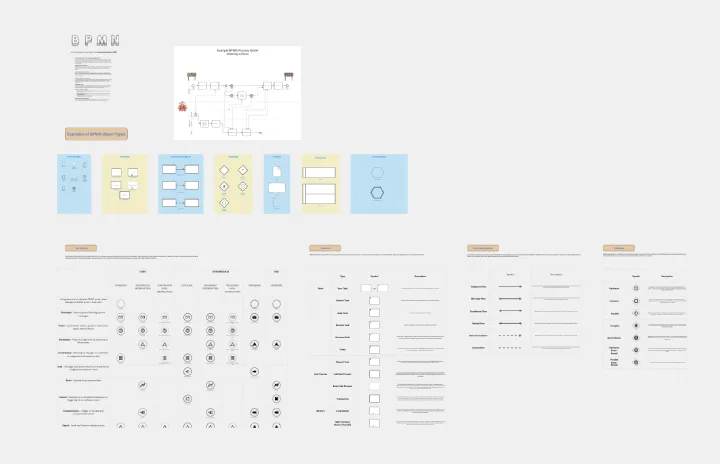
Tame the Workflow Beast: Your Visual Guide to BPMN with Miro!
Value Network Mapping (1.0)
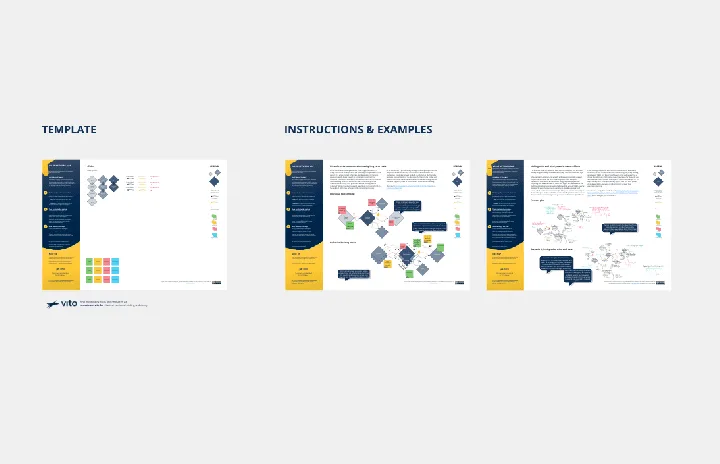
The Value Network Mapping (1.0) template is a visual tool for analyzing and optimizing the relationships and interactions between stakeholders within a network. It provides a structured framework for mapping out value exchanges, dependencies, and opportunities for collaboration. This template enables teams to gain insights into the dynamics of their ecosystem, identify key actors, and align strategies for mutual benefit. By promoting transparency and collaboration, Value Network Mapping empowers organizations to enhance value creation and foster strategic partnerships.
Double Bubble Map Template
Works best for:
Diagramming, Mapping, Brainstorming
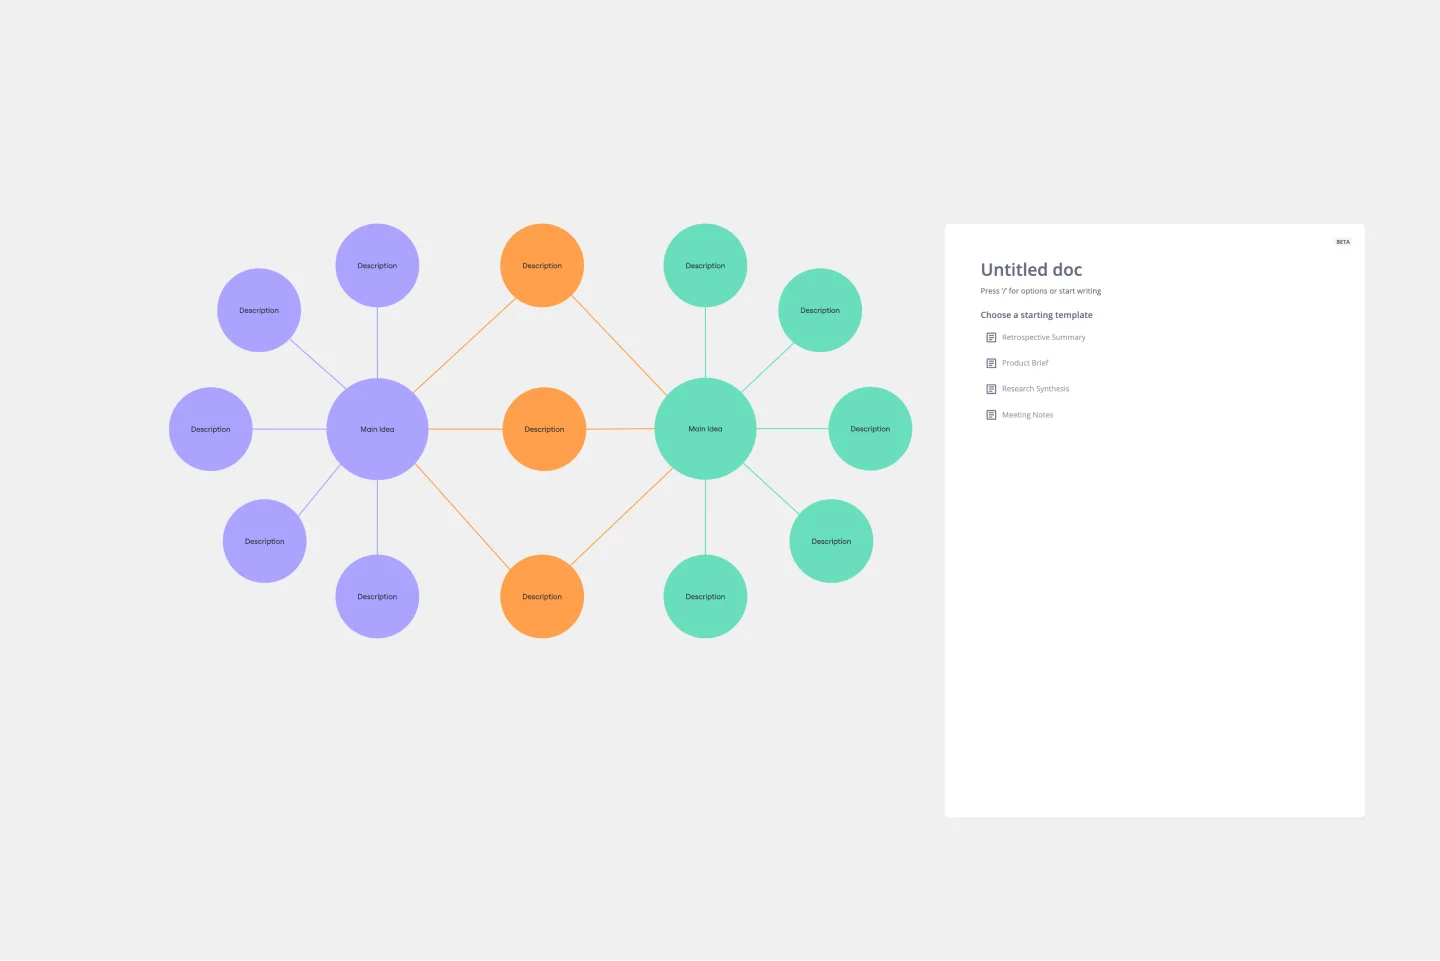
Double Bubble Map Template serves as a powerful tool to facilitate teamwork and streamline idea exploration. This adaptable template empowers teams to brainstorm, analyze, and compare concepts with ease, making it an invaluable asset for enhancing creativity and fostering clarity among team members.
Cluster Diagram Template
Works best for:
Diagramming
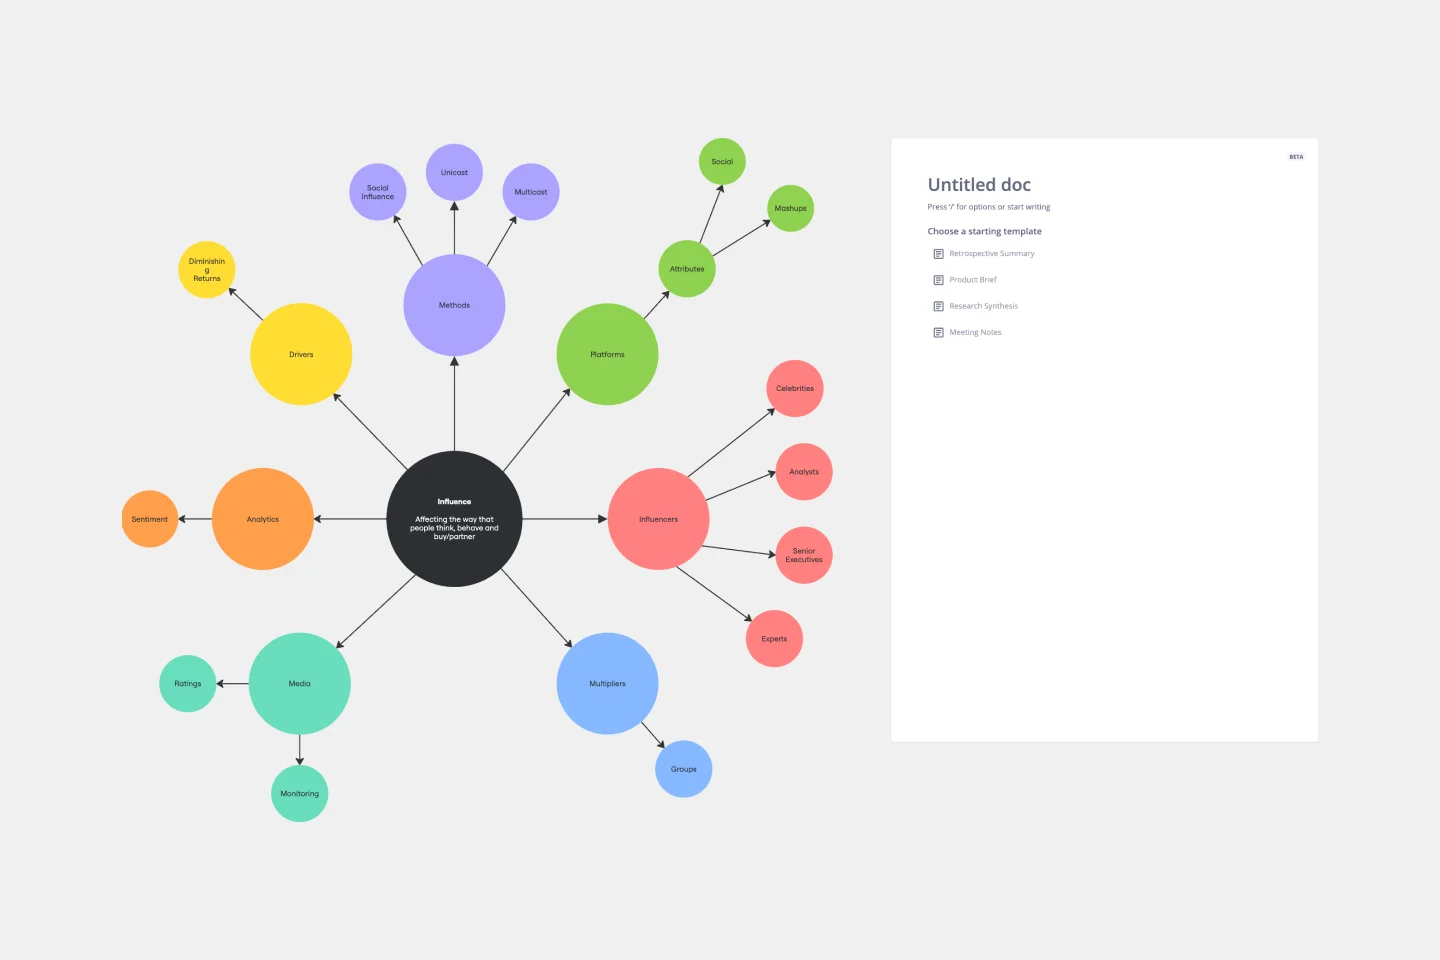
The Cluster Diagram Template is a valuable tool for organizing and connecting ideas, concepts, and information in a visually compelling and coherent manner. The template's design centers on grouping related ideas around a core concept, creating a transparent and hierarchical structure. This clustering not only aids in breaking down complex information into manageable segments but also significantly enhances the process of idea generation and brainstorming. A structured yet flexible visual framework encourages deeper engagement and more precise understanding, making it an essential asset for teams and people looking to bring order to their creative and analytical processes.
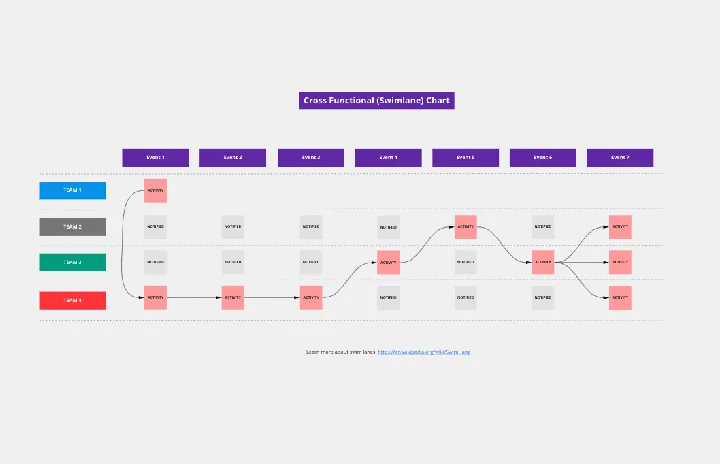
Cross Functional (Swimlane) Chart
Works best for:
Flowcharts, Mapping, Diagrams
The Cross Functional (Swimlane) Chart template offers a visual tool for mapping out processes or workflows with multiple stakeholders or functional areas. It provides swimlanes for organizing tasks and responsibilities by department or role. This template enables teams to visualize process flows, identify handoffs, and improve coordination and collaboration across functions. By promoting transparency and accountability, the Cross Functional (Swimlane) Chart empowers organizations to streamline workflows and drive cross-functional alignment effectively.